Grunnleggende statistikk
| Institusjonelle eiere | 132 total, 132 long only, 0 short only, 0 long/short - change of 3,12% MRQ |
| Gjennomsnittlig porteføljeallokering | 0.2270 % - change of −3,30% MRQ |
| Institusjonelle aksjer (Long) | 8 716 184 (ex 13D/G) - change of 0,27MM shares 3,24% MRQ |
| Institusjonell verdi (Long) | $ 497 114 USD ($1000) |
Institusjonelt eierskap og aksjonærer
Fidelity Covington Trust - Fidelity Value Factor ETF (US:FVAL) har 132 institusjonelle eiere og aksjonærer som har sendt inn 13D/G- eller 13F-skjemaer til Securities Exchange Commission (SEC). Disse institusjonene eier til sammen 8,716,184 aksjer. De største aksjonærene inkluderer Fmr Llc, Envestnet Asset Management Inc, Commonwealth Equity Services, Llc, High Probability Advisors, LLC, Royal Bank Of Canada, Custos Family Office, LLC, LPL Financial LLC, Advisor Group Holdings, Inc., Jpmorgan Chase & Co, and Kestra Advisory Services, LLC .
Fidelity Covington Trust - Fidelity Value Factor ETF (ARCA:FVAL) institusjonell eierstruktur viser nåværende posisjoner i selskapet fordelt på institusjoner og fond, samt de siste endringene i posisjonsstørrelse. De største aksjonærene kan være individuelle investorer, verdipapirfond, hedgefond eller institusjoner. Schedule 13D indikerer at investoren eier (eller har eid) mer enn 5 % av selskapet og har til hensikt (eller hadde til hensikt) å aktivt forfølge en endring i forretningsstrategien. Schedule 13G indikerer en passiv investering på over 5 %.
The share price as of September 12, 2025 is 68,50 / share. Previously, on September 16, 2024, the share price was 59,21 / share. This represents an increase of 15,69% over that period.

Fondssentiment-score
Fondssentiment Score (også kjent som akkumulering av eierskap poengsum) viser hvilke aksjer som er mest kjøpt av fond. Den er resultatet av en sofistikert, kvantitativ flerfaktormodell som identifiserer selskaper med de høyeste nivåene av institusjonell akkumulering. Beregningsmodellen for poeng bruker en kombinasjon av den totale økningen i antall offentliggjorte eiere, endringer i porteføljeallokeringen til disse eierne og andre beregninger. Tallet går fra 0 til 100, der høyere tall indikerer en høyere grad av akkumulering i forhold til sammenlignbare selskaper, der 50 er gjennomsnittet.
Oppdateringsfrekvens: Daglig
Sjekk ut Ownership Explorer, som inneholder en liste over de høyest rangerte selskapene.
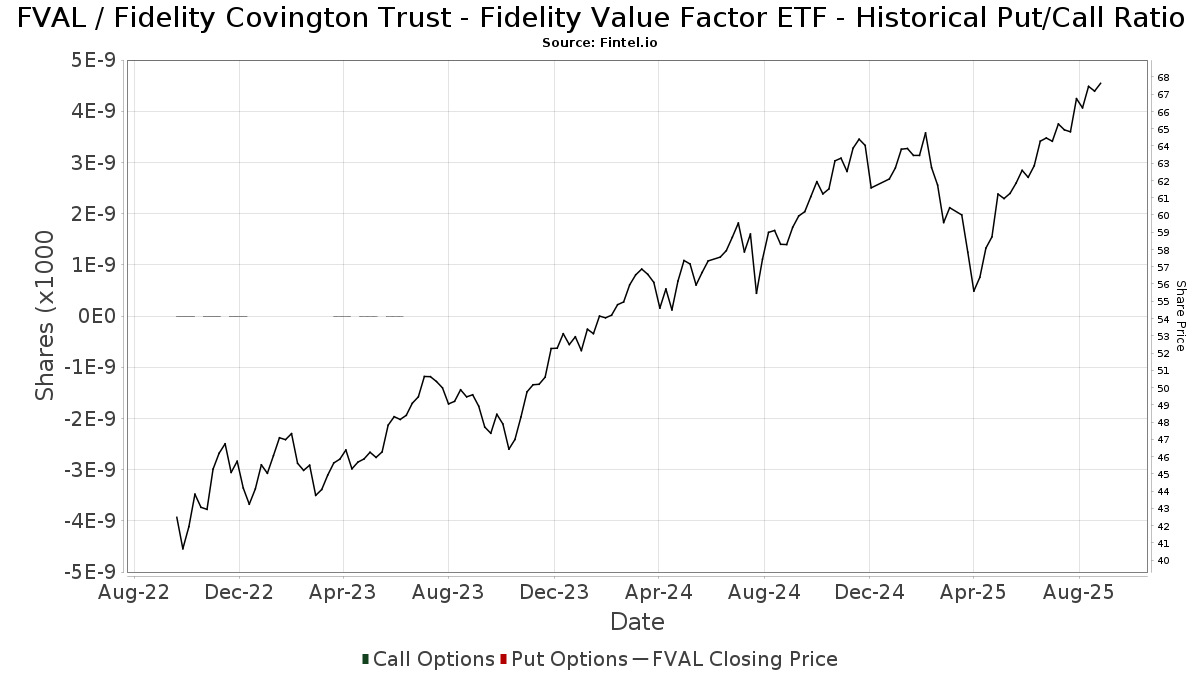
Institusjonell Put/Call-forhold
I tillegg til å rapportere standard aksje- og gjeldsemisjoner må institusjoner med mer enn 100 millioner kroner i forvaltningskapital også oppgi beholdningen av put- og callopsjoner. Siden put-opsjoner generelt indikerer et negativt sentiment, og call-opsjoner indikerer et positivt sentiment, kan vi få et inntrykk av det generelle institusjonelle sentimentet ved å plotte forholdet mellom put- og call-opsjoner. Diagrammet til høyre viser det historiske forholdet mellom put- og call-opsjoner for dette instrumentet.
Ved å bruke Put/Call-forholdet som en indikator på investorsentimentet kan man overvinne en av de viktigste svakhetene ved å bruke totalt institusjonelt eierskap, nemlig at en betydelig andel av forvaltningskapitalen investeres passivt for å følge indekser. Passivt forvaltede fond kjøper vanligvis ikke opsjoner, slik at indikatoren for put/call-forhold i større grad gjenspeiler stemningen i aktivt forvaltede fond.
13F- og NPORT-arkiveringer
Detaljer om 13F-arkiveringer er gratis. Detaljer om NP-arkiveringer krever et premium-medlemskap. Grønne rader indikerer nye posisjoner. Røde rader indikerer lukkede posisjoner. Klikk på lenke ikonet for å se hele transaksjonshistorikken.
Oppgrader
for å låse opp premiedata og eksportere til Excel. ![]() .
.
| Fildato | Kilde | Investor | Type | Gjennomsnittlig pris (estimert) |
Aksjer | Δ Aksjer (%) |
Rapportert verdi ($1000) | Verdi (%) | Portallokering (%) | |
|---|---|---|---|---|---|---|---|---|---|---|
| 2025-08-15 | 13F | Kestra Advisory Services, LLC | 178 389 | 19,57 | 11 394 | 28,16 | ||||
| 2025-07-29 | NP | EBI - Longview Advantage ETF | 0 | −100,00 | 0 | −100,00 | ||||
| 2025-08-14 | 13F | Federation des caisses Desjardins du Quebec | 80 | 0,00 | 5 | 25,00 | ||||
| 2025-09-04 | 13F/A | Advisor Group Holdings, Inc. | 246 102 | −0,87 | 15 722 | 6,24 | ||||
| 2025-07-21 | 13F | Ameriflex Group, Inc. | 0 | −100,00 | 0 | |||||
| 2025-08-15 | 13F | Morgan Stanley | 121 470 | −3,90 | 7 758 | 3,00 | ||||
| 2025-05-12 | 13F | Americana Partners, LLC | 0 | −100,00 | 0 | |||||
| 2025-08-26 | 13F/A | Thrivent Financial For Lutherans | 26 970 | −95,28 | 2 | −97,22 | ||||
| 2025-04-21 | 13F | PSI Advisors, LLC | 0 | −100,00 | 0 | |||||
| 2025-08-14 | 13F | Certified Advisory Corp | 5 461 | 0,39 | 349 | 7,41 | ||||
| 2025-08-13 | 13F | Twin Peaks Wealth Advisors, LLC | 982 | 65 | ||||||
| 2025-07-11 | 13F | Bouvel Investment Partners, LLC | 45 304 | −9,63 | 2 894 | −4,74 | ||||
| 2025-07-25 | 13F | Atria Wealth Solutions, Inc. | 27 598 | −8,55 | 1 766 | −1,78 | ||||
| 2025-07-08 | 13F | Zrc Wealth Management, Llc | 18 | 0,00 | 1 | 0,00 | ||||
| 2025-08-08 | 13F | Thoroughbred Financial Services, Llc | 4 933 | −62,14 | 0 | |||||
| 2025-04-11 | 13F | Unique Wealth, Llc | 0 | −100,00 | 0 | |||||
| 2025-07-24 | 13F | Blair William & Co/il | 200 | 0,00 | 13 | 9,09 | ||||
| 2025-08-14 | 13F | Mml Investors Services, Llc | 12 236 | 50,23 | 1 | |||||
| 2025-07-08 | 13F | Prism Advisors, Inc. | 81 530 | 0,00 | 5 207 | 7,18 | ||||
| 2025-08-18 | 13F/A | Kestra Investment Management, LLC | 3 497 | 223 | ||||||
| 2025-08-04 | 13F | Kovack Advisors, Inc. | 5 592 | 1,10 | 357 | 8,51 | ||||
| 2025-08-14 | 13F | Stifel Financial Corp | 3 486 | −1,33 | 223 | 5,71 | ||||
| 2025-08-14 | 13F | Clarity Asset Management, Inc. | 2 129 | −6,95 | 136 | −0,74 | ||||
| 2025-07-28 | 13F | Axxcess Wealth Management, Llc | 0 | −100,00 | 0 | |||||
| 2025-07-17 | 13F | Montis Financial, LLC | 13 560 | −3,74 | 866 | 3,22 | ||||
| 2025-04-21 | 13F | PUREfi Wealth, LLC | 0 | −100,00 | 0 | |||||
| 2025-08-06 | 13F | Hoxton Planning & Management, LLC | 8 830 | 0,00 | 564 | 7,03 | ||||
| 2025-08-13 | 13F | Flow Traders U.s. Llc | 0 | −100,00 | 0 | |||||
| 2025-08-14 | 13F | Sunbelt Securities, Inc. | 8 590 | −31,87 | 529 | −29,69 | ||||
| 2025-08-07 | 13F | Kestra Private Wealth Services, Llc | 104 980 | 3,02 | 6 705 | 10,42 | ||||
| 2025-07-15 | 13F | Avaii Wealth Management, Llc | 4 527 | −0,98 | 289 | 6,25 | ||||
| 2025-07-21 | 13F | Ameritas Advisory Services, LLC | 3 496 | −62,93 | 223 | −61,28 | ||||
| 2025-07-30 | 13F | Cullen/frost Bankers, Inc. | 7 669 | 17,86 | 490 | 26,36 | ||||
| 2025-08-27 | 13F/A | Brinker Capital Investments, LLC | 31 823 | 22,00 | 2 033 | 30,76 | ||||
| 2025-08-01 | 13F | Envestnet Asset Management Inc | 1 398 051 | 7,23 | 89 293 | 14,93 | ||||
| 2025-08-04 | 13F | Spire Wealth Management | 42 | 0,00 | 3 | 0,00 | ||||
| 2025-08-12 | 13F | Atlas Capital Advisors Llc | 264 | 0,00 | 17 | 6,67 | ||||
| 2025-08-14 | 13F | Susquehanna International Group, Llp | 49 535 | 115,02 | 3 164 | 130,54 | ||||
| 2025-08-14 | 13F | Fmr Llc | 1 712 580 | 78,90 | 109 382 | 91,75 | ||||
| 2025-08-08 | 13F | CFO4Life Group, LLC | 4 118 | −3,51 | 263 | 3,54 | ||||
| 2025-08-14 | 13F | Quantinno Capital Management LP | 5 324 | 340 | ||||||
| 2025-07-30 | 13F | Strategic Blueprint, LLC | 14 467 | 924 | ||||||
| 2025-08-19 | 13F | National Asset Management, Inc. | 17 973 | 1 148 | ||||||
| 2025-08-12 | 13F | MAI Capital Management | 150 335 | 0,13 | 9 602 | 7,31 | ||||
| 2025-08-13 | 13F | Vermillion & White Wealth Management Group, LLC | 78 | 0,00 | 5 | 0,00 | ||||
| 2025-08-14 | 13F | Bank Of America Corp /de/ | 140 932 | 7,93 | 9 001 | 15,68 | ||||
| 2025-08-06 | 13F | AE Wealth Management LLC | 22 959 | −76,01 | 1 466 | −74,29 | ||||
| 2025-04-14 | 13F | Patriot Financial Group Insurance Agency, LLC | 0 | −100,00 | 0 | −100,00 | ||||
| 2025-08-12 | 13F | J.w. Cole Advisors, Inc. | 13 969 | 2,96 | 892 | 10,40 | ||||
| 2025-08-11 | 13F | Private Advisor Group, LLC | 8 104 | 10,95 | 518 | 18,85 | ||||
| 2025-07-18 | 13F | Childress Capital Advisors, Llc | 0 | −100,00 | 0 | −100,00 | ||||
| 2025-07-23 | 13F | Sax Wealth Advisors, Llc | 64 778 | 9,42 | 4 137 | 17,30 | ||||
| 2025-08-05 | 13F | Sigma Planning Corp | 23 822 | −0,51 | 1 522 | 6,66 | ||||
| 2025-08-12 | 13F | Global Retirement Partners, LLC | 5 645 | 0,18 | 361 | 4,05 | ||||
| 2025-08-07 | 13F | BOK Financial Private Wealth, Inc. | 72 | 5 | ||||||
| 2025-07-11 | 13F | Farther Finance Advisors, LLC | 4 152 | 4 672,41 | 265 | 5 200,00 | ||||
| 2025-08-18 | 13F | Geneos Wealth Management Inc. | 223 | 0,00 | 14 | 7,69 | ||||
| 2025-05-15 | 13F/A | Orion Portfolio Solutions, LLC | 26 085 | −5,62 | 1 554 | −8,59 | ||||
| 2025-08-14 | 13F/A | Rockefeller Capital Management L.P. | 26 785 | 6,47 | 1 711 | 14,08 | ||||
| 2025-08-14 | 13F | Goodwin Investment Advisory | 78 879 | 21,00 | 5 038 | 29,71 | ||||
| 2025-07-14 | 13F | AdvisorNet Financial, Inc | 1 242 | 0,32 | 79 | 8,22 | ||||
| 2025-04-30 | 13F | Quotient Wealth Partners, LLC | 0 | −100,00 | 0 | |||||
| 2025-07-15 | 13F | Colonial River Wealth Management, LLC | 0 | −100,00 | 0 | |||||
| 2025-08-04 | 13F | Assetmark, Inc | 3 652 | 2,56 | 233 | 9,91 | ||||
| 2025-08-14 | 13F | Integrated Wealth Concepts LLC | 3 242 | −30,37 | 207 | −25,27 | ||||
| 2025-08-13 | 13F | Transce3nd, LLC | 29 | 0,00 | 2 | 0,00 | ||||
| 2025-08-14 | 13F | Glen Eagle Advisors, LLC | 2 850 | 0,00 | 182 | 7,69 | ||||
| 2025-07-22 | 13F | Foguth Wealth Management, LLC. | 4 211 | −12,76 | 269 | −6,62 | ||||
| 2025-07-17 | 13F | Prepared Retirement Institute LLC | 5 927 | 0,36 | 379 | 7,69 | ||||
| 2025-07-29 | 13F | Spectrum Investment Advisors, Inc. | 15 089 | 5,96 | 964 | 13,56 | ||||
| 2025-07-10 | 13F | Wealth Enhancement Advisory Services, Llc | 10 375 | −6,91 | 672 | 1,05 | ||||
| 2025-07-16 | 13F | Signaturefd, Llc | 0 | −100,00 | 0 | |||||
| 2025-08-12 | 13F | Jpmorgan Chase & Co | 208 079 | 7,44 | 13 290 | 15,16 | ||||
| 2025-08-08 | 13F | Foundations Investment Advisors, LLC | 15 056 | 13,88 | 962 | 22,11 | ||||
| 2025-08-14 | 13F | GWM Advisors LLC | 7 775 | 6,89 | 497 | 14,55 | ||||
| 2025-07-30 | 13F | Principle Wealth Partners Llc | 6 167 | 0,00 | 394 | 7,08 | ||||
| 2025-08-01 | 13F | Gwn Securities Inc. | 9 057 | −12,34 | 579 | −6,02 | ||||
| 2025-08-14 | 13F | Qube Research & Technologies Ltd | 0 | −100,00 | 0 | |||||
| 2025-07-24 | 13F | Cyndeo Wealth Partners, LLC | 5 320 | 0,08 | 340 | 7,28 | ||||
| 2025-05-13 | 13F | Steward Partners Investment Advisory, Llc | 0 | −100,00 | 0 | |||||
| 2025-07-28 | 13F | Mowery & Schoenfeld Wealth Management, LLC | 0 | −100,00 | 0 | |||||
| 2025-08-14 | 13F | Jane Street Group, Llc | 9 283 | 593 | ||||||
| 2025-05-20 | 13F/A | Colony Group, LLC | 0 | −100,00 | 0 | |||||
| 2025-08-06 | 13F | Forbes Financial Planning, Inc. | 84 443 | −24,77 | 5 393 | −19,36 | ||||
| 2025-08-14 | 13F | Royal Bank Of Canada | 357 889 | 116,85 | 22 859 | 132,43 | ||||
| 2025-07-21 | 13F | Ascent Group, LLC | 5 183 | 2,37 | 331 | 9,97 | ||||
| 2025-07-31 | 13F | Cambridge Investment Research Advisors, Inc. | 43 647 | 26,14 | 3 | 0,00 | ||||
| 2025-08-14 | 13F | Atomi Financial Group, Inc. | 0 | −100,00 | 0 | |||||
| 2025-08-14 | 13F | Raymond James Financial Inc | 32 636 | 18,43 | 2 084 | 26,92 | ||||
| 2025-08-06 | 13F | Vantage Financial Partners, LLC | 146 131 | 0,04 | 9 333 | 7,23 | ||||
| 2025-07-15 | 13F | LVZ Advisors, Inc. | 28 311 | 1 808 | ||||||
| 2025-08-07 | 13F | New England Private Wealth Advisors LLC | 3 315 | 215 | ||||||
| 2025-08-14 | 13F | Mariner, LLC | 3 647 | −6,34 | 233 | 0,00 | ||||
| 2025-08-19 | 13F | Advisory Services Network, LLC | 4 284 | −2,86 | 277 | 5,34 | ||||
| 2025-08-08 | 13F | Cetera Investment Advisers | 177 883 | 7,89 | 11 361 | 15,63 | ||||
| 2025-08-01 | 13F | Cedar Point Capital Partners, LLC | 56 078 | 5,93 | 3 582 | 13,54 | ||||
| 2025-07-29 | 13F | Primoris Wealth Advisors, Llc | 45 482 | 40,09 | 2 905 | 50,16 | ||||
| 2025-08-04 | 13F | Bay Colony Advisory Group, Inc d/b/a Bay Colony Advisors | 4 162 | 2,54 | 266 | 10,42 | ||||
| 2025-08-13 | 13F | Northwestern Mutual Wealth Management Co | 4 062 | −45,02 | 259 | −41,14 | ||||
| 2025-08-01 | 13F | Schmidt P J Investment Management Inc | 13 335 | 185,00 | 852 | 206,12 | ||||
| 2025-07-28 | 13F | Sagespring Wealth Partners, Llc | 4 020 | −62,38 | 257 | −59,75 | ||||
| 2025-08-14 | 13F | Foronjy Financial Llc | 3 428 | 219 | ||||||
| 2025-08-14 | 13F | Comerica Bank | 2 182 | 0,00 | 139 | 6,92 | ||||
| 2025-07-21 | 13F | Custos Family Office, LLC | 321 535 | 0,72 | 20 536 | 7,95 | ||||
| 2025-08-12 | 13F | O'shaughnessy Asset Management, Llc | 57 | −82,78 | 4 | −84,21 | ||||
| 2025-08-08 | 13F | Altfest L J & Co Inc | 39 660 | −4,02 | 2 533 | 2,88 | ||||
| 2025-08-11 | 13F | Traub Capital Management LLC | 18 915 | 1 208 | ||||||
| 2025-08-13 | 13F | Jones Financial Companies Lllp | 26 135 | 53,31 | 1 662 | 64,72 | ||||
| 2025-08-14 | 13F | Harwood Advisory Group, LLC | 16 818 | −4,33 | 1 074 | −0,65 | ||||
| 2025-08-14 | 13F | Glenmede Investment Management, LP | 253 | 16 | ||||||
| 2025-05-02 | 13F | Capital A Wealth Management, LLC | 12 | 0,00 | 1 | |||||
| 2025-07-07 | 13F | Kings Path Partners LLC | 3 | 0 | ||||||
| 2025-07-30 | 13F | Avidian Wealth Solutions, LLC | 0 | −100,00 | 0 | |||||
| 2025-07-10 | 13F | Oliver Lagore Vanvalin Investment Group | 14 | 366,67 | 1 | |||||
| 2025-08-12 | 13F | SRS Capital Advisors, Inc. | 44 | 3 | ||||||
| 2025-08-05 | 13F | Dynasty Wealth Management, Llc | 4 895 | 0,55 | 313 | 7,59 | ||||
| 2025-08-14 | 13F | Goldman Sachs Group Inc | 30 572 | 10,01 | 1 953 | 17,87 | ||||
| 2025-08-07 | 13F | Allworth Financial LP | 9 558 | 0,15 | 610 | 11,11 | ||||
| 2025-08-08 | 13F | Crossmark Global Holdings, Inc. | 8 098 | −11,21 | 517 | −4,79 | ||||
| 2025-08-08 | 13F | Capital Investment Counsel, Inc | 2 230 | 0,00 | 142 | 7,58 | ||||
| 2025-08-12 | 13F | Proequities, Inc. | 0 | 0 | ||||||
| 2025-07-22 | 13F | Inlight Wealth Management, LLC | 0 | −100,00 | 0 | |||||
| 2025-08-12 | 13F | Wood Tarver Financial Group, LLC | 4 084 | 0,00 | 0 | −100,00 | ||||
| 2025-05-15 | 13F | Marshall & Sterling Wealth Advisors Inc. | 0 | −100,00 | 0 | |||||
| 2025-08-04 | 13F | Arkadios Wealth Advisors | 3 746 | 3,05 | 239 | 10,65 | ||||
| 2025-07-25 | 13F | Cwm, Llc | 0 | −100,00 | 0 | |||||
| 2025-08-06 | 13F | Golden State Wealth Management, LLC | 28 | 0,00 | 2 | 0,00 | ||||
| 2025-08-07 | 13F | Samalin Investment Counsel, LLC | 9 090 | −18,34 | 581 | −12,52 | ||||
| 2025-08-08 | 13F | Condor Capital Management | 109 495 | 1,98 | 6 993 | 9,32 | ||||
| 2025-07-23 | 13F | Valmark Advisers, Inc. | 24 748 | 0,73 | 1 581 | 7,92 | ||||
| 2025-07-25 | 13F | Sequoia Financial Advisors, LLC | 6 062 | 2,33 | 387 | 9,63 | ||||
| 2025-07-31 | 13F | CNB Bank | 686 | 0,00 | 44 | 7,50 | ||||
| 2025-08-14 | 13F | Two Sigma Investments, Lp | 101 800 | −50,44 | 6 502 | −46,88 | ||||
| 2025-08-14 | 13F | Hrt Financial Lp | 4 210 | 0 | ||||||
| 2025-08-07 | 13F | PFG Advisors | 0 | −100,00 | 0 | |||||
| 2025-08-14 | 13F | UBS Group AG | 1 179 | 75 | ||||||
| 2025-08-14 | 13F | LaSalle St. Investment Advisors, LLC | 4 791 | −20,24 | 0 | |||||
| 2025-08-12 | 13F | Founders Financial Alliance, LLC | 759 | 15,17 | 48 | 23,08 | ||||
| 2025-07-10 | 13F | Signal Advisors Wealth, LLC | 4 211 | −10,46 | 269 | −4,29 | ||||
| 2025-07-09 | 13F | Dynamic Advisor Solutions LLC | 178 222 | 2,48 | 11 383 | 9,85 | ||||
| 2025-04-28 | 13F | Clarity Capital Partners LLC | 0 | −100,00 | 0 | |||||
| 2025-08-08 | 13F | Creative Planning | 110 004 | −2,70 | 7 026 | 4,27 | ||||
| 2025-08-13 | 13F | Russell Investments Group, Ltd. | 37 | 2 | ||||||
| 2025-08-14 | 13F | Citadel Advisors Llc | 32 237 | −25,23 | 2 059 | −19,89 | ||||
| 2025-08-06 | 13F | Commonwealth Equity Services, Llc | 830 198 | −2,73 | 53 | 6,00 | ||||
| 2025-08-12 | 13F | LPL Financial LLC | 294 469 | 15,90 | 18 808 | 24,22 | ||||
| 2025-08-14 | 13F | CoreCap Advisors, LLC | 5 352 | −1,20 | 342 | 5,90 | ||||
| 2025-05-19 | 13F | Heck Capital Advisors, LLC | 0 | 0 | ||||||
| 2025-07-09 | 13F | High Probability Advisors, LLC | 414 937 | 9,83 | 26 502 | 17,72 | ||||
| 2025-08-13 | 13F | Cerity Partners LLC | 7 853 | 0,10 | 502 | 7,28 | ||||
| 2025-07-07 | 13F | Thurston, Springer, Miller, Herd & Titak, Inc. | 245 | 0,00 | 16 | 7,14 | ||||
| 2025-08-14 | 13F | Wells Fargo & Company/mn | 23 | −93,92 | 1 | −95,45 | ||||
| 2025-08-11 | 13F | Citigroup Inc | 2 054 | 0,00 | 131 | 7,38 | ||||
| 2025-07-24 | 13F | IFP Advisors, Inc | 3 317 | 5,60 | 212 | 12,83 | ||||
| 2025-07-31 | 13F | Glass Jacobson Investment Advisors llc | 3 968 | 0,84 | 253 | 4,55 | ||||
| 2025-08-11 | 13F | Principal Securities, Inc. | 613 | −77,72 | 39 | −76,92 | ||||
| 2025-07-25 | 13F | Envestnet Portfolio Solutions, Inc. | 29 371 | 12,72 | 1 876 | 20,81 | ||||
| 2025-04-17 | 13F | Fairvoy Private Wealth, LLC | 0 | −100,00 | 0 | |||||
| 2025-08-14 | 13F | Kovitz Investment Group Partners, LLC | 3 500 | 224 | ||||||
| 2025-08-11 | 13F | NewEdge Wealth, LLC | 0 | −100,00 | 0 |