Grunnleggende statistikk
| Institusjonelle eiere | 134 total, 131 long only, 0 short only, 3 long/short - change of 3,08% MRQ |
| Gjennomsnittlig porteføljeallokering | 0.1463 % - change of −3,70% MRQ |
| Institusjonelle aksjer (Long) | 37 663 584 (ex 13D/G) - change of 27,84MM shares 283,53% MRQ |
| Institusjonell verdi (Long) | $ 186 302 USD ($1000) |
Institusjonelt eierskap og aksjonærer
Fidus Investment Corporation (US:FDUS) har 134 institusjonelle eiere og aksjonærer som har sendt inn 13D/G- eller 13F-skjemaer til Securities Exchange Commission (SEC). Disse institusjonene eier til sammen 37,663,584 aksjer. De største aksjonærene inkluderer Kingstone Capital Partners Texas, LLC, Van Eck Associates Corp, Raymond James Financial Inc, BIZD - VanEck Vectors BDC Income ETF, Invesco Ltd., KBWD - Invesco KBW High Dividend Yield Financial ETF, Two Sigma Advisers, Lp, Cetera Investment Advisers, Envestnet Asset Management Inc, and Columbus Macro, LLC .
Fidus Investment Corporation (NasdaqGS:FDUS) institusjonell eierstruktur viser nåværende posisjoner i selskapet fordelt på institusjoner og fond, samt de siste endringene i posisjonsstørrelse. De største aksjonærene kan være individuelle investorer, verdipapirfond, hedgefond eller institusjoner. Schedule 13D indikerer at investoren eier (eller har eid) mer enn 5 % av selskapet og har til hensikt (eller hadde til hensikt) å aktivt forfølge en endring i forretningsstrategien. Schedule 13G indikerer en passiv investering på over 5 %.
The share price as of September 10, 2025 is 21,32 / share. Previously, on September 11, 2024, the share price was 19,62 / share. This represents an increase of 8,66% over that period.

Fondssentiment-score
Fondssentiment Score (også kjent som akkumulering av eierskap poengsum) viser hvilke aksjer som er mest kjøpt av fond. Den er resultatet av en sofistikert, kvantitativ flerfaktormodell som identifiserer selskaper med de høyeste nivåene av institusjonell akkumulering. Beregningsmodellen for poeng bruker en kombinasjon av den totale økningen i antall offentliggjorte eiere, endringer i porteføljeallokeringen til disse eierne og andre beregninger. Tallet går fra 0 til 100, der høyere tall indikerer en høyere grad av akkumulering i forhold til sammenlignbare selskaper, der 50 er gjennomsnittet.
Oppdateringsfrekvens: Daglig
Sjekk ut Ownership Explorer, som inneholder en liste over de høyest rangerte selskapene.
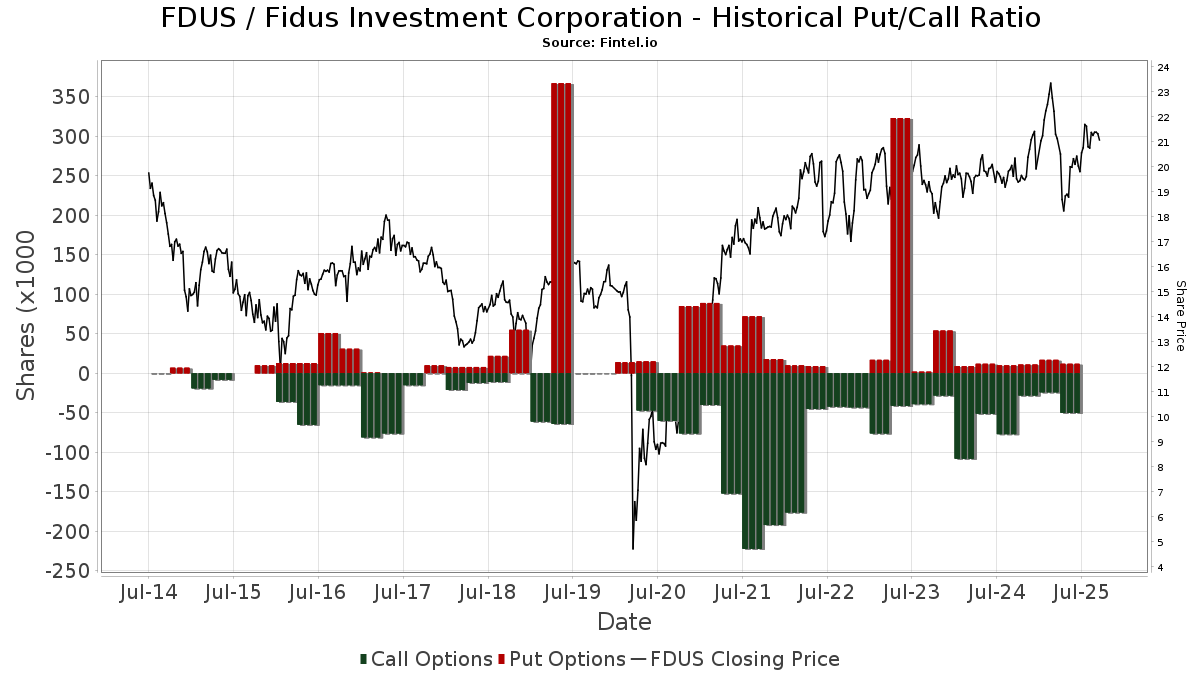
Institusjonell Put/Call-forhold
I tillegg til å rapportere standard aksje- og gjeldsemisjoner må institusjoner med mer enn 100 millioner kroner i forvaltningskapital også oppgi beholdningen av put- og callopsjoner. Siden put-opsjoner generelt indikerer et negativt sentiment, og call-opsjoner indikerer et positivt sentiment, kan vi få et inntrykk av det generelle institusjonelle sentimentet ved å plotte forholdet mellom put- og call-opsjoner. Diagrammet til høyre viser det historiske forholdet mellom put- og call-opsjoner for dette instrumentet.
Ved å bruke Put/Call-forholdet som en indikator på investorsentimentet kan man overvinne en av de viktigste svakhetene ved å bruke totalt institusjonelt eierskap, nemlig at en betydelig andel av forvaltningskapitalen investeres passivt for å følge indekser. Passivt forvaltede fond kjøper vanligvis ikke opsjoner, slik at indikatoren for put/call-forhold i større grad gjenspeiler stemningen i aktivt forvaltede fond.
13F- og NPORT-arkiveringer
Detaljer om 13F-arkiveringer er gratis. Detaljer om NP-arkiveringer krever et premium-medlemskap. Grønne rader indikerer nye posisjoner. Røde rader indikerer lukkede posisjoner. Klikk på lenke ikonet for å se hele transaksjonshistorikken.
Oppgrader
for å låse opp premiedata og eksportere til Excel. ![]() .
.
| Fildato | Kilde | Investor | Type | Gjennomsnittlig pris (estimert) |
Aksjer | Δ Aksjer (%) |
Rapportert verdi ($1000) | Verdi (%) | Portallokering (%) | |
|---|---|---|---|---|---|---|---|---|---|---|
| 2025-08-06 | 13F | First Horizon Advisors, Inc. | 2 658 | 154,84 | 54 | 152,38 | ||||
| 2025-05-05 | 13F | IFP Advisors, Inc | 0 | −100,00 | 0 | |||||
| 2025-08-14 | 13F | Group One Trading, L.p. | Call | 1 800 | 36 | |||||
| 2025-08-01 | 13F | Envestnet Asset Management Inc | 359 415 | 10,84 | 7 260 | 9,80 | ||||
| 2025-08-13 | 13F | Plan Group Financial, LLC | 49 763 | 38,85 | 1 005 | 37,67 | ||||
| 2025-07-22 | 13F | DAVENPORT & Co LLC | 36 237 | 0,00 | 732 | −0,95 | ||||
| 2025-08-08 | 13F | Capital Investment Advisory Services, LLC | 84 524 | 13,97 | 1 707 | 12,90 | ||||
| 2025-07-10 | 13F | Atticus Wealth Management, Llc | 3 816 | 77 | ||||||
| 2025-08-14 | 13F | Group One Trading, L.p. | Put | 100 | 2 | |||||
| 2025-08-14 | 13F | Quarry LP | 2 366 | 71,45 | 48 | 67,86 | ||||
| 2025-08-04 | 13F | Muzinich & Co., Inc. | 190 228 | 106,50 | 3 843 | 104,58 | ||||
| 2025-07-31 | 13F | Caitong International Asset Management Co., Ltd | 4 | 100,00 | 0 | |||||
| 2025-08-11 | 13F | Hexagon Capital Partners LLC | 0 | −100,00 | 0 | |||||
| 2025-08-14 | 13F | GWM Advisors LLC | 91 113 | −10,24 | 1 840 | −11,07 | ||||
| 2025-08-07 | 13F | Campbell & CO Investment Adviser LLC | 23 049 | −34,36 | 466 | −35,06 | ||||
| 2025-07-28 | NP | KBWD - Invesco KBW High Dividend Yield Financial ETF This fund is a listed as child fund of Invesco Ltd. and if that institution has disclosed ownership in this security, then these positions will not be double counted when calculating total shares and total value | 430 044 | −21,66 | 8 812 | −31,08 | ||||
| 2025-08-14 | 13F | Verition Fund Management LLC | 14 100 | 285 | ||||||
| 2025-08-12 | 13F | Legal & General Group Plc | 228 512 | 0,94 | 4 616 | −0,02 | ||||
| 2025-07-21 | 13F | Ameritas Advisory Services, LLC | 200 | 4 | ||||||
| 2025-08-12 | 13F | Cornerstone Wealth Management, LLC | 27 173 | 7,80 | 549 | 6,82 | ||||
| 2025-08-13 | 13F | Level Four Advisory Services, Llc | 30 487 | −13,98 | 616 | −14,82 | ||||
| 2025-08-04 | 13F | MeadowBrook Investment Advisors LLC | 2 850 | 90,00 | 58 | 90,00 | ||||
| 2025-08-29 | NP | JAFEX - Total Stock Market Index Trust NAV | 641 | 19,37 | 13 | 9,09 | ||||
| 2025-05-14 | 13F | Virtus ETF Advisers LLC | 0 | −100,00 | 0 | |||||
| 2025-07-10 | 13F | Capital Advisory Group Advisory Services, LLC | 77 618 | 1,98 | 1 568 | 1,03 | ||||
| 2025-08-08 | 13F | Hartland & Co., LLC | 20 661 | 0,44 | 417 | −0,48 | ||||
| 2025-05-16 | 13F | McIlrath & Eck, LLC | 0 | −100,00 | 0 | |||||
| 2025-07-18 | 13F | Truist Financial Corp | 45 703 | −2,67 | 909 | −5,12 | ||||
| 2025-07-29 | 13F | TrueMark Investments, LLC | 0 | −100,00 | 0 | |||||
| 2025-08-11 | 13F | Brown Brothers Harriman & Co | 5 337 | 0,00 | 108 | −0,93 | ||||
| 2025-07-17 | 13F | Janney Montgomery Scott LLC | 10 463 | 0,00 | 0 | |||||
| 2025-08-14 | 13F | Stifel Financial Corp | 13 995 | −21,95 | 283 | −22,74 | ||||
| 2025-08-13 | 13F | Virtus Investment Advisers, Inc. | 41 255 | −2,66 | 833 | −3,59 | ||||
| 2025-08-14 | 13F | Quantinno Capital Management LP | 27 165 | 549 | ||||||
| 2025-08-14 | 13F | Bnp Paribas Arbitrage, Sa | 38 | 1 | ||||||
| 2025-05-02 | 13F | Hager Investment Management Services, Llc | 0 | −100,00 | 0 | |||||
| 2025-07-23 | 13F | Morey & Quinn Wealth Partners, LLC | 14 778 | 0,00 | 299 | −1,00 | ||||
| 2025-08-14 | 13F | Smartleaf Asset Management LLC | 7 | 0,00 | 0 | |||||
| 2025-07-23 | 13F | 1 North Wealth Services Llc | 600 | 0,00 | 12 | 0,00 | ||||
| 2025-08-13 | 13F | Advisory Research Inc | 10 574 | 6,14 | 214 | 4,93 | ||||
| 2025-08-14 | 13F | Summit Trail Advisors, Llc | 22 502 | 455 | ||||||
| 2025-08-14 | 13F | Mercer Global Advisors Inc /adv | 29 783 | 602 | ||||||
| 2025-07-07 | 13F | Enterprise Bank & Trust Co | 55 912 | 0,00 | 1 129 | −0,96 | ||||
| 2025-07-24 | 13F | Capital Advisors, Ltd. LLC | 2 250 | 0,00 | 0 | |||||
| 2025-08-01 | 13F | Y-Intercept (Hong Kong) Ltd | 62 361 | 472,96 | 1 260 | 469,68 | ||||
| 2025-07-08 | 13F | Davis Investment Partners, LLC | 77 104 | −5,57 | 1 570 | 5,73 | ||||
| 2025-07-16 | 13F | Eagle Global Advisors Llc | 22 325 | 56,01 | 451 | 54,64 | ||||
| 2025-05-30 | NP | ERNZ - TrueShares Active Yield ETF | 11 462 | −85,27 | 234 | −85,75 | ||||
| 2025-08-05 | 13F | Palogic Value Management, L.P. | 69 101 | 2,65 | 1 396 | 1,68 | ||||
| 2025-08-13 | 13F | Mackenzie Financial Corp | 0 | −100,00 | 0 | |||||
| 2025-08-11 | 13F | Private Advisor Group, LLC | 14 734 | 29,12 | 298 | 28,02 | ||||
| 2025-08-21 | NP | BIZD - VanEck Vectors BDC Income ETF | 793 209 | 6,18 | 16 023 | 5,19 | ||||
| 2025-09-10 | NP | Putnam ETF Trust - Putnam BDC ETF - | 165 394 | −0,71 | 3 420 | 8,64 | ||||
| 2025-08-01 | 13F | Koss-Olinger Consulting, LLC | 16 153 | 326 | ||||||
| 2025-05-14 | 13F | Credit Agricole S A | 47 649 | 0,00 | 972 | −3,00 | ||||
| 2025-07-16 | 13F | ORG Partners LLC | 1 416 | 0,00 | 29 | −3,45 | ||||
| 2025-08-25 | 13F/A | Promus Capital, LLC | 2 023 | 0,00 | 41 | −2,44 | ||||
| 2025-07-31 | 13F | MQS Management LLC | 36 583 | −20,28 | 739 | −21,07 | ||||
| 2025-07-11 | 13F | Farther Finance Advisors, LLC | 7 346 | −2,92 | 148 | −5,13 | ||||
| 2025-08-12 | 13F | Jpmorgan Chase & Co | 4 398 | −66,67 | 89 | −67,29 | ||||
| 2025-08-08 | 13F | Pnc Financial Services Group, Inc. | 750 | 0,00 | 15 | 0,00 | ||||
| 2025-08-13 | 13F | Natixis | 26 751 | 0,00 | 539 | −1,47 | ||||
| 2025-07-24 | 13F | Blair William & Co/il | 0 | −100,00 | 0 | |||||
| 2025-05-05 | 13F | Transce3nd, LLC | 0 | −100,00 | 0 | |||||
| 2025-07-11 | 13F | Kingstone Capital Partners Texas, LLC | 27 409 759 | 549 | ||||||
| 2025-07-31 | 13F | Oak Harbor Wealth Partners, Llc | 17 981 | 0,00 | 363 | −0,82 | ||||
| 2025-07-25 | 13F | Atria Wealth Solutions, Inc. | 10 089 | 204 | ||||||
| 2025-06-27 | NP | LBO - WHITEWOLF Publicly Listed Private Equity ETF | 676 | 14,19 | 13 | −7,69 | ||||
| 2025-08-12 | 13F | Steward Partners Investment Advisory, Llc | 25 284 | 7,89 | 511 | 6,92 | ||||
| 2025-08-13 | 13F | Quantbot Technologies LP | 9 047 | −7,65 | 183 | −8,54 | ||||
| 2025-08-14 | 13F | Bank Of America Corp /de/ | 17 673 | −2,65 | 357 | −3,78 | ||||
| 2025-07-31 | 13F | Sumitomo Mitsui Trust Holdings, Inc. | 152 463 | 68,49 | 3 080 | 66,88 | ||||
| 2025-08-14 | 13F | Royal Bank Of Canada | 12 088 | 5,72 | 244 | 4,72 | ||||
| 2025-08-07 | 13F | Hennion & Walsh Asset Management, Inc. | 44 016 | 0,05 | 889 | −0,89 | ||||
| 2025-08-12 | 13F | BlackRock, Inc. | 193 153 | 30,75 | 3 902 | 29,52 | ||||
| 2025-08-13 | 13F | Millstone Evans Group, LLC | 3 686 | 0,00 | 74 | −1,33 | ||||
| 2025-08-14 | 13F | Jane Street Group, Llc | 0 | −100,00 | 0 | |||||
| 2025-08-15 | 13F | Morgan Stanley | 267 445 | −12,38 | 5 402 | −13,19 | ||||
| 2025-08-15 | 13F | Great West Life Assurance Co /can/ | 33 094 | 4,65 | 1 | |||||
| 2025-08-18 | 13F | N.E.W. Advisory Services LLC | 62 | 0,00 | 1 | 0,00 | ||||
| 2025-08-14 | 13F | Millennium Management Llc | 0 | −100,00 | 0 | |||||
| 2025-08-06 | 13F | Prospera Financial Services Inc | 20 171 | 0,02 | 407 | −0,97 | ||||
| 2025-08-13 | 13F | Beacon Pointe Advisors, LLC | 22 628 | 457 | ||||||
| 2025-08-18 | 13F | Geneos Wealth Management Inc. | 51 | 0,00 | 1 | 0,00 | ||||
| 2025-08-14 | 13F | Van Eck Associates Corp | 846 994 | 10,94 | 17 | 13,33 | ||||
| 2025-07-14 | 13F | Golden State Equity Partners | 15 740 | 318 | ||||||
| 2025-07-10 | 13F | Wealth Enhancement Advisory Services, Llc | 20 462 | 13,39 | 425 | 15,80 | ||||
| 2025-08-13 | 13F | Baird Financial Group, Inc. | 313 002 | 10,57 | 6 323 | 9,53 | ||||
| 2025-08-08 | 13F | Cetera Investment Advisers | 370 335 | 10,38 | 7 481 | 9,36 | ||||
| 2025-07-14 | 13F | AdvisorNet Financial, Inc | 1 728 | 137,36 | 35 | 142,86 | ||||
| 2025-08-12 | 13F | Virtu Financial LLC | 0 | −100,00 | 0 | |||||
| 2025-08-08 | 13F | Accredited Investors Inc. | 20 000 | 404 | ||||||
| 2025-08-14 | 13F | Wells Fargo & Company/mn | 23 887 | −14,58 | 483 | −15,44 | ||||
| 2025-07-31 | 13F | Optimum Investment Advisors | 20 393 | 9,32 | 412 | 8,16 | ||||
| 2025-07-31 | 13F | Cambridge Investment Research Advisors, Inc. | 26 905 | 10,85 | 1 | |||||
| 2025-08-08 | 13F | Cedar Wealth Management, LLC | 992 | 0,00 | 20 | 0,00 | ||||
| 2025-08-05 | 13F | GPS Wealth Strategies Group, LLC | 2 739 | −36,96 | 55 | −37,50 | ||||
| 2025-06-25 | NP | VPC - Virtus Private Credit Strategy ETF | 38 715 | −12,90 | 732 | −27,19 | ||||
| 2025-05-14 | 13F | Comerica Bank | 0 | −100,00 | 0 | |||||
| 2025-07-31 | 13F | Peterson Wealth Services | 122 | 0,83 | 2 | 0,00 | ||||
| 2025-05-13 | 13F | Neuberger Berman Group LLC | 0 | −100,00 | 0 | |||||
| 2025-07-29 | 13F | Stratos Wealth Partners, LTD. | 26 200 | 61,73 | 529 | 60,30 | ||||
| 2025-08-04 | 13F | Spire Wealth Management | 0 | −100,00 | 0 | |||||
| 2025-08-14 | 13F | Bragg Financial Advisors, Inc | 13 011 | 0,00 | 263 | −1,13 | ||||
| 2025-08-14 | 13F | Aquatic Capital Management LLC | 0 | −100,00 | 0 | |||||
| 2025-08-14 | 13F | Raymond James Financial Inc | 813 702 | −13,26 | 16 437 | −14,07 | ||||
| 2025-07-09 | 13F | Fiduciary Alliance LLC | 13 025 | 0,00 | 263 | −0,75 | ||||
| 2025-07-17 | 13F | GraniteShares Advisors LLC | 132 532 | 6,67 | 2 677 | 5,68 | ||||
| 2025-08-14 | 13F | Citadel Advisors Llc | Call | 24 800 | 10,22 | 501 | 9,17 | |||
| 2025-08-13 | 13F | Northwestern Mutual Wealth Management Co | 150 | 3 | ||||||
| 2025-08-25 | NP | TMVAX - RBC Microcap Value Fund A Shares | 4 400 | 0,00 | 89 | −1,12 | ||||
| 2025-04-21 | 13F | Nelson, Van Denburg & Campbell Wealth Management Group, LLC | 0 | −100,00 | 0 | |||||
| 2025-08-12 | 13F | Advisors Asset Management, Inc. | 154 610 | −27,54 | 3 123 | −28,21 | ||||
| 2025-07-23 | 13F | Columbus Macro, LLC | 322 543 | 12,14 | 6 515 | 11,10 | ||||
| 2025-07-31 | 13F | Oppenheimer & Co Inc | 20 323 | 6,82 | 411 | 5,94 | ||||
| 2025-08-06 | 13F | Ethos Financial Group, LLC | 137 365 | 2,22 | 2 775 | 1,24 | ||||
| 2025-08-12 | 13F | Dynamic Technology Lab Private Ltd | 0 | −100,00 | 0 | |||||
| 2025-08-12 | 13F | MAI Capital Management | 3 132 | 0,00 | 63 | 0,00 | ||||
| 2025-08-15 | 13F | Tower Research Capital LLC (TRC) | 699 | 2 812,50 | 14 | |||||
| 2025-08-12 | 13F | Franklin Resources Inc | 167 016 | −0,42 | 3 374 | −1,35 | ||||
| 2025-07-25 | 13F | Cwm, Llc | 749 | 1 602,27 | 0 | |||||
| 2025-08-14 | 13F | Mariner, LLC | 11 515 | 13,68 | 233 | 12,62 | ||||
| 2025-08-11 | 13F | HighTower Advisors, LLC | 90 865 | 0,22 | 1 835 | −0,70 | ||||
| 2025-08-12 | 13F | Laurel Wealth Advisors LLC | 31 755 | 7 588,86 | 2 | −87,50 | ||||
| 2025-07-17 | 13F | HB Wealth Management, LLC | 13 599 | 0,00 | 275 | −1,08 | ||||
| 2025-08-11 | 13F | Citigroup Inc | 0 | −100,00 | 0 | |||||
| 2025-08-12 | 13F | Trexquant Investment LP | 76 533 | 56,54 | 1 546 | 55,12 | ||||
| 2025-08-13 | 13F | Legacy Capital Wealth Partners, LLC | 66 037 | −2,68 | 1 334 | −3,62 | ||||
| 2025-08-12 | 13F | Global Retirement Partners, LLC | 788 | 16 | ||||||
| 2025-08-14 | 13F | Two Sigma Investments, Lp | 287 879 | −27,85 | 5 815 | −28,52 | ||||
| 2025-07-29 | 13F | Novare Capital Management Llc | 190 275 | 0,60 | 3 844 | −0,34 | ||||
| 2025-08-14 | 13F | Qube Research & Technologies Ltd | 64 929 | 39,81 | 1 312 | 38,58 | ||||
| 2025-09-04 | 13F/A | Advisor Group Holdings, Inc. | 13 092 | 7,56 | 264 | 6,45 | ||||
| 2025-08-29 | NP | GraniteShares ETF Trust - GraniteShares HIPS US High Income ETF | 132 532 | 6,67 | 2 677 | 5,68 | ||||
| 2025-08-06 | 13F | Commonwealth Equity Services, Llc | 35 124 | 20,65 | 1 | |||||
| 2025-07-08 | 13F | Nbc Securities, Inc. | 0 | −100,00 | 0 | |||||
| 2025-08-12 | 13F | LPL Financial LLC | 82 993 | −3,48 | 1 676 | −4,39 | ||||
| 2025-07-22 | 13F | Sage Investment Counsel LLC | 12 070 | 0,00 | 244 | −1,22 | ||||
| 2025-07-15 | 13F | Riverbridge Partners Llc | 38 975 | 3,92 | 787 | 3,01 | ||||
| 2025-08-07 | 13F | PFG Advisors | 188 495 | 3,76 | 3 808 | 2,81 | ||||
| 2025-08-12 | 13F | Proequities, Inc. | Put | 0 | 0 | |||||
| 2025-08-12 | 13F | Proequities, Inc. | Call | 0 | 0 | |||||
| 2025-08-12 | 13F | Proequities, Inc. | 0 | 0 | ||||||
| 2025-08-14 | 13F | Citadel Advisors Llc | Put | 0 | −100,00 | 0 | ||||
| 2025-08-13 | 13F | Russell Investments Group, Ltd. | 72 | 0,00 | 1 | 0,00 | ||||
| 2025-08-14 | 13F | UBS Group AG | 298 390 | 50,83 | 6 027 | 49,44 | ||||
| 2025-08-14 | 13F | Susquehanna International Group, Llp | 0 | −100,00 | 0 | |||||
| 2025-08-14 | 13F | Hrt Financial Lp | 54 066 | 26,75 | 1 | |||||
| 2025-08-14 | 13F | Susquehanna International Group, Llp | Call | 24 000 | 485 | |||||
| 2025-08-14 | 13F | IHT Wealth Management, LLC | 69 581 | 10,12 | 1 406 | 9,08 | ||||
| 2025-08-14 | 13F | Susquehanna International Group, Llp | Put | 12 000 | −7,69 | 242 | −8,68 | |||
| 2025-08-13 | 13F | Invesco Ltd. | 446 703 | 2,20 | 9 023 | 1,26 | ||||
| 2025-09-10 | 13F | WT Wealth Management | 51 855 | −2,85 | 1 047 | −3,77 | ||||
| 2025-05-13 | 13F | EverSource Wealth Advisors, LLC | 0 | −100,00 | 0 | |||||
| 2025-08-14 | 13F | Ameriprise Financial Inc | 92 080 | −13,40 | 1 858 | −13,14 | ||||
| 2025-08-14 | 13F | MGB Wealth Management, LLC | 89 775 | 2,07 | 1 807 | 0,61 | ||||
| 2025-08-11 | 13F | Greenland Capital Management LP | 53 190 | −9,39 | 1 074 | −10,20 | ||||
| 2025-07-17 | 13F | Sound Income Strategies, LLC | 1 898 | −63,27 | 38 | −63,81 | ||||
| 2025-07-30 | 13F | D.a. Davidson & Co. | 115 872 | 159,06 | 2 341 | 156,86 | ||||
| 2025-08-05 | 13F | Simplex Trading, Llc | Put | 200 | 100,00 | 0 | ||||
| 2025-08-05 | 13F | Simplex Trading, Llc | 16 458 | 0 | ||||||
| 2025-08-05 | 13F | Simplex Trading, Llc | Call | 100 | −95,65 | 0 | ||||
| 2025-08-14 | 13F | Two Sigma Advisers, Lp | 380 613 | −8,49 | 7 688 | −9,34 | ||||
| 2025-08-13 | 13F | Northern Trust Corp | 20 202 | 408 | ||||||
| 2025-08-14 | 13F | Citadel Advisors Llc | 0 | −100,00 | 0 |