Grunnleggende statistikk
| Institusjonelle eiere | 159 total, 159 long only, 0 short only, 0 long/short - change of 11,19% MRQ |
| Gjennomsnittlig porteføljeallokering | 0.2111 % - change of −19,41% MRQ |
| Institusjonelle aksjer (Long) | 13 820 699 (ex 13D/G) - change of −2,75MM shares −16,60% MRQ |
| Institusjonell verdi (Long) | $ 810 335 USD ($1000) |
Institusjonelt eierskap og aksjonærer
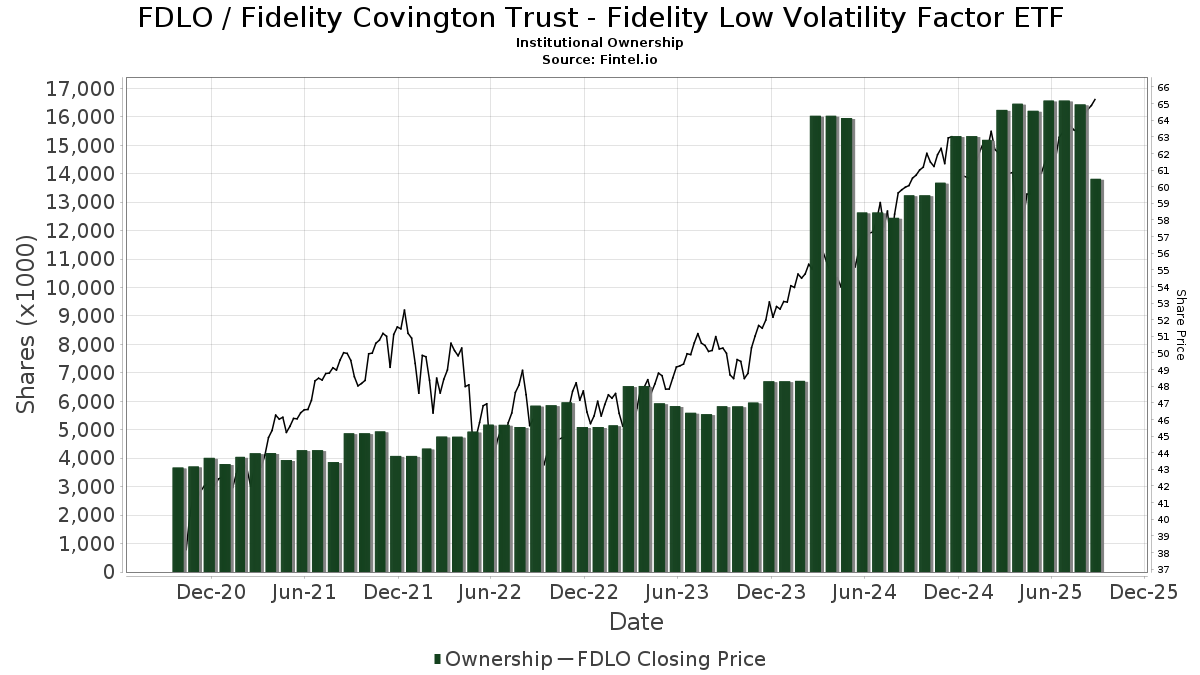
Fidelity Covington Trust - Fidelity Low Volatility Factor ETF (US:FDLO) har 159 institusjonelle eiere og aksjonærer som har sendt inn 13D/G- eller 13F-skjemaer til Securities Exchange Commission (SEC). Disse institusjonene eier til sammen 13,820,699 aksjer. De største aksjonærene inkluderer Fmr Llc, Commonwealth Equity Services, Llc, Envestnet Asset Management Inc, Bank Of America Corp /de/, Kestra Advisory Services, LLC, Campbell Deegan Wealth Management, LLC, CI Private Wealth, LLC, Segall Bryant & Hamill, Llc, LPL Financial LLC, and GWM Advisors LLC .
Fidelity Covington Trust - Fidelity Low Volatility Factor ETF (ARCA:FDLO) institusjonell eierstruktur viser nåværende posisjoner i selskapet fordelt på institusjoner og fond, samt de siste endringene i posisjonsstørrelse. De største aksjonærene kan være individuelle investorer, verdipapirfond, hedgefond eller institusjoner. Schedule 13D indikerer at investoren eier (eller har eid) mer enn 5 % av selskapet og har til hensikt (eller hadde til hensikt) å aktivt forfølge en endring i forretningsstrategien. Schedule 13G indikerer en passiv investering på over 5 %.
The share price as of September 12, 2025 is 65,65 / share. Previously, on September 16, 2024, the share price was 60,93 / share. This represents an increase of 7,75% over that period.
Fondssentiment-score
Fondssentiment Score (også kjent som akkumulering av eierskap poengsum) viser hvilke aksjer som er mest kjøpt av fond. Den er resultatet av en sofistikert, kvantitativ flerfaktormodell som identifiserer selskaper med de høyeste nivåene av institusjonell akkumulering. Beregningsmodellen for poeng bruker en kombinasjon av den totale økningen i antall offentliggjorte eiere, endringer i porteføljeallokeringen til disse eierne og andre beregninger. Tallet går fra 0 til 100, der høyere tall indikerer en høyere grad av akkumulering i forhold til sammenlignbare selskaper, der 50 er gjennomsnittet.
Oppdateringsfrekvens: Daglig
Sjekk ut Ownership Explorer, som inneholder en liste over de høyest rangerte selskapene.
Institusjonell Put/Call-forhold
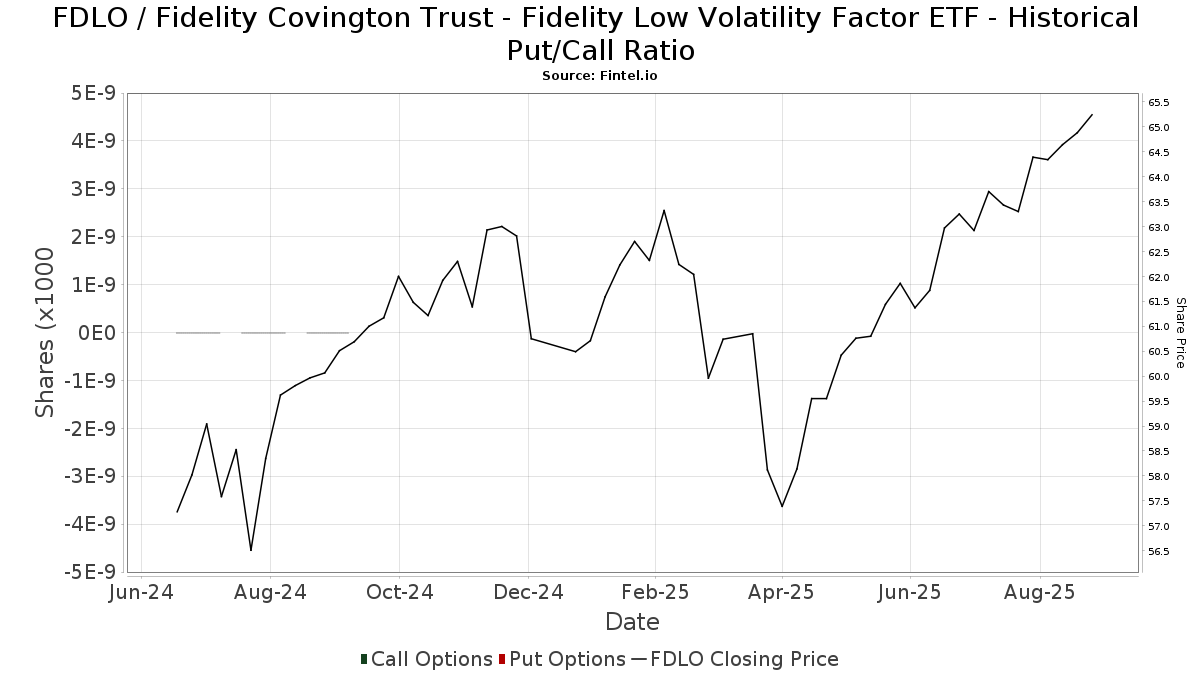
I tillegg til å rapportere standard aksje- og gjeldsemisjoner må institusjoner med mer enn 100 millioner kroner i forvaltningskapital også oppgi beholdningen av put- og callopsjoner. Siden put-opsjoner generelt indikerer et negativt sentiment, og call-opsjoner indikerer et positivt sentiment, kan vi få et inntrykk av det generelle institusjonelle sentimentet ved å plotte forholdet mellom put- og call-opsjoner. Diagrammet til høyre viser det historiske forholdet mellom put- og call-opsjoner for dette instrumentet.
Ved å bruke Put/Call-forholdet som en indikator på investorsentimentet kan man overvinne en av de viktigste svakhetene ved å bruke totalt institusjonelt eierskap, nemlig at en betydelig andel av forvaltningskapitalen investeres passivt for å følge indekser. Passivt forvaltede fond kjøper vanligvis ikke opsjoner, slik at indikatoren for put/call-forhold i større grad gjenspeiler stemningen i aktivt forvaltede fond.
13F- og NPORT-arkiveringer
Detaljer om 13F-arkiveringer er gratis. Detaljer om NP-arkiveringer krever et premium-medlemskap. Grønne rader indikerer nye posisjoner. Røde rader indikerer lukkede posisjoner. Klikk på lenke ikonet for å se hele transaksjonshistorikken.
Oppgrader
for å låse opp premiedata og eksportere til Excel. ![]() .
.
| Fildato | Kilde | Investor | Type | Gjennomsnittlig pris (estimert) |
Aksjer | Δ Aksjer (%) |
Rapportert verdi ($1000) | Verdi (%) | Portallokering (%) | |
|---|---|---|---|---|---|---|---|---|---|---|
| 2025-08-08 | 13F | Glassman Wealth Services | 0 | −100,00 | 0 | |||||
| 2025-08-14 | 13F | Mercer Global Advisors Inc /adv | 7 834 | −13,80 | 492 | −10,73 | ||||
| 2025-08-08 | 13F | Foundations Investment Advisors, LLC | 74 355 | 12,88 | 4 670 | 16,93 | ||||
| 2025-05-13 | 13F | Coston, McIsaac & Partners | 0 | −100,00 | 0 | |||||
| 2025-08-13 | 13F | Colonial Trust Advisors | 9 | 1 | ||||||
| 2025-07-28 | 13F | BRYN MAWR TRUST Co | 360 | 0,00 | 23 | 4,76 | ||||
| 2025-08-07 | 13F | Samalin Investment Counsel, LLC | 5 494 | 0,05 | 345 | 3,92 | ||||
| 2025-07-08 | 13F | RMR Wealth Builders | 3 540 | −6,99 | 222 | −3,48 | ||||
| 2025-09-04 | 13F/A | Advisor Group Holdings, Inc. | 118 808 | −22,53 | 7 466 | −19,73 | ||||
| 2025-07-25 | 13F | Atria Wealth Solutions, Inc. | 8 861 | −8,67 | 556 | −5,44 | ||||
| 2025-08-11 | 13F | Aptus Capital Advisors, LLC | 6 024 | 88,90 | 378 | 95,85 | ||||
| 2025-08-14 | 13F | Mml Investors Services, Llc | 6 641 | −36,69 | 0 | |||||
| 2025-08-11 | 13F | Empowered Funds, LLC | 0 | −100,00 | 0 | |||||
| 2025-07-11 | 13F | Farther Finance Advisors, LLC | 436 | 19,45 | 27 | 22,73 | ||||
| 2025-08-12 | 13F | Integrated Advisors Network LLC | 7 603 | −30,12 | 477 | −27,62 | ||||
| 2025-08-06 | 13F | Hoxton Planning & Management, LLC | 3 561 | 0,00 | 224 | 3,72 | ||||
| 2025-07-28 | 13F | Harbour Investments, Inc. | 96 | −92,10 | 6 | −91,78 | ||||
| 2025-08-01 | 13F | Envestnet Asset Management Inc | 555 092 | −9,25 | 34 860 | −5,98 | ||||
| 2025-08-15 | 13F | Morgan Stanley | 77 179 | −28,32 | 4 847 | −25,75 | ||||
| 2025-08-14 | 13F | Clarity Asset Management, Inc. | 2 228 | 0,36 | 140 | 3,73 | ||||
| 2025-07-18 | 13F | Provident Wealth Management, LLC | 2 886 | 0,00 | 181 | 4,02 | ||||
| 2025-08-07 | 13F | Kestra Private Wealth Services, Llc | 26 095 | 6,30 | 1 639 | 10,08 | ||||
| 2025-08-08 | 13F | Avantax Advisory Services, Inc. | 12 509 | 1,08 | 786 | 4,67 | ||||
| 2025-08-27 | 13F/A | Brinker Capital Investments, LLC | 3 360 | 211 | ||||||
| 2025-07-17 | 13F | Beacon Capital Management, LLC | 70 | 4 | ||||||
| 2025-08-14 | 13F | Qube Research & Technologies Ltd | 0 | −100,00 | 0 | |||||
| 2025-08-12 | 13F | Absolute Capital Management, LLC | 3 473 | −25,52 | 218 | −22,70 | ||||
| 2025-07-21 | 13F | Ameritas Advisory Services, LLC | 130 449 | −48,98 | 8 192 | −47,14 | ||||
| 2025-08-08 | 13F | Advisors Capital Management, LLC | 34 774 | −2,44 | 2 184 | 1,06 | ||||
| 2025-08-14 | 13F | Stifel Financial Corp | 49 645 | 4,39 | 3 118 | 8,15 | ||||
| 2025-07-24 | 13F | Capital Advisors, Ltd. LLC | 10 | 0 | ||||||
| 2025-08-14 | 13F | Fmr Llc | 7 934 912 | −23,10 | 498 312 | −20,33 | ||||
| 2025-07-25 | 13F | Cwm, Llc | 700 | 233,33 | 0 | |||||
| 2025-08-13 | 13F | Cresset Asset Management, LLC | 6 304 | −0,02 | 396 | 3,40 | ||||
| 2025-08-04 | 13F | Savvy Advisors, Inc. | 3 329 | 209 | ||||||
| 2025-07-24 | 13F | Us Bancorp \de\ | 120 | −6,98 | 8 | 0,00 | ||||
| 2025-08-12 | 13F | Running Point Capital Advisors, LLC | 165 902 | 1,36 | 10 419 | 5,00 | ||||
| 2025-07-28 | 13F | Private Wealth Asset Management, LLC | 1 050 | 0,00 | 66 | 3,17 | ||||
| 2025-08-04 | 13F | AMG National Trust Bank | 3 518 | 0,23 | 221 | 3,77 | ||||
| 2025-08-14 | 13F | Bank Of America Corp /de/ | 443 513 | 9,54 | 27 853 | 13,48 | ||||
| 2025-07-31 | 13F | Buckingham Strategic Partners | 10 068 | 0,24 | 632 | 3,95 | ||||
| 2025-08-13 | 13F | Capital Analysts, Inc. | 33 953 | 1,90 | 2 | 0,00 | ||||
| 2025-07-14 | 13F | Mechanics Bank Trust Department | 73 282 | 17,87 | 4 602 | 22,13 | ||||
| 2025-05-16 | 13F | Coppell Advisory Solutions LLC | 0 | −100,00 | 0 | |||||
| 2025-08-07 | 13F | Allworth Financial LP | 74 | −64,08 | 5 | −66,67 | ||||
| 2025-08-12 | 13F | MAI Capital Management | 264 | 42,70 | 17 | 45,45 | ||||
| 2025-08-18 | 13F | Hershey Financial Advisers, LLC | 0 | −100,00 | 0 | |||||
| 2025-08-11 | 13F | Private Advisor Group, LLC | 5 014 | −16,35 | 315 | −13,50 | ||||
| 2025-08-12 | 13F | J.w. Cole Advisors, Inc. | 5 043 | 1,67 | 317 | 5,33 | ||||
| 2025-08-14 | 13F | Betterment LLC | 7 494 | −2,24 | 0 | |||||
| 2025-08-14 | 13F | AllSquare Wealth Management LLC | 9 933 | 0,00 | 624 | 3,49 | ||||
| 2025-08-12 | 13F | SRS Capital Advisors, Inc. | 1 817 | 0,39 | 114 | 4,59 | ||||
| 2025-08-08 | 13F | OmniStar Financial Group, Inc. | 8 493 | 0,41 | 533 | 3,29 | ||||
| 2025-05-15 | 13F | EP Wealth Advisors, Inc. | 0 | −100,00 | 0 | −100,00 | ||||
| 2025-08-06 | 13F | Nvwm, Llc | 19 688 | 5,94 | 1 236 | 9,77 | ||||
| 2025-08-12 | 13F | Global Retirement Partners, LLC | 2 160 | 0,56 | 136 | 3,85 | ||||
| 2025-08-08 | 13F | Pnc Financial Services Group, Inc. | 44 | 76,00 | 3 | 100,00 | ||||
| 2025-05-14 | 13F | Orion Portfolio Solutions, LLC | 4 032 | 0,00 | 244 | 0,00 | ||||
| 2025-08-15 | 13F | Kestra Advisory Services, LLC | 346 284 | 7,32 | 21 747 | 11,18 | ||||
| 2025-08-13 | 13F | Cary Street Partners Financial Llc | 8 955 | −8,91 | 562 | −5,55 | ||||
| 2025-05-16 | 13F/A | Kestra Investment Management, LLC | 0 | −100,00 | 0 | |||||
| 2025-07-30 | 13F | Exencial Wealth Advisors, Llc | 78 286 | −7,41 | 4 916 | −4,08 | ||||
| 2025-08-13 | 13F | Transce3nd, LLC | 133 | 0,00 | 8 | 0,00 | ||||
| 2025-07-30 | 13F | Avidian Wealth Solutions, LLC | 9 666 | −0,30 | 607 | 3,41 | ||||
| 2025-08-12 | 13F | Argent Trust Co | 22 759 | −5,03 | 1 429 | −1,58 | ||||
| 2025-07-31 | 13F | Sequent Asset Management, LLC | 22 710 | 0,00 | 1 426 | 3,63 | ||||
| 2025-08-12 | 13F | Segall Bryant & Hamill, Llc | 227 641 | −2,94 | 14 296 | 0,54 | ||||
| 2025-08-14 | 13F | Valley Financial Group, Inc. | 5 554 | −0,61 | 349 | 2,96 | ||||
| 2025-08-15 | 13F | Semmax Financial Advisors Inc. | 55 | 0,00 | 3 | 0,00 | ||||
| 2025-08-12 | 13F | Steward Partners Investment Advisory, Llc | 4 035 | −5,79 | 253 | −2,32 | ||||
| 2025-08-13 | 13F | Truvestments Capital Llc | 800 | 0,00 | 50 | 4,17 | ||||
| 2025-07-18 | 13F | Dogwood Wealth Management LLC | 6 | 0 | ||||||
| 2025-07-30 | 13F | Rehmann Capital Advisory Group | 20 897 | 0,00 | 1 312 | 3,63 | ||||
| 2025-08-12 | 13F | Jpmorgan Chase & Co | 76 116 | −3,60 | 4 780 | −0,13 | ||||
| 2025-07-17 | 13F | Tempus Wealth Planning, LLC | 27 794 | 0,34 | 1 745 | 3,93 | ||||
| 2025-07-10 | 13F | Wealth Enhancement Advisory Services, Llc | 16 987 | −20,48 | 1 080 | −16,54 | ||||
| 2025-05-09 | 13F | Blair William & Co/il | 0 | −100,00 | 0 | |||||
| 2025-08-14 | 13F | GWM Advisors LLC | 176 211 | 49,47 | 11 066 | 54,86 | ||||
| 2025-08-08 | 13F | Campbell Deegan Wealth Management, LLC | 314 733 | 3,08 | 19 765 | 6,79 | ||||
| 2025-08-04 | 13F | Assetmark, Inc | 143 | 197,92 | 9 | 300,00 | ||||
| 2025-07-30 | 13F | Brookstone Capital Management | 8 581 | 10,51 | 539 | 14,47 | ||||
| 2025-08-15 | 13F | CI Private Wealth, LLC | 236 209 | 0,29 | 14 834 | 3,89 | ||||
| 2025-08-04 | 13F | Spire Wealth Management | 16 | 0,00 | 1 | |||||
| 2025-08-05 | 13F | Westside Investment Management, Inc. | 14 750 | 0,14 | 926 | 3,81 | ||||
| 2025-07-31 | 13F | Carnegie Capital Asset Management, LLC | 3 912 | 0,00 | 246 | 13,95 | ||||
| 2025-08-15 | 13F | Asset Allocation Strategies LLC | 21 830 | −31,72 | 1 371 | −29,31 | ||||
| 2025-07-24 | 13F | Ronald Blue Trust, Inc. | 1 071 | 67 | ||||||
| 2025-07-31 | 13F | Cambridge Investment Research Advisors, Inc. | 41 154 | −3,81 | 3 | 0,00 | ||||
| 2025-08-14 | 13F/A | Rockefeller Capital Management L.P. | 14 634 | −67,79 | 919 | −66,63 | ||||
| 2025-08-14 | 13F | Jane Street Group, Llc | 15 034 | 4,82 | 944 | 8,63 | ||||
| 2025-08-14 | 13F | Integrated Wealth Concepts LLC | 8 153 | 0,97 | 512 | 4,70 | ||||
| 2025-07-31 | 13F | Briaud Financial Planning, Inc | 722 | 0 | ||||||
| 2025-07-21 | 13F | Ascent Group, LLC | 3 674 | −0,43 | 231 | 3,14 | ||||
| 2025-08-14 | 13F | Royal Bank Of Canada | 51 430 | −53,21 | 3 230 | −51,52 | ||||
| 2025-08-01 | 13F | Howard Capital Management Inc. | 80 838 | 91,48 | 5 077 | 98,36 | ||||
| 2025-07-14 | 13F | Abound Wealth Management | 529 | 33 | ||||||
| 2025-08-13 | 13F | Northwestern Mutual Wealth Management Co | 25 113 | −12,44 | 1 577 | −9,26 | ||||
| 2025-08-14 | 13F | Harwood Advisory Group, LLC | 3 069 | −2,39 | 193 | 1,05 | ||||
| 2025-08-14 | 13F | Sunbelt Securities, Inc. | 6 126 | −46,56 | 371 | −46,54 | ||||
| 2025-05-02 | 13F | Transcendent Capital Group LLC | 0 | −100,00 | 0 | |||||
| 2025-05-14 | 13F | Islay Capital Management, Llc | 0 | −100,00 | 0 | |||||
| 2025-07-10 | 13F | ARS Wealth Advisors Group, LLC | 4 727 | 0,36 | 297 | 3,86 | ||||
| 2025-07-15 | 13F | Maseco Llp | 374 | 23 | ||||||
| 2025-08-06 | 13F | Atlantic Union Bankshares Corp | 291 | 18 | ||||||
| 2025-07-25 | 13F | Johnson Investment Counsel Inc | 4 604 | −5,91 | 289 | −2,36 | ||||
| 2025-08-08 | 13F | Cetera Investment Advisers | 172 247 | 2,56 | 10 817 | 6,25 | ||||
| 2025-08-05 | 13F | Bank Of Montreal /can/ | 65 | 0,00 | 4 | 33,33 | ||||
| 2025-07-15 | 13F | Regatta Capital Group, Llc | 7 578 | 476 | ||||||
| 2025-07-21 | 13F | Abundance Wealth Counselors | 79 114 | −5,65 | 5 | 0,00 | ||||
| 2025-08-08 | 13F | Citizens Financial Group Inc/ri | 3 461 | 217 | ||||||
| 2025-08-14 | 13F | Comerica Bank | 394 | 0,00 | 25 | 4,35 | ||||
| 2025-08-12 | 13F | O'shaughnessy Asset Management, Llc | 10 881 | 2 350,68 | 683 | 2 526,92 | ||||
| 2025-05-12 | 13F | Independent Advisor Alliance | 0 | −100,00 | 0 | |||||
| 2025-07-11 | 13F | SILVER OAK SECURITIES, Inc | 6 374 | 0,05 | 400 | 4,44 | ||||
| 2025-07-08 | 13F | Strategic Advocates LLC | 7 779 | 489 | ||||||
| 2025-07-16 | 13F | RWM Asset Management, LLC | 5 169 | 0,00 | 325 | 3,51 | ||||
| 2025-08-14 | 13F | Mariner, LLC | 6 607 | 16,28 | 415 | 20,35 | ||||
| 2025-08-05 | 13F | Aviance Capital Partners, LLC | 3 546 | 0,00 | 223 | 3,74 | ||||
| 2025-05-12 | 13F | Sandy Spring Bank | 291 | 18 | ||||||
| 2025-07-14 | 13F | AdvisorNet Financial, Inc | 106 | 0,00 | 7 | 0,00 | ||||
| 2025-08-26 | 13F/A | Thrivent Financial For Lutherans | 0 | −100,00 | 0 | −100,00 | ||||
| 2025-05-02 | 13F | Capital A Wealth Management, LLC | 14 | 0,00 | 1 | |||||
| 2025-08-06 | 13F | Stonebridge Financial Planning Group, LLC | 5 250 | 0,00 | 330 | 3,46 | ||||
| 2025-08-12 | 13F | Ameritas Investment Partners, Inc. | 994 | 0,30 | 62 | 3,33 | ||||
| 2025-08-13 | 13F | Jones Financial Companies Lllp | 75 | 5 | ||||||
| 2025-07-30 | 13F | Strategic Blueprint, LLC | 14 494 | 910 | ||||||
| 2025-08-05 | 13F | Sigma Planning Corp | 8 279 | 8,52 | 520 | 12,34 | ||||
| 2025-07-24 | 13F | GFG Capital, LLC | 118 446 | −7,39 | 7 438 | −4,05 | ||||
| 2025-08-19 | 13F | Asset Dedication, LLC | 11 | 0,00 | 1 | |||||
| 2025-07-07 | 13F | Roxbury Financial LLC | 2 124 | 494,96 | 133 | 504,55 | ||||
| 2025-08-12 | 13F | Weaver Consulting Group | 43 877 | −0,98 | 2 755 | 2,57 | ||||
| 2025-08-13 | 13F | Lido Advisors, LLC | 115 900 | −7,90 | 7 279 | −4,59 | ||||
| 2025-08-12 | 13F | Proequities, Inc. | 0 | 0 | ||||||
| 2025-08-14 | 13F | Goldman Sachs Group Inc | 73 927 | −0,66 | 4 643 | 2,90 | ||||
| 2025-08-08 | 13F | MTM Investment Management, LLC | 919 | 58 | ||||||
| 2025-08-06 | 13F | AE Wealth Management LLC | 70 575 | −6,50 | 4 432 | −3,13 | ||||
| 2025-08-18 | 13F | Tyler-Stone Wealth Management | 33 877 | −0,83 | 2 127 | 2,75 | ||||
| 2025-08-14 | 13F | Two Sigma Investments, Lp | 0 | −100,00 | 0 | |||||
| 2025-08-14 | 13F | UBS Group AG | 2 636 | −66,30 | 166 | −65,19 | ||||
| 2025-07-14 | 13F | UMA Financial Services, Inc. | 33 | 0,00 | 2 | 0,00 | ||||
| 2025-07-24 | 13F | JB Capital LLC | 3 594 | 2,02 | 226 | 5,63 | ||||
| 2025-07-23 | 13F | Kingswood Wealth Advisors, Llc | 4 928 | −0,36 | 309 | 3,34 | ||||
| 2025-08-01 | 13F | Gwn Securities Inc. | 0 | −100,00 | 0 | |||||
| 2025-08-14 | 13F | Susquehanna International Group, Llp | 21 833 | 1 371 | ||||||
| 2025-07-17 | 13F | Sound Income Strategies, LLC | 14 | −95,85 | 1 | −100,00 | ||||
| 2025-07-30 | 13F | Cullen/frost Bankers, Inc. | 8 249 | 6,66 | 518 | 10,68 | ||||
| 2025-08-15 | 13F | Equitable Holdings, Inc. | 3 587 | 8,04 | 225 | 11,94 | ||||
| 2025-04-21 | 13F | Nelson, Van Denburg & Campbell Wealth Management Group, LLC | 0 | −100,00 | 0 | |||||
| 2025-05-08 | 13F | Eastern Bank | 0 | −100,00 | 0 | |||||
| 2025-07-14 | 13F | GAMMA Investing LLC | 192 | 0,00 | 12 | 9,09 | ||||
| 2025-08-01 | 13F | Logan Capital Management Inc | 3 | 0,00 | 0 | |||||
| 2025-07-14 | 13F | Buttonwood Financial Group, LLC | 9 157 | 2,88 | 579 | 14,00 | ||||
| 2025-08-13 | 13F | Russell Investments Group, Ltd. | 26 | 2 | ||||||
| 2025-07-25 | 13F | Sovereign Financial Group, Inc. | 5 057 | 0,38 | 318 | 3,93 | ||||
| 2025-08-12 | 13F | CIBC Private Wealth Group, LLC | 6 | 0,00 | 0 | |||||
| 2025-08-08 | 13F | Creative Planning | 8 196 | 6,06 | 515 | 9,83 | ||||
| 2025-08-13 | 13F | EverSource Wealth Advisors, LLC | 278 | 0,00 | 17 | 6,25 | ||||
| 2025-08-14 | 13F | Citadel Advisors Llc | 49 455 | 159,61 | 3 106 | 169,06 | ||||
| 2025-08-13 | 13F | Twin Peaks Wealth Advisors, LLC | 387 | 25 | ||||||
| 2025-08-19 | 13F | Advisory Services Network, LLC | 11 103 | −0,23 | 701 | 3,86 | ||||
| 2025-08-14 | 13F | Great Valley Advisor Group, Inc. | 12 986 | −9,06 | 816 | −5,78 | ||||
| 2025-08-11 | 13F | Principal Securities, Inc. | 130 | −37,50 | 8 | −33,33 | ||||
| 2025-08-13 | 13F | Cerity Partners LLC | 3 510 | −15,28 | 220 | −12,35 | ||||
| 2025-05-02 | 13F | Apollon Wealth Management, LLC | 0 | −100,00 | 0 | |||||
| 2025-07-25 | 13F | Envestnet Portfolio Solutions, Inc. | 15 777 | 14,84 | 991 | 18,99 | ||||
| 2025-08-13 | 13F | Luminist Capital LLC | 13 | 0,00 | 1 | |||||
| 2025-08-14 | 13F | Wells Fargo & Company/mn | 2 387 | 109,02 | 150 | 115,94 | ||||
| 2025-08-05 | 13F | Snider Financial Group | 8 542 | −12,46 | 536 | −9,31 | ||||
| 2025-05-08 | 13F | Regions Financial Corp | 0 | −100,00 | 0 | |||||
| 2025-07-25 | 13F | Concord Wealth Partners | 193 | 12 | ||||||
| 2025-08-12 | 13F | LPL Financial LLC | 177 522 | −9,96 | 11 148 | −6,72 | ||||
| 2025-07-09 | 13F | Pallas Capital Advisors LLC | 14 128 | 2,97 | 887 | 6,74 | ||||
| 2025-08-11 | 13F | Citigroup Inc | 772 | 48 | ||||||
| 2025-08-06 | 13F | Commonwealth Equity Services, Llc | 747 249 | −1,12 | 47 | 2,22 | ||||
| 2025-07-24 | 13F | IFP Advisors, Inc | 3 511 | 14,44 | 220 | 18,92 | ||||
| 2025-07-15 | 13F | Unified Investment Management | 6 150 | 0,00 | 386 | 3,76 | ||||
| 2025-08-14 | 13F | Raymond James Financial Inc | 104 585 | 1,84 | 6 568 | 5,49 | ||||
| 2025-08-05 | 13F | Key FInancial Inc | 2 427 | 0,00 | 152 | 3,40 | ||||
| 2025-08-08 | 13F | Security Financial Services, INC. | 11 004 | 691 |