Grunnleggende statistikk
| Institusjonelle eiere | 181 total, 181 long only, 0 short only, 0 long/short - change of 7,10% MRQ |
| Gjennomsnittlig porteføljeallokering | 0.2026 % - change of −11,53% MRQ |
| Institusjonelle aksjer (Long) | 16 008 501 (ex 13D/G) - change of 0,71MM shares 4,66% MRQ |
| Institusjonell verdi (Long) | $ 841 720 USD ($1000) |
Institusjonelt eierskap og aksjonærer
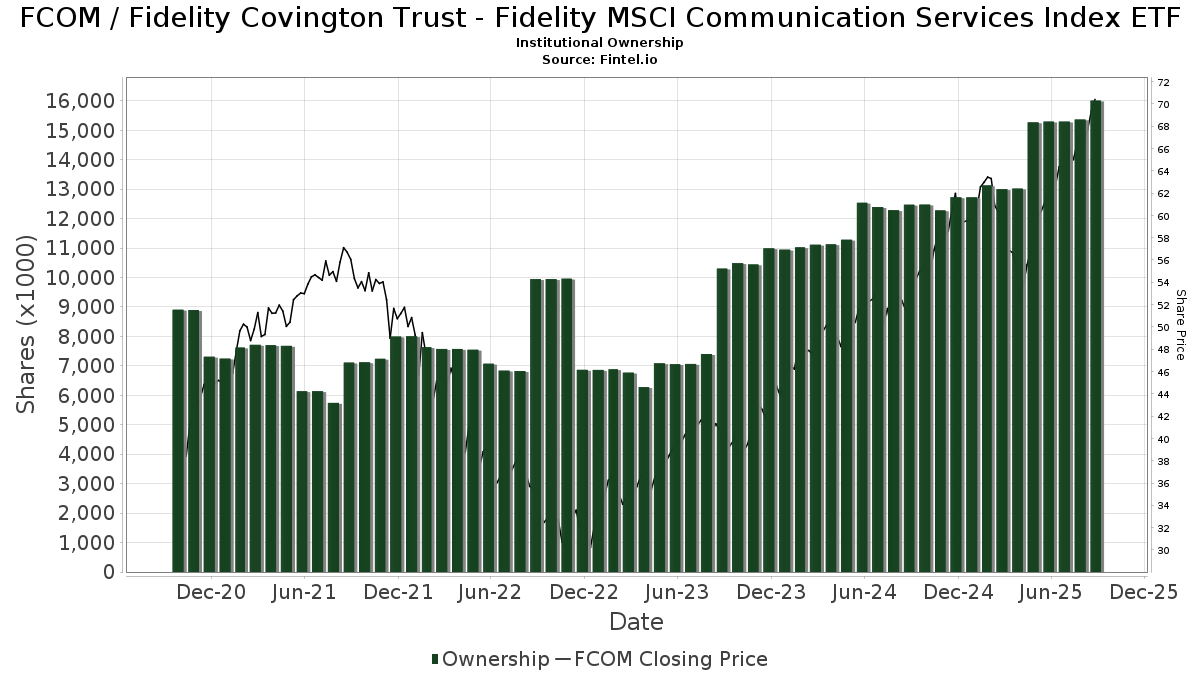
Fidelity Covington Trust - Fidelity MSCI Communication Services Index ETF (US:FCOM) har 181 institusjonelle eiere og aksjonærer som har sendt inn 13D/G- eller 13F-skjemaer til Securities Exchange Commission (SEC). Disse institusjonene eier til sammen 16,008,501 aksjer. De største aksjonærene inkluderer Charles Schwab Investment Management Inc, Harel Insurance Investments & Financial Services Ltd., Lido Advisors, LLC, Northwestern Mutual Wealth Management Co, Agf Management Ltd, Morgan Stanley, Vicus Capital, Wells Fargo & Company/mn, Commonwealth Equity Services, Llc, and LPL Financial LLC .
Fidelity Covington Trust - Fidelity MSCI Communication Services Index ETF (ARCA:FCOM) institusjonell eierstruktur viser nåværende posisjoner i selskapet fordelt på institusjoner og fond, samt de siste endringene i posisjonsstørrelse. De største aksjonærene kan være individuelle investorer, verdipapirfond, hedgefond eller institusjoner. Schedule 13D indikerer at investoren eier (eller har eid) mer enn 5 % av selskapet og har til hensikt (eller hadde til hensikt) å aktivt forfølge en endring i forretningsstrategien. Schedule 13G indikerer en passiv investering på over 5 %.
The share price as of September 10, 2025 is 70,39 / share. Previously, on September 11, 2024, the share price was 51,21 / share. This represents an increase of 37,45% over that period.
Fondssentiment-score
Fondssentiment Score (også kjent som akkumulering av eierskap poengsum) viser hvilke aksjer som er mest kjøpt av fond. Den er resultatet av en sofistikert, kvantitativ flerfaktormodell som identifiserer selskaper med de høyeste nivåene av institusjonell akkumulering. Beregningsmodellen for poeng bruker en kombinasjon av den totale økningen i antall offentliggjorte eiere, endringer i porteføljeallokeringen til disse eierne og andre beregninger. Tallet går fra 0 til 100, der høyere tall indikerer en høyere grad av akkumulering i forhold til sammenlignbare selskaper, der 50 er gjennomsnittet.
Oppdateringsfrekvens: Daglig
Sjekk ut Ownership Explorer, som inneholder en liste over de høyest rangerte selskapene.
Institusjonell Put/Call-forhold
I tillegg til å rapportere standard aksje- og gjeldsemisjoner må institusjoner med mer enn 100 millioner kroner i forvaltningskapital også oppgi beholdningen av put- og callopsjoner. Siden put-opsjoner generelt indikerer et negativt sentiment, og call-opsjoner indikerer et positivt sentiment, kan vi få et inntrykk av det generelle institusjonelle sentimentet ved å plotte forholdet mellom put- og call-opsjoner. Diagrammet til høyre viser det historiske forholdet mellom put- og call-opsjoner for dette instrumentet.
Ved å bruke Put/Call-forholdet som en indikator på investorsentimentet kan man overvinne en av de viktigste svakhetene ved å bruke totalt institusjonelt eierskap, nemlig at en betydelig andel av forvaltningskapitalen investeres passivt for å følge indekser. Passivt forvaltede fond kjøper vanligvis ikke opsjoner, slik at indikatoren for put/call-forhold i større grad gjenspeiler stemningen i aktivt forvaltede fond.
13F- og NPORT-arkiveringer
Detaljer om 13F-arkiveringer er gratis. Detaljer om NP-arkiveringer krever et premium-medlemskap. Grønne rader indikerer nye posisjoner. Røde rader indikerer lukkede posisjoner. Klikk på lenke ikonet for å se hele transaksjonshistorikken.
Oppgrader
for å låse opp premiedata og eksportere til Excel. ![]() .
.
| Fildato | Kilde | Investor | Type | Gjennomsnittlig pris (estimert) |
Aksjer | Δ Aksjer (%) |
Rapportert verdi ($1000) | Verdi (%) | Portallokering (%) | |
|---|---|---|---|---|---|---|---|---|---|---|
| 2025-05-12 | 13F | Founders Financial Securities Llc | 0 | −100,00 | 0 | |||||
| 2025-04-29 | 13F | Element Wealth, LLC | 0 | −100,00 | 0 | |||||
| 2025-05-15 | 13F | Minot DeBlois Advisors LLC | 0 | −100,00 | 0 | |||||
| 2025-08-14 | 13F | Full Sail Capital, LLC | 234 794 | −2,38 | 15 217 | 12,45 | ||||
| 2025-08-14 | 13F | GWM Advisors LLC | 9 204 | −1,60 | 597 | 13,31 | ||||
| 2025-07-17 | 13F | Janney Montgomery Scott LLC | 67 249 | 15,96 | 4 | 33,33 | ||||
| 2025-08-04 | 13F | Creative Financial Designs Inc /adv | 1 223 | 0,00 | 79 | 16,18 | ||||
| 2025-08-08 | 13F | Capital Investment Advisory Services, LLC | 74 | 0,00 | 5 | 0,00 | ||||
| 2025-07-21 | 13F | Ameritas Advisory Services, LLC | 68 | 4 | ||||||
| 2025-08-12 | 13F | Coldstream Capital Management Inc | 0 | −100,00 | 0 | |||||
| 2025-08-12 | 13F | Integrated Advisors Network LLC | 7 230 | −38,14 | 469 | −28,77 | ||||
| 2025-08-14 | 13F | Fmr Llc | 26 237 | 21,59 | 1 700 | 40,03 | ||||
| 2025-08-01 | 13F | Envestnet Asset Management Inc | 47 388 | −56,78 | 3 071 | −50,21 | ||||
| 2025-08-07 | 13F | Kestra Private Wealth Services, Llc | 32 244 | 2,19 | 2 090 | 17,69 | ||||
| 2025-08-14 | 13F | Snowden Capital Advisors LLC | 24 646 | −7,55 | 1 597 | 6,54 | ||||
| 2025-08-12 | 13F | Charles Schwab Investment Management Inc | 4 421 397 | −1,07 | 286 551 | 13,97 | ||||
| 2025-08-12 | 13F | Howe & Rusling Inc | 363 | 24 | ||||||
| 2025-08-14 | 13F | Quantinno Capital Management LP | 4 783 | 25,87 | 310 | 45,07 | ||||
| 2025-07-02 | 13F | Crumly & Associates Inc. | 123 933 | 11,17 | 8 032 | 28,08 | ||||
| 2025-08-14 | 13F | Stifel Financial Corp | 146 682 | −5,37 | 9 507 | 9,01 | ||||
| 2025-07-30 | 13F | Retirement Planning Group | 0 | −100,00 | 0 | |||||
| 2025-07-14 | 13F | AdvisorNet Financial, Inc | 679 | 0,30 | 44 | 13,16 | ||||
| 2025-04-30 | 13F | Personal Cfo Solutions, Llc | 0 | −100,00 | 0 | −100,00 | ||||
| 2025-07-17 | 13F | Wolff Wiese Magana Llc | 69 | 0,00 | 4 | 33,33 | ||||
| 2025-08-01 | 13F | Ashton Thomas Private Wealth, LLC | 9 650 | 0,35 | 625 | 15,74 | ||||
| 2025-08-07 | 13F | Allworth Financial LP | 486 | −38,87 | 31 | −27,91 | ||||
| 2025-07-14 | 13F | Mechanics Bank Trust Department | 23 816 | −3,05 | 1 544 | 11,65 | ||||
| 2025-07-16 | 13F | Fischer Financial Services, Inc. | 106 462 | 0,17 | 6 878 | 15,04 | ||||
| 2025-04-23 | 13F | Oppenheimer & Co Inc | 0 | −100,00 | 0 | −100,00 | ||||
| 2025-08-14 | 13F | Sunbelt Securities, Inc. | 2 356 | −0,13 | 138 | 4,55 | ||||
| 2025-07-16 | 13F | Brown, Lisle/cummings, Inc. | 43 | 0,00 | 3 | 0,00 | ||||
| 2025-07-23 | 13F | Pillar Financial Advisors, LLC | 97 | 0,00 | 6 | 20,00 | ||||
| 2025-09-04 | 13F/A | Advisor Group Holdings, Inc. | 72 479 | −23,28 | 4 709 | −11,55 | ||||
| 2025-08-06 | 13F | Soltis Investment Advisors LLC | 11 538 | −0,62 | 748 | 14,40 | ||||
| 2025-05-15 | 13F/A | Orion Portfolio Solutions, LLC | 46 461 | 0,14 | 2 614 | −4,04 | ||||
| 2025-08-12 | 13F | Jpmorgan Chase & Co | 20 710 | 155,90 | 1 342 | 194,95 | ||||
| 2025-08-15 | 13F | Kestra Advisory Services, LLC | 164 073 | 8,88 | 10 634 | 25,42 | ||||
| 2025-08-08 | 13F | Pnc Financial Services Group, Inc. | 128 | 8 | ||||||
| 2025-08-12 | 13F | Steward Partners Investment Advisory, Llc | 48 305 | 150 853,12 | 3 131 | 312 900,00 | ||||
| 2025-07-16 | 13F | Southern Capital Advisors, Llc | 77 730 | −0,22 | 5 038 | 14,95 | ||||
| 2025-04-25 | 13F | Colonial River Wealth Management, LLC | 0 | −100,00 | 0 | |||||
| 2025-07-22 | 13F | Yoder Wealth Management, Inc. | 76 265 | 5,20 | 4 943 | 21,19 | ||||
| 2025-05-14 | 13F | BOK Financial Private Wealth, Inc. | 0 | −100,00 | 0 | |||||
| 2025-07-31 | 13F | Cambridge Investment Research Advisors, Inc. | 90 418 | 35,70 | 6 | 66,67 | ||||
| 2025-07-29 | 13F | Stratos Wealth Partners, LTD. | 4 710 | −19,31 | 305 | −7,01 | ||||
| 2025-05-15 | 13F | Hrt Financial Lp | 0 | −100,00 | 0 | |||||
| 2025-07-31 | 13F | Moment Partners, LLC | 3 228 | −12,92 | 209 | 0,48 | ||||
| 2025-08-13 | 13F | KDK Private Wealth Management, LLC | 20 669 | −2,11 | 1 339 | 12,90 | ||||
| 2025-07-24 | 13F | Live Oak Investment Partners | 15 964 | 10,53 | 1 035 | 27,34 | ||||
| 2025-04-25 | 13F | Red Tortoise LLC | 0 | −100,00 | 0 | |||||
| 2025-07-30 | 13F | Gables Capital Management Inc. | 662 | 0,00 | 43 | 13,51 | ||||
| 2025-05-09 | 13F | CoreCap Advisors, LLC | 0 | −100,00 | 0 | |||||
| 2025-04-23 | 13F | Gimbal Financial | 0 | −100,00 | 0 | −100,00 | ||||
| 2025-08-06 | 13F | Agf Management Ltd | 632 275 | 10,62 | 40 978 | 27,43 | ||||
| 2025-07-16 | 13F | Signature Resources Capital Management, LLC | 624 | 40 | ||||||
| 2025-08-08 | 13F | Cetera Investment Advisers | 17 034 | −19,04 | 1 104 | −6,76 | ||||
| 2025-07-18 | 13F | Bartlett & Co. Wealth Management Llc | 39 | 0,00 | 3 | 0,00 | ||||
| 2025-04-29 | 13F | Lee Danner & Bass Inc | 0 | −100,00 | 0 | −100,00 | ||||
| 2025-07-16 | 13F | Badgley Phelps Wealth Managers, LLC | 5 316 | 0,00 | 345 | 15,05 | ||||
| 2025-08-12 | 13F | O'shaughnessy Asset Management, Llc | 3 339 | −7,38 | 216 | 6,93 | ||||
| 2025-07-31 | 13F | Moser Wealth Advisors, LLC | 171 | 11 | ||||||
| 2025-08-08 | 13F | Meridian Wealth Management, LLC | 12 599 | 1,03 | 817 | 16,41 | ||||
| 2025-08-05 | 13F | Beckerman Institutional, LLC | 22 107 | −4,92 | 1 | 0,00 | ||||
| 2025-08-14 | 13F | Jane Street Group, Llc | 0 | −100,00 | 0 | |||||
| 2025-08-12 | 13F | Leigh Baldwin & Co., Llc | 4 181 | 0,05 | 271 | 14,89 | ||||
| 2025-07-16 | 13F | RWM Asset Management, LLC | 194 911 | 4,60 | 12 632 | 20,50 | ||||
| 2025-07-17 | 13F | Independence Bank of Kentucky | 70 | −56,25 | 5 | −55,56 | ||||
| 2025-08-05 | 13F | Sigma Planning Corp | 15 010 | −21,79 | 973 | −9,92 | ||||
| 2025-08-13 | 13F | Jones Financial Companies Lllp | 13 903 | 1,99 | 896 | 17,43 | ||||
| 2025-08-15 | 13F | Tower Research Capital LLC (TRC) | 4 721 | 306 | ||||||
| 2025-08-12 | 13F | Proequities, Inc. | 0 | 0 | ||||||
| 2025-07-25 | 13F | Apollon Wealth Management, LLC | 7 774 | −4,12 | 504 | 10,31 | ||||
| 2025-08-08 | 13F | Crossmark Global Holdings, Inc. | 15 283 | 0,00 | 990 | 15,25 | ||||
| 2025-08-14 | 13F | UBS Group AG | 74 709 | 3,55 | 4 842 | 19,27 | ||||
| 2025-08-14 | 13F | Susquehanna International Group, Llp | 39 443 | 275,11 | 2 556 | 332,49 | ||||
| 2025-08-05 | 13F | Harel Insurance Investments & Financial Services Ltd. | 2 484 280 | 22,67 | 161 | 42,48 | ||||
| 2025-05-09 | 13F | Pathway Financial Advisers, LLC | 0 | −100,00 | 0 | |||||
| 2025-07-16 | 13F/A | CX Institutional | 19 815 | 12,19 | 1 | |||||
| 2025-08-04 | 13F | Creekmur Asset Management LLC | 1 | 0,00 | 0 | |||||
| 2025-08-06 | 13F | Golden State Wealth Management, LLC | 12 | 1 | ||||||
| 2025-04-23 | 13F | Mascagni Wealth Management, Inc. | 0 | −100,00 | 0 | −100,00 | ||||
| 2025-08-12 | 13F | AlphaCore Capital LLC | 162 | 10 | ||||||
| 2025-08-12 | 13F | SRS Capital Advisors, Inc. | 428 | 28 | ||||||
| 2025-07-30 | 13F | Pacific Sun Financial Corp | 19 406 | 2,09 | 1 258 | 17,59 | ||||
| 2025-08-05 | 13F | Dunhill Financial, LLC | 109 | 0,00 | 7 | 16,67 | ||||
| 2025-07-23 | 13F | Elm3 Financial Group, LLC | 7 263 | 471 | ||||||
| 2025-08-12 | 13F | CIBC Private Wealth Group, LLC | 64 | 0,00 | 4 | 33,33 | ||||
| 2025-07-10 | 13F | Charter Oak Capital Management, LLC | 6 265 | −20,08 | 406 | −7,94 | ||||
| 2025-08-13 | 13F | Quadrature Capital Ltd | 0 | −100,00 | 0 | |||||
| 2025-08-08 | 13F | Financial Gravity Companies, Inc. | 151 | 10 | ||||||
| 2025-07-24 | 13F | IFP Advisors, Inc | 699 | 0,00 | 45 | 15,38 | ||||
| 2025-08-19 | 13F | Advisory Services Network, LLC | 11 340 | −82,98 | 752 | −79,96 | ||||
| 2025-08-14 | 13F | Wells Fargo & Company/mn | 269 359 | −5,18 | 17 457 | 9,23 | ||||
| 2025-08-11 | 13F | Capital Square, LLC | 3 365 | −23,07 | 215 | −12,60 | ||||
| 2025-08-12 | 13F | Guerra Advisors Inc | 129 640 | −25,59 | 8 402 | −14,29 | ||||
| 2025-08-14 | 13F | Raymond James Financial Inc | 49 361 | 0,57 | 3 199 | 15,86 | ||||
| 2025-04-23 | 13F | Aspetuck Financial Management LLC | 0 | −100,00 | 0 | −100,00 | ||||
| 2025-08-14 | 13F | Citadel Advisors Llc | 0 | −100,00 | 0 | |||||
| 2025-05-09 | 13F | Legacy Capital Group California, Inc. | 0 | −100,00 | 0 | |||||
| 2025-08-14 | 13F | Kovitz Investment Group Partners, LLC | 65 963 | 44,84 | 4 275 | 66,86 | ||||
| 2025-08-05 | 13F | Lifeworks Advisors, LLC | 31 567 | 0,34 | 2 046 | 15,60 | ||||
| 2025-08-14 | 13F | Federation des caisses Desjardins du Quebec | 922 | 60 | ||||||
| 2025-07-28 | 13F | Rosenberg Matthew Hamilton | 3 110 | 0,00 | 202 | 15,52 | ||||
| 2025-07-29 | 13F | Private Trust Co Na | 24 | 26,32 | 2 | 0,00 | ||||
| 2025-08-13 | 13F | Marshall Wace, Llp | 3 218 | −86,08 | 209 | −84,00 | ||||
| 2025-08-14 | 13F | Boston Private Wealth Llc | 3 342 | 217 | ||||||
| 2025-07-22 | 13F | Grimes & Company, Inc. | 21 192 | 1 373 | ||||||
| 2025-07-18 | 13F | Trust Co Of Vermont | 0 | −100,00 | 0 | |||||
| 2025-07-14 | 13F | GAMMA Investing LLC | 132 | 0,00 | 9 | 14,29 | ||||
| 2025-07-25 | 13F | Atria Wealth Solutions, Inc. | 17 298 | −41,29 | 1 121 | −32,41 | ||||
| 2025-08-26 | 13F/A | Thrivent Financial For Lutherans | 38 103 | 2 | ||||||
| 2025-07-24 | 13F | Court Place Advisors, LLC | 16 805 | 1,22 | 1 089 | 16,60 | ||||
| 2025-05-01 | 13F | Q3 Asset Management | 0 | −100,00 | 0 | |||||
| 2025-08-12 | 13F | Global Retirement Partners, LLC | 187 | −44,01 | 12 | −36,84 | ||||
| 2025-07-17 | 13F | Fifth Third Securities, Inc. | 16 816 | 0,17 | 1 090 | 15,36 | ||||
| 2025-08-06 | 13F | New Millennium Group LLC | 727 | 38,21 | 47 | 62,07 | ||||
| 2025-07-24 | 13F | Blair William & Co/il | 557 | 24,33 | 36 | 44,00 | ||||
| 2025-08-11 | 13F | Aptus Capital Advisors, LLC | 604 | 0,17 | 39 | 18,18 | ||||
| 2025-08-14 | 13F | Mml Investors Services, Llc | 13 592 | 15,31 | 1 | |||||
| 2025-07-09 | 13F | Bank of New Hampshire | 204 | 0,00 | 13 | 18,18 | ||||
| 2025-07-11 | 13F | Farther Finance Advisors, LLC | 1 186 | 0,25 | 77 | 15,15 | ||||
| 2025-08-27 | 13F/A | Brinker Capital Investments, LLC | 30 448 | −34,47 | 1 973 | −24,49 | ||||
| 2025-08-08 | 13F | Avantax Advisory Services, Inc. | 4 902 | −15,10 | 318 | −2,16 | ||||
| 2025-08-13 | 13F | Hsbc Holdings Plc | 4 392 | −58,97 | 285 | −52,82 | ||||
| 2025-04-09 | 13F | HBW Advisory Services LLC | 0 | −100,00 | 0 | −100,00 | ||||
| 2025-04-23 | 13F | PMV Capital Advisers, LLC | 0 | −100,00 | 0 | |||||
| 2025-07-28 | 13F | Harbour Investments, Inc. | 1 595 | 14,42 | 103 | 32,05 | ||||
| 2025-07-31 | 13F | Sage Mountain Advisors LLC | 1 243 | 0,00 | 81 | 15,94 | ||||
| 2025-08-08 | 13F | Hartland & Co., LLC | 375 | 24 | ||||||
| 2025-08-15 | 13F | Morgan Stanley | 428 311 | 5,45 | 27 759 | 21,48 | ||||
| 2025-05-13 | 13F | Heck Capital Advisors, LLC | 0 | −100,00 | 0 | −100,00 | ||||
| 2025-07-22 | 13F | PUREfi Wealth, LLC | 4 233 | 0,00 | 274 | 15,13 | ||||
| 2025-05-13 | 13F | Adviser Investments LLC | 0 | −100,00 | 0 | |||||
| 2025-08-06 | 13F | AE Wealth Management LLC | 119 757 | 7,28 | 7 761 | 23,58 | ||||
| 2025-08-05 | 13F | EPG Wealth Management LLC | 19 458 | −13,78 | 1 261 | −0,63 | ||||
| 2025-04-10 | 13F | Secure Asset Management, LLC | 0 | −100,00 | 0 | |||||
| 2025-05-14 | 13F | Truvestments Capital Llc | 0 | −100,00 | 0 | |||||
| 2025-08-11 | 13F | HighTower Advisors, LLC | 184 383 | 0,93 | 11 950 | 16,26 | ||||
| 2025-08-11 | 13F | Private Advisor Group, LLC | 4 163 | 0,31 | 270 | 15,45 | ||||
| 2025-07-15 | 13F | Lynch & Associates/in | 25 292 | 3,74 | 1 639 | 19,55 | ||||
| 2025-08-12 | 13F | J.w. Cole Advisors, Inc. | 3 642 | 1,53 | 236 | 17,41 | ||||
| 2025-07-22 | 13F | Merit Financial Group, LLC | 17 524 | −30,58 | 1 136 | −20,07 | ||||
| 2025-07-24 | 13F | Williams & Novak, LLC | 4 573 | −3,48 | 296 | 10,45 | ||||
| 2025-08-14 | 13F | IHT Wealth Management, LLC | 4 807 | 312 | ||||||
| 2025-08-14 | 13F | Bank Of America Corp /de/ | 70 285 | 7,73 | 4 555 | 24,11 | ||||
| 2025-05-12 | 13F | Independent Advisor Alliance | 0 | −100,00 | 0 | |||||
| 2025-08-06 | 13F | Decker Retirement Planning Inc. | 573 | 0,00 | 37 | 15,63 | ||||
| 2025-08-08 | 13F | Independence Financial Advisors, LLC | 146 441 | −8,33 | 9 491 | 5,60 | ||||
| 2025-07-25 | 13F | Cwm, Llc | 200 | 100,00 | 0 | |||||
| 2025-08-12 | 13F | Franklin Resources Inc | 0 | −100,00 | 0 | |||||
| 2025-08-08 | 13F | Creative Planning | 10 702 | 43,79 | 694 | 65,79 | ||||
| 2025-08-04 | 13F | Integrity Alliance, Llc. | 0 | −100,00 | 0 | |||||
| 2025-05-21 | 13F/A | Geneos Wealth Management Inc. | 46 | 3 | ||||||
| 2025-07-16 | 13F | Legend Financial Advisors, Inc. | 283 | 18 | ||||||
| 2025-05-15 | 13F | Prospera Financial Services Inc | 0 | −100,00 | 0 | |||||
| 2025-08-04 | 13F | Arkadios Wealth Advisors | 23 978 | 1,48 | 1 554 | 16,85 | ||||
| 2025-07-28 | 13F | Kiker Wealth Management, LLC | 0 | −100,00 | 0 | |||||
| 2025-07-24 | 13F | Us Bancorp \de\ | 36 | −77,78 | 2 | −77,78 | ||||
| 2025-07-10 | 13F | Wealth Enhancement Advisory Services, Llc | 9 310 | −1,89 | 603 | 13,13 | ||||
| 2025-08-15 | 13F | CI Private Wealth, LLC | 3 113 | 202 | ||||||
| 2025-08-04 | 13F | Assetmark, Inc | 228 | 15 | ||||||
| 2025-08-13 | 13F | Colonial Trust Co / SC | 691 | −24,89 | 45 | −13,73 | ||||
| 2025-08-14 | 13F | Main Street Financial Solutions, LLC | 14 256 | −4,35 | 924 | 10,14 | ||||
| 2025-08-11 | 13F | Brown Brothers Harriman & Co | 8 361 | 243,93 | 542 | 297,79 | ||||
| 2025-07-08 | 13F | Atlas Brown,Inc. | 10 356 | −1,12 | 671 | 13,92 | ||||
| 2025-07-16 | 13F | American National Bank | 12 878 | −1,69 | 835 | 13,16 | ||||
| 2025-08-06 | 13F | Atlantic Union Bankshares Corp | 400 | 26 | ||||||
| 2025-08-13 | 13F | Northwestern Mutual Wealth Management Co | 1 382 346 | 9,42 | 89 590 | 26,05 | ||||
| 2025-08-14 | 13F | Mariner, LLC | 10 338 | 15,61 | 670 | 33,20 | ||||
| 2025-04-24 | 13F | HighMark Wealth Management LLC | 0 | −100,00 | 0 | |||||
| 2025-08-04 | 13F | Savvy Advisors, Inc. | 4 788 | −1,05 | 310 | 13,97 | ||||
| 2025-08-11 | 13F | Anfield Capital Management, LLC | 163 | 185,96 | 11 | 233,33 | ||||
| 2025-08-14 | 13F | Comerica Bank | 2 817 | 0,11 | 183 | 15,19 | ||||
| 2025-05-01 | 13F | Fulcrum Equity Management | 0 | −100,00 | 0 | |||||
| 2025-07-28 | 13F | Copia Wealth Management | 125 | 0,00 | 8 | 14,29 | ||||
| 2025-08-14 | 13F | Royal Bank Of Canada | 11 009 | 0,20 | 714 | 15,53 | ||||
| 2025-05-12 | 13F | Sandy Spring Bank | 400 | 0,00 | 23 | −4,35 | ||||
| 2025-08-12 | 13F | Pathstone Holdings, LLC | 4 491 | 15,54 | 291 | 33,49 | ||||
| 2025-08-06 | 13F | Kcm Investment Advisors Llc | 7 302 | 0,00 | 473 | 15,37 | ||||
| 2025-07-18 | 13F | Vicus Capital | 289 689 | 4,39 | 18 775 | 20,25 | ||||
| 2025-08-06 | 13F | Stonebridge Financial Planning Group, LLC | 16 225 | 3,85 | 1 052 | 19,70 | ||||
| 2025-08-07 | 13F | Birchcreek Wealth Management, LLC | 19 342 | 12,11 | 1 254 | 29,18 | ||||
| 2025-08-13 | 13F | Lido Advisors, LLC | 1 867 729 | 4,49 | 121 048 | 20,37 | ||||
| 2025-05-08 | 13F | Plante Moran Financial Advisors, LLC | 0 | −100,00 | 0 | −100,00 | ||||
| 2025-08-19 | 13F | Asset Dedication, LLC | 334 | 22 | ||||||
| 2025-05-15 | 13F | Mercer Global Advisors Inc /adv | 0 | −100,00 | 0 | |||||
| 2025-08-14 | 13F | Vista Investment Management | 18 037 | 0,51 | 1 169 | 15,76 | ||||
| 2025-08-14 | 13F | Two Sigma Investments, Lp | 43 000 | 2 787 | ||||||
| 2025-08-06 | 13F | Mcrae Capital Management Inc | 3 116 | 202 | ||||||
| 2025-08-14 | 13F | Qube Research & Technologies Ltd | 4 920 | 1 423,22 | 319 | 1 666,67 | ||||
| 2025-08-04 | 13F | Prairie Wealth Advisors, Inc. | 4 166 | 1,21 | 270 | 16,45 | ||||
| 2025-08-12 | 13F | Atlas Capital Advisors Llc | 48 474 | −26,72 | 3 142 | −15,59 | ||||
| 2025-08-15 | 13F | Chapman Financial Group, Llc | 49 | 3 | ||||||
| 2025-07-28 | 13F | Acorn Financial Advisory Services Inc /adv | 5 977 | 31,91 | 387 | 52,36 | ||||
| 2025-07-21 | 13F | Exchange Capital Management, Inc. | 30 879 | −6,30 | 2 001 | 7,99 | ||||
| 2025-07-14 | 13F | Park Avenue Securities Llc | 3 098 | 0 | ||||||
| 2025-07-15 | 13F | Elevated Capital Advisors, LLC | 5 919 | 0,00 | 333 | 0,00 | ||||
| 2025-07-23 | 13F | Kingswood Wealth Advisors, Llc | 8 510 | 5,49 | 552 | 21,63 | ||||
| 2025-08-06 | 13F | Valued Wealth Advisors LLC | 178 | 0,00 | 12 | 10,00 | ||||
| 2025-07-14 | 13F | UMA Financial Services, Inc. | 166 | 0,00 | 11 | 11,11 | ||||
| 2025-07-17 | 13F | Sound Income Strategies, LLC | 546 | 0,00 | 35 | 16,67 | ||||
| 2025-08-12 | 13F | Trexquant Investment LP | 4 845 | 11,56 | 314 | 28,69 | ||||
| 2025-05-14 | 13F | River Wealth Advisors LLC | 0 | −100,00 | 0 | |||||
| 2025-08-13 | 13F | Congress Wealth Management LLC / DE / | 43 008 | 24,61 | 2 787 | 43,59 | ||||
| 2025-07-17 | 13F | Smith, Salley & Associates | 58 636 | 0,18 | 3 800 | 15,43 | ||||
| 2025-05-01 | 13F | High Note Wealth, LLC | 0 | −100,00 | 0 | |||||
| 2025-08-15 | 13F | Equitable Holdings, Inc. | 6 889 | −0,13 | 446 | 14,95 | ||||
| 2025-08-13 | 13F | Russell Investments Group, Ltd. | 189 | 26,85 | 12 | 50,00 | ||||
| 2025-07-30 | 13F | VCI Wealth Management LLC | 21 409 | 7,40 | 1 388 | 23,73 | ||||
| 2025-08-12 | 13F | Nemes Rush Group LLC | 0 | −100,00 | 0 | |||||
| 2025-07-16 | 13F | Beaumont Financial Advisors, LLC | 28 557 | 1 851 | ||||||
| 2025-08-05 | 13F | Bank Of Montreal /can/ | 0 | −100,00 | 0 | |||||
| 2025-08-14 | 13F | Colony Group, LLC | 12 274 | −3,13 | 795 | 11,66 | ||||
| 2025-08-11 | 13F | Citigroup Inc | 26 029 | 40,68 | 1 687 | 62,12 | ||||
| 2025-08-08 | 13F | Smithfield Trust Co | 6 650 | 41,19 | 0 | |||||
| 2025-07-25 | 13F | Envestnet Portfolio Solutions, Inc. | 0 | −100,00 | 0 | |||||
| 2025-07-28 | 13F | Axxcess Wealth Management, Llc | 0 | −100,00 | 0 | |||||
| 2025-08-14 | 13F | LaSalle St. Investment Advisors, LLC | 4 053 | −18,17 | 0 | |||||
| 2025-08-06 | 13F | Maltin Wealth Management, Inc. | 58 061 | 2,03 | 3 763 | 17,53 | ||||
| 2025-08-11 | 13F | Principal Securities, Inc. | 9 184 | 1 166,76 | 595 | 1 316,67 | ||||
| 2025-08-06 | 13F | Commonwealth Equity Services, Llc | 265 779 | 5,26 | 17 | 21,43 | ||||
| 2025-08-12 | 13F | LPL Financial LLC | 241 133 | 32,54 | 15 628 | 52,68 | ||||
| 2025-07-10 | 13F | Sovran Advisors, LLC | 6 256 | 10,61 | 401 | 35,02 | ||||
| 2025-08-01 | 13F | Rossby Financial, LCC | 531 | 0,00 | 34 | 17,24 | ||||
| 2025-08-11 | 13F | Beaumont Capital Management, LLC | 0 | −100,00 | 0 | |||||
| 2025-08-14 | 13F | Ameriprise Financial Inc | 4 280 | 1,21 | 277 | 16,88 | ||||
| 2025-08-11 | 13F | WPG Advisers, LLC | 79 | 0,00 | 5 | 25,00 |