Grunnleggende statistikk
| Institusjonelle eiere | 139 total, 139 long only, 0 short only, 0 long/short - change of 0,72% MRQ |
| Gjennomsnittlig porteføljeallokering | 0.1291 % - change of −33,66% MRQ |
| Institusjonelle aksjer (Long) | 26 352 745 (ex 13D/G) - change of 12,74MM shares 93,56% MRQ |
| Institusjonell verdi (Long) | $ 267 782 USD ($1000) |
Institusjonelt eierskap og aksjonærer
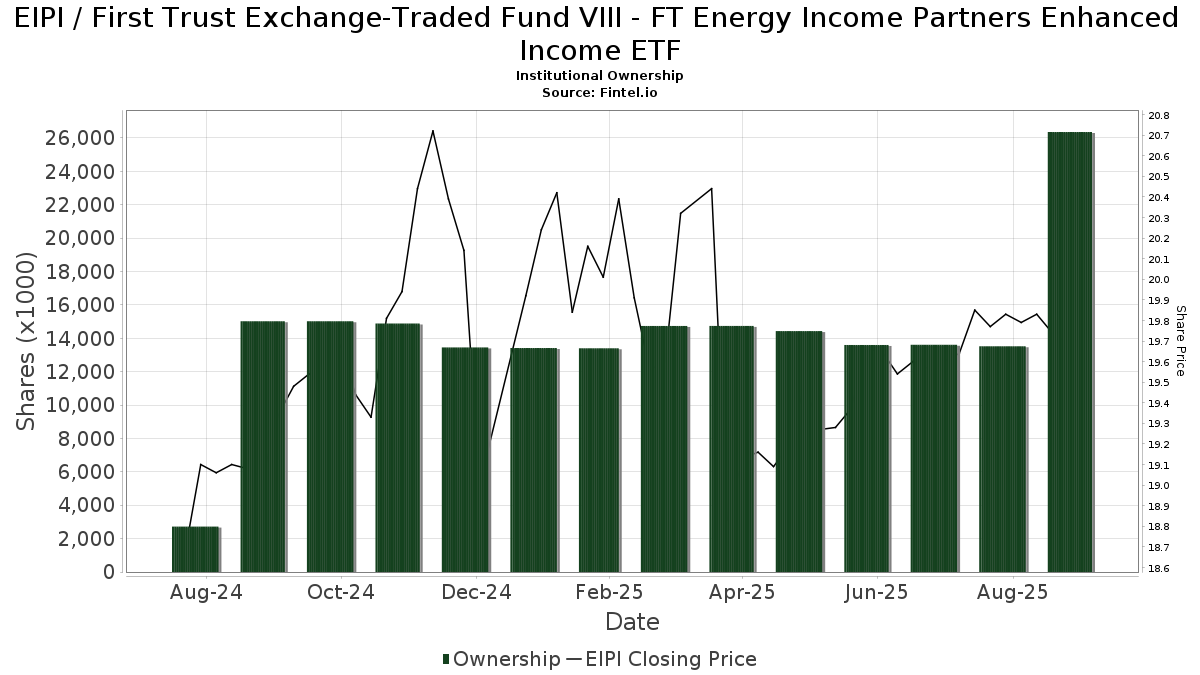
First Trust Exchange-Traded Fund VIII - FT Energy Income Partners Enhanced Income ETF (US:EIPI) har 139 institusjonelle eiere og aksjonærer som har sendt inn 13D/G- eller 13F-skjemaer til Securities Exchange Commission (SEC). Disse institusjonene eier til sammen 26,352,745 aksjer. De største aksjonærene inkluderer Proficio Capital Partners LLC, Morgan Stanley, LPL Financial LLC, Coastal Bridge Advisors, LLC, UBS Group AG, Wealthspire Advisors, LLC, Modern Wealth Management, LLC, Royal Bank Of Canada, Raymond James Financial Inc, and Advisors Asset Management, Inc. .
First Trust Exchange-Traded Fund VIII - FT Energy Income Partners Enhanced Income ETF (ARCA:EIPI) institusjonell eierstruktur viser nåværende posisjoner i selskapet fordelt på institusjoner og fond, samt de siste endringene i posisjonsstørrelse. De største aksjonærene kan være individuelle investorer, verdipapirfond, hedgefond eller institusjoner. Schedule 13D indikerer at investoren eier (eller har eid) mer enn 5 % av selskapet og har til hensikt (eller hadde til hensikt) å aktivt forfølge en endring i forretningsstrategien. Schedule 13G indikerer en passiv investering på over 5 %.
The share price as of September 10, 2025 is 19,69 / share. Previously, on September 11, 2024, the share price was 19,04 / share. This represents an increase of 3,41% over that period.
Fondssentiment-score
Fondssentiment Score (også kjent som akkumulering av eierskap poengsum) viser hvilke aksjer som er mest kjøpt av fond. Den er resultatet av en sofistikert, kvantitativ flerfaktormodell som identifiserer selskaper med de høyeste nivåene av institusjonell akkumulering. Beregningsmodellen for poeng bruker en kombinasjon av den totale økningen i antall offentliggjorte eiere, endringer i porteføljeallokeringen til disse eierne og andre beregninger. Tallet går fra 0 til 100, der høyere tall indikerer en høyere grad av akkumulering i forhold til sammenlignbare selskaper, der 50 er gjennomsnittet.
Oppdateringsfrekvens: Daglig
Sjekk ut Ownership Explorer, som inneholder en liste over de høyest rangerte selskapene.
Institusjonell Put/Call-forhold
I tillegg til å rapportere standard aksje- og gjeldsemisjoner må institusjoner med mer enn 100 millioner kroner i forvaltningskapital også oppgi beholdningen av put- og callopsjoner. Siden put-opsjoner generelt indikerer et negativt sentiment, og call-opsjoner indikerer et positivt sentiment, kan vi få et inntrykk av det generelle institusjonelle sentimentet ved å plotte forholdet mellom put- og call-opsjoner. Diagrammet til høyre viser det historiske forholdet mellom put- og call-opsjoner for dette instrumentet.
Ved å bruke Put/Call-forholdet som en indikator på investorsentimentet kan man overvinne en av de viktigste svakhetene ved å bruke totalt institusjonelt eierskap, nemlig at en betydelig andel av forvaltningskapitalen investeres passivt for å følge indekser. Passivt forvaltede fond kjøper vanligvis ikke opsjoner, slik at indikatoren for put/call-forhold i større grad gjenspeiler stemningen i aktivt forvaltede fond.
13F- og NPORT-arkiveringer
Detaljer om 13F-arkiveringer er gratis. Detaljer om NP-arkiveringer krever et premium-medlemskap. Grønne rader indikerer nye posisjoner. Røde rader indikerer lukkede posisjoner. Klikk på lenke ikonet for å se hele transaksjonshistorikken.
Oppgrader
for å låse opp premiedata og eksportere til Excel. ![]() .
.
| Fildato | Kilde | Investor | Type | Gjennomsnittlig pris (estimert) |
Aksjer | Δ Aksjer (%) |
Rapportert verdi ($1000) | Verdi (%) | Portallokering (%) | |
|---|---|---|---|---|---|---|---|---|---|---|
| 2025-07-09 | 13F | Fiduciary Alliance LLC | 15 449 | −2,00 | 305 | −4,70 | ||||
| 2025-08-08 | 13F | Compass Wealth Management LLC | 0 | −100,00 | 0 | |||||
| 2025-08-14 | 13F | Royal Bank Of Canada | 759 049 | −18,33 | 14 968 | −20,63 | ||||
| 2025-08-14 | 13F | Old Mission Capital Llc | 61 342 | 163,93 | 1 210 | 156,69 | ||||
| 2025-07-11 | 13F | Farther Finance Advisors, LLC | 580 | −84,88 | 11 | −85,90 | ||||
| 2025-07-21 | 13F | Ameriflex Group, Inc. | 0 | −100,00 | 0 | |||||
| 2025-07-30 | 13F | Nottingham Advisors, Inc. | 126 732 | 0,69 | 2 499 | −2,12 | ||||
| 2025-08-04 | 13F | Kovack Advisors, Inc. | 12 786 | −4,12 | 252 | −6,67 | ||||
| 2025-08-08 | 13F | Kingsview Wealth Management, LLC | 126 039 | 0,13 | 2 485 | −2,70 | ||||
| 2025-08-05 | 13F | EPG Wealth Management LLC | 0 | −100,00 | 0 | |||||
| 2025-07-30 | 13F | D.a. Davidson & Co. | 84 613 | 19,00 | 1 669 | 15,67 | ||||
| 2025-07-31 | 13F | Cambridge Investment Research Advisors, Inc. | 289 673 | −10,53 | 6 | −16,67 | ||||
| 2025-05-12 | 13F | Richard W. Paul & Associates, LLC | 0 | −100,00 | 0 | |||||
| 2025-08-12 | 13F | Bokf, Na | 2 137 | −78,07 | 42 | −78,68 | ||||
| 2025-05-15 | 13F | Tower Research Capital LLC (TRC) | 0 | −100,00 | 0 | |||||
| 2025-08-19 | 13F | National Asset Management, Inc. | 11 017 | −16,71 | 217 | −15,56 | ||||
| 2025-09-04 | 13F/A | Advisor Group Holdings, Inc. | 264 480 | 20,06 | 5 213 | 16,65 | ||||
| 2025-07-30 | 13F | Princeton Global Asset Management LLC | 1 790 | 0,00 | 35 | −2,78 | ||||
| 2025-08-14 | 13F | UBS Group AG | 870 211 | −6,92 | 17 161 | −9,54 | ||||
| 2025-08-14 | 13F | Mariner, LLC | 16 237 | 320 | ||||||
| 2025-08-13 | 13F | Latash Investments, LLC | 32 168 | 0,00 | 634 | −2,76 | ||||
| 2025-07-23 | 13F | Kingswood Wealth Advisors, Llc | 79 520 | −4,45 | 1 568 | −7,11 | ||||
| 2025-07-18 | 13F | SOA Wealth Advisors, LLC. | 196 | 0,00 | 4 | 0,00 | ||||
| 2025-07-21 | 13F | Crews Bank & Trust | 599 | 12 | ||||||
| 2025-08-14 | 13F | Comerica Bank | 24 958 | 23,55 | 492 | 20,29 | ||||
| 2025-07-17 | 13F/A | Capital Investment Advisors, LLC | 10 282 | 0,00 | 203 | −2,88 | ||||
| 2025-08-14 | 13F | Riggs Asset Managment Co. Inc. | 328 | −35,69 | 6 | −40,00 | ||||
| 2025-08-12 | 13F | CIBC Private Wealth Group, LLC | 14 141 | 0,00 | 279 | 9,88 | ||||
| 2025-08-14 | 13F | Susquehanna International Group, Llp | 166 475 | 547,38 | 3 283 | 529,94 | ||||
| 2025-05-13 | 13F | Aptus Capital Advisors, LLC | 0 | −100,00 | 0 | |||||
| 2025-08-05 | 13F | Scarborough Advisors, LLC | 1 207 | 24 | ||||||
| 2025-08-11 | 13F | Wealthspire Advisors, LLC | 835 348 | −7,76 | 16 473 | −10,35 | ||||
| 2025-08-11 | 13F | Brown Brothers Harriman & Co | 79 619 | 1 570 | ||||||
| 2025-08-18 | 13F | N.E.W. Advisory Services LLC | 1 789 | −49,03 | 35 | −50,70 | ||||
| 2025-08-14 | 13F | Ancora Advisors, LLC | 1 552 | 1,90 | 31 | 0,00 | ||||
| 2025-05-13 | 13F | Terril Brothers, Inc. | 0 | −100,00 | 0 | |||||
| 2025-08-14 | 13F | Wells Fargo & Company/mn | 47 640 | 0,88 | 939 | −1,98 | ||||
| 2025-08-14 | 13F/A | Rockefeller Capital Management L.P. | 19 395 | 0,00 | 382 | −2,80 | ||||
| 2025-08-14 | 13F | Raymond James Financial Inc | 467 318 | −3,58 | 9 215 | −6,29 | ||||
| 2025-07-22 | 13F | Cedar Mountain Advisors, LLC | 723 | 0,00 | 14 | 0,00 | ||||
| 2025-07-21 | 13F | Catalina Capital Group, LLC | 0 | −100,00 | 0 | |||||
| 2025-07-25 | 13F | Cwm, Llc | 1 716 | 0,00 | 0 | |||||
| 2025-08-04 | 13F | L.m. Kohn & Company | 21 022 | 55,94 | 415 | 51,65 | ||||
| 2025-08-08 | 13F | Pnc Financial Services Group, Inc. | 572 | 0,00 | 11 | 0,00 | ||||
| 2025-08-13 | 13F | EverSource Wealth Advisors, LLC | 0 | −100,00 | 0 | |||||
| 2025-07-16 | 13F | West Branch Capital LLC | 5 911 | 0,00 | 117 | −2,52 | ||||
| 2025-07-24 | 13F | Thompson Investment Management, Inc. | 4 575 | 90 | ||||||
| 2025-08-12 | 13F | Founders Financial Alliance, LLC | 1 740 | 2,35 | 34 | 0,00 | ||||
| 2025-04-30 | 13F | Axxcess Wealth Management, Llc | 0 | −100,00 | 0 | |||||
| 2025-07-31 | 13F | Moloney Securities Asset Management, LLC | 61 003 | 1,99 | 1 203 | −0,91 | ||||
| 2025-08-06 | 13F | Commonwealth Equity Services, Llc | 105 867 | 15,99 | 2 | 100,00 | ||||
| 2025-08-12 | 13F | Wayfinding Financial, LLC | 0 | −100,00 | 0 | |||||
| 2025-08-14 | 13F | Financial Network Wealth Advisors LLC | 797 | 16 | ||||||
| 2025-07-29 | 13F | Koshinski Asset Management, Inc. | 25 207 | 0,06 | 497 | −2,74 | ||||
| 2025-08-12 | 13F | Advisors Asset Management, Inc. | 369 270 | −30,93 | 7 282 | −32,88 | ||||
| 2025-07-14 | 13F | Sowell Financial Services LLC | 155 262 | −0,54 | 3 062 | −3,35 | ||||
| 2025-04-14 | 13F | Umb Bank N A/mo | 0 | −100,00 | 0 | −100,00 | ||||
| 2025-05-16 | 13F/A | Kestra Investment Management, LLC | 0 | −100,00 | 0 | |||||
| 2025-08-07 | 13F | McClarren Financial Advisors, Inc. | 0 | −100,00 | 0 | |||||
| 2025-08-08 | 13F | Avantax Advisory Services, Inc. | 114 504 | 7,17 | 2 258 | 4,15 | ||||
| 2025-09-09 | 13F | NWF Advisory Services Inc. | 104 635 | 5,23 | 2 063 | 2,28 | ||||
| 2025-07-14 | 13F | Whitener Capital Management, Inc. | 17 312 | −7,52 | 341 | −10,03 | ||||
| 2025-08-05 | 13F | Simplex Trading, Llc | 642 | 3 110,00 | 0 | |||||
| 2025-08-12 | 13F | Mystic Asset Management, Inc. | 96 967 | 0,75 | 1 912 | −2,05 | ||||
| 2025-08-04 | 13F | IFG Advisory, LLC | 21 306 | 13,12 | 420 | 9,95 | ||||
| 2025-07-25 | 13F | We Are One Seven, LLC | 69 935 | −2,40 | 1 379 | −5,09 | ||||
| 2025-07-23 | 13F | WESPAC Advisors, LLC | 35 048 | 2,26 | 691 | −0,58 | ||||
| 2025-07-21 | 13F | Future Financial Wealth Managment LLC | 2 541 | 0,00 | 50 | −1,96 | ||||
| 2025-08-15 | 13F | Puff Wealth Management, Llc | 21 249 | 1,57 | 419 | −1,18 | ||||
| 2025-08-07 | 13F | Kestra Private Wealth Services, Llc | 16 296 | 0,46 | 321 | −2,43 | ||||
| 2025-08-19 | 13F | Advisory Services Network, LLC | 11 318 | 0,74 | 225 | −0,88 | ||||
| 2025-07-16 | 13F | Formidable Asset Management, LLC | 55 523 | 0,00 | 1 127 | 0,00 | ||||
| 2025-07-08 | 13F | Nbc Securities, Inc. | 52 637 | 13,45 | 1 | |||||
| 2025-07-11 | 13F | LongView Wealth Management | 215 874 | 0,16 | 4 257 | −2,65 | ||||
| 2025-07-07 | 13F | Thurston, Springer, Miller, Herd & Titak, Inc. | 2 391 | 0,00 | 47 | −2,08 | ||||
| 2025-07-18 | 13F | Dogwood Wealth Management LLC | 1 264 | 25 | ||||||
| 2025-07-17 | 13F | Vermillion Wealth Management, Inc. | 123 | 2,50 | 2 | 0,00 | ||||
| 2025-08-12 | 13F | Park Square Financial Group, LLC | 415 | −25,89 | 8 | −27,27 | ||||
| 2025-08-12 | 13F | Retirement Planning Co of New England, Inc. | 141 504 | 1,39 | 2 790 | −1,45 | ||||
| 2025-08-14 | 13F | Modern Wealth Management, LLC | 814 854 | −1,62 | 16 069 | −4,39 | ||||
| 2025-08-11 | 13F | Principal Securities, Inc. | 1 035 | 2,88 | 20 | 5,26 | ||||
| 2025-07-28 | 13F | Bridges Investment Management Inc | 121 300 | −30,75 | 2 392 | −32,68 | ||||
| 2025-08-04 | 13F | Spire Wealth Management | 4 146 | 0,00 | 82 | −3,57 | ||||
| 2025-08-08 | 13F | Cetera Investment Advisers | 39 344 | 2,98 | 776 | 0,00 | ||||
| 2025-08-12 | 13F | Global Retirement Partners, LLC | 202 | 0,00 | 4 | 0,00 | ||||
| 2025-08-13 | 13F | Northwestern Mutual Wealth Management Co | 21 287 | −4,16 | 420 | −6,89 | ||||
| 2025-07-28 | 13F | Harbour Investments, Inc. | 2 088 | 1,95 | 41 | 0,00 | ||||
| 2025-08-12 | 13F | Pathstone Holdings, LLC | 17 415 | 1,90 | 343 | −0,87 | ||||
| 2025-08-05 | 13F | Prosperity Wealth Management, Inc. | 15 383 | 11,90 | 303 | 8,99 | ||||
| 2025-07-17 | 13F | Janney Montgomery Scott LLC | 21 418 | −4,45 | 0 | |||||
| 2025-05-14 | 13F | Jane Street Group, Llc | 0 | −100,00 | 0 | |||||
| 2025-07-18 | 13F | Truist Financial Corp | 10 829 | −4,68 | 214 | −7,39 | ||||
| 2025-07-24 | 13F | IFP Advisors, Inc | 9 866 | −5,18 | 195 | −8,06 | ||||
| 2025-07-31 | 13F | Stegent Equity Advisors, Inc. | 10 906 | 0,00 | 215 | −2,71 | ||||
| 2025-07-11 | 13F | Pinnacle Bancorp, Inc. | 1 462 | 18,48 | 29 | 12,00 | ||||
| 2025-07-16 | 13F | Cambridge Advisors Inc. | 141 873 | 2,34 | 2 798 | −0,53 | ||||
| 2025-08-04 | 13F | Assetmark, Inc | 1 719 | 34 | ||||||
| 2025-08-28 | NP | Cohen & Steers Closed-end Opportunity Fund, Inc. | 38 937 | −56,22 | 768 | −57,48 | ||||
| 2025-08-05 | 13F | Carolinas Wealth Consulting Llc | 0 | −100,00 | 0 | −100,00 | ||||
| 2025-05-14 | 13F | Ameriprise Financial Inc | 0 | −100,00 | 0 | −100,00 | ||||
| 2025-07-31 | 13F | Whipplewood Advisors, LLC | 8 350 | 64 130,77 | 165 | −2,96 | ||||
| 2025-08-06 | 13F | Prospera Financial Services Inc | 84 895 | 4,78 | 1 674 | 1,82 | ||||
| 2025-08-12 | 13F | Armor Investment Advisors, LLC | 27 113 | −6,54 | 535 | −9,18 | ||||
| 2025-08-14 | 13F | Sunbelt Securities, Inc. | 581 | 0,00 | 11 | 0,00 | ||||
| 2025-05-15 | 13F | Citadel Advisors Llc | 0 | −100,00 | 0 | |||||
| 2025-07-25 | 13F | Atria Wealth Solutions, Inc. | 30 285 | 0,60 | 597 | −2,30 | ||||
| 2025-08-15 | 13F | Kestra Advisory Services, LLC | 37 664 | −3,41 | 743 | −6,19 | ||||
| 2025-07-16 | 13F | Magnus Financial Group LLC | 64 071 | −12,08 | 1 263 | −14,55 | ||||
| 2025-07-22 | 13F | Belpointe Asset Management LLC | 15 377 | 0,00 | 303 | −2,57 | ||||
| 2025-07-28 | 13F | Fairman Group, LLC | 15 709 | 0,00 | 310 | 0,98 | ||||
| 2025-05-14 | 13F | Flow Traders U.s. Llc | 0 | −100,00 | 0 | |||||
| 2025-08-14 | 13F | Stifel Financial Corp | 79 454 | 2,88 | 1 567 | 0,00 | ||||
| 2025-07-21 | 13F | DHJJ Financial Advisors, Ltd. | 1 005 | 0,00 | 20 | −5,00 | ||||
| 2025-08-11 | 13F | Nations Financial Group Inc, /ia/ /adv | 0 | −100,00 | 0 | |||||
| 2025-08-08 | 13F | Altfest L J & Co Inc | 68 064 | 0,83 | 1 342 | −1,97 | ||||
| 2025-08-13 | 13F | Smith, Moore & Co. | 26 052 | 99,07 | 514 | 93,58 | ||||
| 2025-04-28 | 13F | Mutual Advisors, LLC | 0 | −100,00 | 0 | |||||
| 2025-08-14 | 13F | CoreCap Advisors, LLC | 61 867 | 0,41 | 1 220 | −2,40 | ||||
| 2025-08-06 | 13F | Moors & Cabot, Inc. | 27 435 | 3,71 | 541 | 0,93 | ||||
| 2025-08-12 | 13F | LPL Financial LLC | 1 005 342 | 0,78 | 19 825 | −2,06 | ||||
| 2025-08-12 | 13F | Change Path, LLC | 26 941 | −15,20 | 531 | −17,55 | ||||
| 2025-08-15 | 13F | Morgan Stanley | 2 322 813 | −2,08 | 45 805 | −4,83 | ||||
| 2025-08-06 | 13F | Legacy Wealth Managment, LLC/ID | 1 905 | 0,00 | 38 | −2,63 | ||||
| 2025-08-14 | 13F | IHT Wealth Management, LLC | 19 763 | 390 | ||||||
| 2025-08-06 | 13F | AE Wealth Management LLC | 4 139 | 0,10 | 82 | −2,41 | ||||
| 2025-08-06 | 13F | Legacy Investment Solutions, LLC | 1 905 | 0,00 | 38 | −2,63 | ||||
| 2025-08-05 | 13F | Kesler, Norman & Wride, LLC | 14 049 | −2,58 | 277 | −5,14 | ||||
| 2025-08-13 | 13F | Capital Advisors Wealth Management, LLC | 14 055 | 1,95 | 277 | −0,72 | ||||
| 2025-07-29 | 13F | Stratos Wealth Partners, LTD. | 20 809 | 9,10 | 410 | 5,94 | ||||
| 2025-07-07 | 13F | Investors Research Corp | 0 | −100,00 | 0 | |||||
| 2025-08-18 | 13F | Geneos Wealth Management Inc. | 541 | 0,00 | 11 | 0,00 | ||||
| 2025-05-01 | 13F | Schechter Investment Advisors, LLC | 0 | −100,00 | 0 | |||||
| 2025-07-24 | 13F | Us Bancorp \de\ | 1 003 | 2,98 | 20 | 0,00 | ||||
| 2025-08-14 | 13F | Icon Wealth Advisors, LLC | 19 815 | 1,92 | 391 | −1,02 | ||||
| 2025-08-11 | 13F | HighTower Advisors, LLC | 24 934 | −11,12 | 492 | −13,71 | ||||
| 2025-08-29 | NP | OneAscent Capital Opportunities Fund | 40 000 | 95,12 | 789 | 89,88 | ||||
| 2025-07-31 | 13F | Strait & Sound Wealth Management LLC | 67 313 | 9,51 | 1 327 | 6,42 | ||||
| 2025-08-01 | 13F | Winebrenner Capital Management Llc | 85 952 | −0,28 | 1 695 | −3,09 | ||||
| 2025-08-05 | 13F | Sigma Planning Corp | 11 670 | 4,26 | 230 | 1,32 | ||||
| 2025-08-07 | 13F | Allworth Financial LP | 2 532 | 78,31 | 50 | 81,48 | ||||
| 2025-07-31 | 13F | AlTi Global, Inc. | 48 539 | −0,27 | 957 | −3,04 | ||||
| 2025-08-07 | 13F | Resources Investment Advisors, LLC. | 44 554 | −7,92 | 879 | −10,50 | ||||
| 2025-08-14 | 13F | Coastal Bridge Advisors, LLC | 892 783 | 2,28 | 17 605 | −0,60 | ||||
| 2025-07-25 | 13F | Concurrent Investment Advisors, LLC | 18 183 | 359 | ||||||
| 2025-08-13 | 13F | Baird Financial Group, Inc. | 0 | −100,00 | 0 | |||||
| 2025-08-13 | 13F | Cresset Asset Management, LLC | 54 428 | 0,00 | 1 073 | −2,81 | ||||
| 2025-08-14 | 13F | GWM Advisors LLC | 40 751 | −10,29 | 804 | −12,81 | ||||
| 2025-08-07 | 13F | Proficio Capital Partners LLC | 12 937 487 | 13 399 | ||||||
| 2025-08-12 | 13F | MAI Capital Management | 41 382 | −0,49 | 816 | −3,20 | ||||
| 2025-08-08 | 13F | SBI Securities Co., Ltd. | 7 | 0 | ||||||
| 2025-07-29 | 13F | Stephens Inc /ar/ | 42 413 | 0,03 | 836 | −2,79 | ||||
| 2025-08-12 | 13F | Proequities, Inc. | 0 | 0 | ||||||
| 2025-07-31 | 13F | Oppenheimer & Co Inc | 189 379 | 0,55 | 3 735 | −2,28 | ||||
| 2025-08-14 | 13F | Cohen & Steers, Inc. | 38 937 | −56,22 | 1 | −100,00 | ||||
| 2025-08-01 | 13F | Bessemer Group Inc | 1 688 | 0 | ||||||
| 2025-07-22 | 13F | Iron Horse Wealth Management, LLC | 0 | −100,00 | 0 | |||||
| 2025-08-11 | 13F | Private Advisor Group, LLC | 46 093 | −0,94 | 909 | −3,81 | ||||
| 2025-07-29 | 13F | Salomon & Ludwin, LLC | 704 | 0,00 | 14 | −7,14 | ||||
| 2025-07-25 | 13F | Community Bank, N.A. | 100 000 | 0,00 | 1 971 | −2,81 | ||||
| 2025-07-30 | 13F | Whittier Trust Co Of Nevada Inc | 16 060 | 0,00 | 317 | −2,77 | ||||
| 2025-08-12 | 13F | Steward Partners Investment Advisory, Llc | 45 605 | 1,82 | 899 | −0,99 | ||||
| 2025-08-14 | 13F | Bank Of America Corp /de/ | 11 721 | 231 | ||||||
| 2025-07-10 | 13F | Wealth Enhancement Advisory Services, Llc | 98 833 | −1,99 | 1 947 | −4,79 | ||||
| 2025-07-23 | 13F | Morey & Quinn Wealth Partners, LLC | 0 | −100,00 | 0 | |||||
| 2025-07-25 | 13F | Hazlett, Burt & Watson, Inc. | 1 479 | 0,00 | 0 | |||||
| 2025-08-14 | 13F | Aqr Capital Management Llc | 14 433 | 285 |