Grunnleggende statistikk
| Institusjonelle eiere | 141 total, 141 long only, 0 short only, 0 long/short - change of −3,42% MRQ |
| Gjennomsnittlig porteføljeallokering | 0.1721 % - change of −9,14% MRQ |
| Institusjonelle aksjer (Long) | 6 986 679 (ex 13D/G) - change of −0,33MM shares −4,55% MRQ |
| Institusjonell verdi (Long) | $ 335 745 USD ($1000) |
Institusjonelt eierskap og aksjonærer
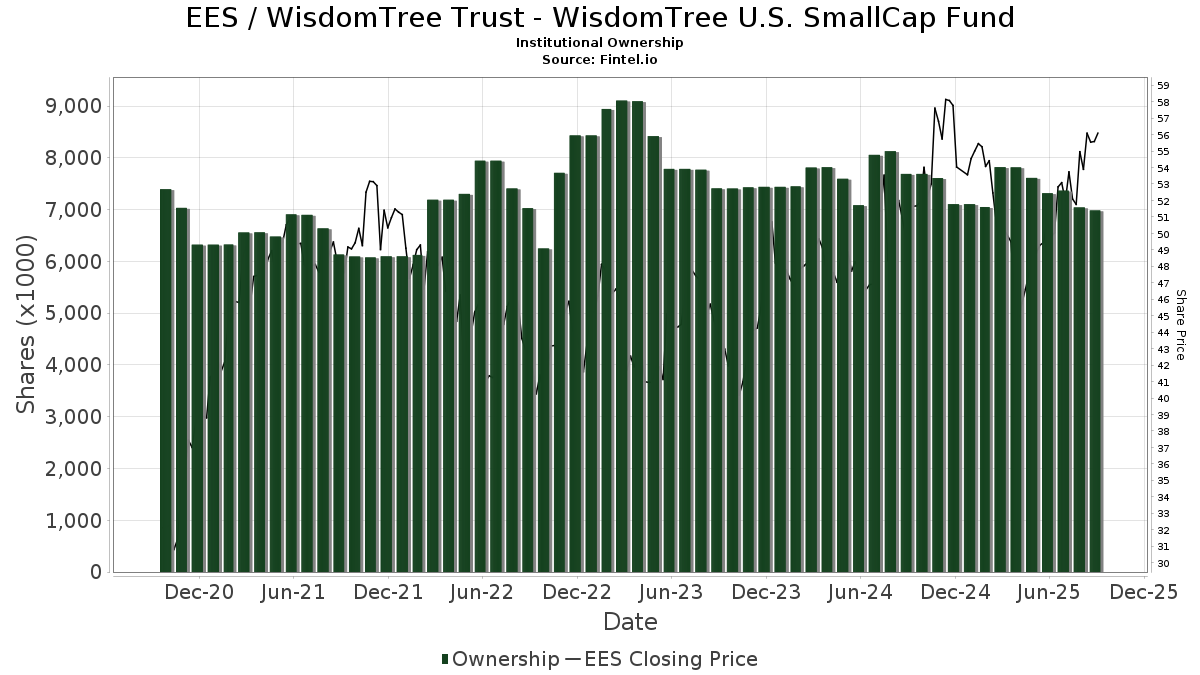
WisdomTree Trust - WisdomTree U.S. SmallCap Fund (US:EES) har 141 institusjonelle eiere og aksjonærer som har sendt inn 13D/G- eller 13F-skjemaer til Securities Exchange Commission (SEC). Disse institusjonene eier til sammen 6,986,679 aksjer. De største aksjonærene inkluderer Bank Of America Corp /de/, Morgan Stanley, UBS Group AG, LPL Financial LLC, Ameriprise Financial Inc, Cetera Investment Advisers, Shore Point Advisors, LLC, Key FInancial Inc, Savant Capital, LLC, and Laurel Wealth Advisors LLC .
WisdomTree Trust - WisdomTree U.S. SmallCap Fund (ARCA:EES) institusjonell eierstruktur viser nåværende posisjoner i selskapet fordelt på institusjoner og fond, samt de siste endringene i posisjonsstørrelse. De største aksjonærene kan være individuelle investorer, verdipapirfond, hedgefond eller institusjoner. Schedule 13D indikerer at investoren eier (eller har eid) mer enn 5 % av selskapet og har til hensikt (eller hadde til hensikt) å aktivt forfølge en endring i forretningsstrategien. Schedule 13G indikerer en passiv investering på over 5 %.
The share price as of September 12, 2025 is 55,92 / share. Previously, on September 12, 2024, the share price was 50,18 / share. This represents an increase of 11,45% over that period.
Fondssentiment-score
Fondssentiment Score (også kjent som akkumulering av eierskap poengsum) viser hvilke aksjer som er mest kjøpt av fond. Den er resultatet av en sofistikert, kvantitativ flerfaktormodell som identifiserer selskaper med de høyeste nivåene av institusjonell akkumulering. Beregningsmodellen for poeng bruker en kombinasjon av den totale økningen i antall offentliggjorte eiere, endringer i porteføljeallokeringen til disse eierne og andre beregninger. Tallet går fra 0 til 100, der høyere tall indikerer en høyere grad av akkumulering i forhold til sammenlignbare selskaper, der 50 er gjennomsnittet.
Oppdateringsfrekvens: Daglig
Sjekk ut Ownership Explorer, som inneholder en liste over de høyest rangerte selskapene.
Institusjonell Put/Call-forhold
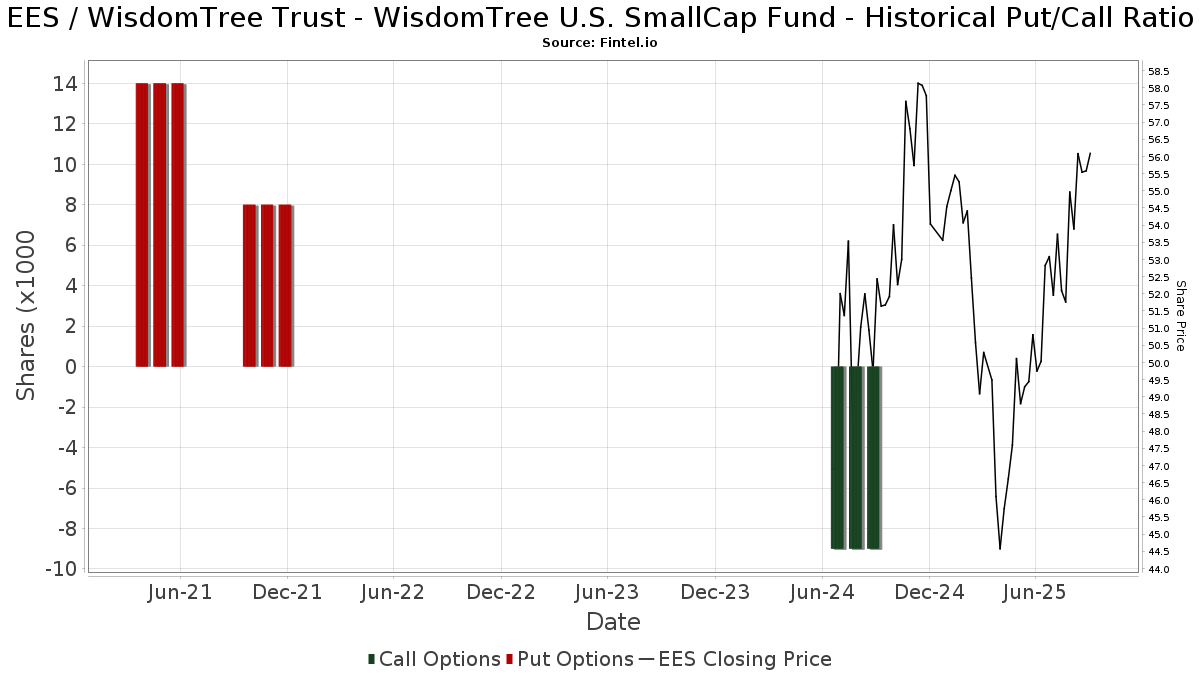
I tillegg til å rapportere standard aksje- og gjeldsemisjoner må institusjoner med mer enn 100 millioner kroner i forvaltningskapital også oppgi beholdningen av put- og callopsjoner. Siden put-opsjoner generelt indikerer et negativt sentiment, og call-opsjoner indikerer et positivt sentiment, kan vi få et inntrykk av det generelle institusjonelle sentimentet ved å plotte forholdet mellom put- og call-opsjoner. Diagrammet til høyre viser det historiske forholdet mellom put- og call-opsjoner for dette instrumentet.
Ved å bruke Put/Call-forholdet som en indikator på investorsentimentet kan man overvinne en av de viktigste svakhetene ved å bruke totalt institusjonelt eierskap, nemlig at en betydelig andel av forvaltningskapitalen investeres passivt for å følge indekser. Passivt forvaltede fond kjøper vanligvis ikke opsjoner, slik at indikatoren for put/call-forhold i større grad gjenspeiler stemningen i aktivt forvaltede fond.
13F- og NPORT-arkiveringer
Detaljer om 13F-arkiveringer er gratis. Detaljer om NP-arkiveringer krever et premium-medlemskap. Grønne rader indikerer nye posisjoner. Røde rader indikerer lukkede posisjoner. Klikk på lenke ikonet for å se hele transaksjonshistorikken.
Oppgrader
for å låse opp premiedata og eksportere til Excel. ![]() .
.
| Fildato | Kilde | Investor | Type | Gjennomsnittlig pris (estimert) |
Aksjer | Δ Aksjer (%) |
Rapportert verdi ($1000) | Verdi (%) | Portallokering (%) | |
|---|---|---|---|---|---|---|---|---|---|---|
| 2025-08-19 | 13F | Newbridge Financial Services Group, Inc. | 375 | 0,00 | 19 | 5,56 | ||||
| 2025-07-07 | 13F | Nova Wealth Management, Inc. | 118 | 81,54 | 6 | 100,00 | ||||
| 2025-07-10 | 13F | Wealth Enhancement Advisory Services, Llc | 6 512 | −13,84 | 345 | −6,50 | ||||
| 2025-08-06 | 13F | Golden State Wealth Management, LLC | 535 | 0,19 | 27 | 3,85 | ||||
| 2025-08-05 | 13F | NewSquare Capital LLC | 47 387 | 8,51 | 2 415 | 13,23 | ||||
| 2025-07-09 | 13F | Shore Point Advisors, LLC | 277 857 | 3,67 | 14 160 | 8,17 | ||||
| 2025-07-15 | 13F | Optima Capital Llc | 24 222 | 0,04 | 1 234 | 4,40 | ||||
| 2025-07-22 | 13F | Berger Financial Group, Inc | 5 436 | 0,00 | 277 | 4,53 | ||||
| 2025-08-11 | 13F | Lowe Brockenbrough & Co Inc | 1 200 | 61 | ||||||
| 2025-08-26 | 13F | Claris Financial LLC | 16 342 | −33,43 | 833 | −37,16 | ||||
| 2025-07-22 | 13F | Team Financial Group, LLC | 2 769 | 141 | ||||||
| 2025-07-29 | 13F | Smithbridge Asset Management Inc/de | 6 591 | −84,77 | 336 | −84,15 | ||||
| 2025-08-04 | 13F | Linscomb & Williams, Inc. | 171 819 | −2,18 | 8 756 | 2,06 | ||||
| 2025-08-12 | 13F | Steward Partners Investment Advisory, Llc | 21 854 | −64,36 | 1 114 | −62,83 | ||||
| 2025-08-15 | 13F | Kestra Advisory Services, LLC | 20 427 | 8,17 | 1 041 | 12,80 | ||||
| 2025-07-29 | 13F | Chicago Partners Investment Group LLC | 7 330 | 0,26 | 394 | 13,26 | ||||
| 2025-08-14 | 13F | Smartleaf Asset Management LLC | 17 957 | 3,61 | 916 | 8,03 | ||||
| 2025-08-11 | 13F | Rothschild Investment Llc | 1 400 | 0,00 | 71 | 4,41 | ||||
| 2025-08-12 | 13F | Coston, McIsaac & Partners | 100 | 0,00 | 0 | |||||
| 2025-08-11 | 13F | HighTower Advisors, LLC | 0 | −100,00 | 0 | |||||
| 2025-08-08 | 13F | Cetera Investment Advisers | 313 673 | −1,66 | 15 985 | 2,61 | ||||
| 2025-08-11 | 13F | Covestor Ltd | 109 | 15,96 | 0 | |||||
| 2025-07-08 | 13F | Nbc Securities, Inc. | 10 125 | 2,26 | 1 | |||||
| 2025-08-14 | 13F | UBS Group AG | 720 106 | −1,88 | 36 697 | 2,38 | ||||
| 2025-07-17 | 13F | Janney Montgomery Scott LLC | 4 810 | 0,00 | 0 | |||||
| 2025-08-08 | 13F | Larson Financial Group LLC | 16 507 | 0,35 | 841 | 4,73 | ||||
| 2025-08-13 | 13F | Transce3nd, LLC | 711 | −0,70 | 36 | 5,88 | ||||
| 2025-08-13 | 13F | Cheviot Value Management, LLC | 199 | 0,00 | 10 | 11,11 | ||||
| 2025-08-12 | 13F | CIBC Private Wealth Group, LLC | 10 740 | 0,00 | 547 | 19,96 | ||||
| 2025-07-14 | 13F | S.A. Mason LLC | 9 450 | 0,00 | 482 | 4,34 | ||||
| 2025-07-23 | 13F | Indiana Trust & Investment Management CO | 2 143 | 0,00 | 109 | 4,81 | ||||
| 2025-08-06 | 13F | Prospera Financial Services Inc | 15 653 | −22,01 | 799 | −18,65 | ||||
| 2025-08-11 | 13F | NewEdge Wealth, LLC | 0 | −100,00 | 0 | |||||
| 2025-07-21 | 13F | Ameriflex Group, Inc. | 0 | −100,00 | 0 | |||||
| 2025-08-12 | 13F | LPL Financial LLC | 510 962 | 7,63 | 26 039 | 12,31 | ||||
| 2025-04-09 | 13F | Graves-Light Private Wealth Management, Inc. | 0 | −100,00 | 0 | |||||
| 2025-08-15 | 13F | Equitable Holdings, Inc. | 4 795 | 244 | ||||||
| 2025-08-14 | 13F | Qube Research & Technologies Ltd | 133 | 0,00 | 7 | 0,00 | ||||
| 2025-08-08 | 13F | Creative Planning | 26 177 | 0,42 | 1 334 | 4,79 | ||||
| 2025-05-13 | 13F | EPG Wealth Management LLC | 0 | −100,00 | 0 | −100,00 | ||||
| 2025-07-24 | 13F | Us Bancorp \de\ | 8 577 | 0,00 | 437 | 4,55 | ||||
| 2025-08-12 | 13F | PSI Advisors, LLC | 5 971 | 0,00 | 304 | 4,47 | ||||
| 2025-08-04 | 13F | Assetmark, Inc | 777 | 432,19 | 40 | 457,14 | ||||
| 2025-08-11 | 13F | Citigroup Inc | 1 839 | 9,14 | 94 | 13,41 | ||||
| 2025-07-10 | 13F | Global Financial Private Client, LLC | 0 | −100,00 | 0 | |||||
| 2025-07-22 | 13F | DAVENPORT & Co LLC | 7 158 | 57,39 | 365 | 63,96 | ||||
| 2025-08-04 | 13F | Pensionmark Financial Group, Llc | 0 | −100,00 | 0 | |||||
| 2025-08-04 | 13F | Atria Investments Llc | 39 702 | 18,29 | 2 023 | 23,43 | ||||
| 2025-08-11 | 13F | Invenio Wealth Partners Llc | 0 | −100,00 | 0 | |||||
| 2025-08-12 | 13F | Clearwater Capital Advisors, LLC | 4 230 | −1,76 | 216 | 2,38 | ||||
| 2025-07-24 | 13F | Blair William & Co/il | 12 599 | −12,26 | 642 | −8,42 | ||||
| 2025-05-28 | 13F | Intrua Financial, LLC | 0 | −100,00 | 0 | −100,00 | ||||
| 2025-07-15 | 13F | FLP Wealth Management, LLC | 0 | −100,00 | 0 | |||||
| 2025-08-14 | 13F | Mariner, LLC | 5 407 | 6,37 | 276 | 10,89 | ||||
| 2025-07-08 | 13F | Arlington Trust Co LLC | 500 | 0,00 | 25 | 4,17 | ||||
| 2025-07-24 | 13F | Financial Connections Group, Inc. | 1 350 | 0,00 | 0 | |||||
| 2025-08-12 | 13F | Laurel Wealth Advisors LLC | 214 542 | 4 996,01 | 4 | −98,05 | ||||
| 2025-07-25 | 13F | Ruedi Wealth Management, Inc. | 0 | −100,00 | 0 | |||||
| 2025-07-30 | 13F | Insight Advisors, LLC/ PA | 40 118 | 4,60 | 2 044 | 9,13 | ||||
| 2025-07-31 | 13F | Cambridge Investment Research Advisors, Inc. | 18 553 | −4,04 | 1 | |||||
| 2025-07-10 | 13F | Kmg Fiduciary Partners, Llc | 10 334 | 11,43 | 527 | 16,37 | ||||
| 2025-08-11 | 13F | Culbertson A N & Co Inc | 62 454 | −1,45 | 3 183 | 2,81 | ||||
| 2025-03-14 | 13F | Leicht Financial Planning & Wealth Management, Inc. | 0 | −100,00 | 0 | |||||
| 2025-07-15 | 13F | Fifth Third Bancorp | 0 | −100,00 | 0 | |||||
| 2025-08-11 | 13F | Private Advisor Group, LLC | 64 768 | 5,03 | 3 301 | 9,60 | ||||
| 2025-08-14 | 13F | Royal Bank Of Canada | 111 081 | −1,16 | 5 660 | 3,12 | ||||
| 2025-08-07 | 13F | Allworth Financial LP | 638 | 16,00 | 33 | 28,00 | ||||
| 2025-08-14 | 13F/A | Rockefeller Capital Management L.P. | 11 375 | 0,02 | 580 | 4,32 | ||||
| 2025-07-21 | 13F | Precedent Wealth Partners, Llc | 8 079 | 0,90 | 412 | 5,12 | ||||
| 2025-08-14 | 13F/A | Forefront Analytics, LLC | 20 571 | −20,90 | 1 048 | −17,42 | ||||
| 2025-08-08 | 13F | Hartland & Co., LLC | 751 | 38 | ||||||
| 2025-07-28 | 13F | Frazier Financial Advisors, LLC | 133 | 0,00 | 7 | 0,00 | ||||
| 2025-07-15 | 13F | World Equity Group, Inc. | 5 751 | −2,13 | 293 | 0,69 | ||||
| 2025-08-14 | 13F | Susquehanna International Group, Llp | 27 966 | −79,01 | 1 425 | −78,10 | ||||
| 2025-08-15 | 13F | Captrust Financial Advisors | 3 945 | −23,10 | 201 | −19,60 | ||||
| 2025-07-24 | 13F | Jfs Wealth Advisors, Llc | 1 813 | 0,00 | 92 | 4,55 | ||||
| 2025-08-08 | 13F | Kingsview Wealth Management, LLC | 5 210 | −1,14 | 266 | 3,11 | ||||
| 2025-05-21 | 13F/A | Geneos Wealth Management Inc. | 0 | −100,00 | 0 | −100,00 | ||||
| 2025-07-23 | 13F | Defined Financial Planning LLC | 38 586 | 17,54 | 1 993 | 24,03 | ||||
| 2025-07-07 | 13F | Horizons Wealth Management | 832 | 0,00 | 42 | 5,00 | ||||
| 2025-07-29 | 13F | Uhlmann Price Securities, Llc | 4 587 | −5,03 | 234 | −0,85 | ||||
| 2025-08-14 | 13F | Mml Investors Services, Llc | 7 734 | −11,04 | 0 | |||||
| 2025-08-11 | 13F | Howard Wealth Management, Llc | 19 255 | 0,00 | 981 | 4,36 | ||||
| 2025-08-11 | 13F | Principal Securities, Inc. | 739 | −15,93 | 38 | −21,28 | ||||
| 2025-08-19 | 13F | Asset Dedication, LLC | 3 162 | 0,00 | 161 | 4,55 | ||||
| 2025-07-24 | 13F | Ronald Blue Trust, Inc. | 2 708 | 0,00 | 138 | 4,55 | ||||
| 2025-08-14 | 13F | Ancora Advisors, LLC | 95 | 0,00 | 5 | 0,00 | ||||
| 2025-04-10 | 13F | Cathy Pareto & Associates, Inc | 0 | −100,00 | 0 | |||||
| 2025-07-28 | 13F | Capital Management Corp /va | 5 427 | 3,37 | 277 | 7,81 | ||||
| 2025-08-05 | 13F | Dunhill Financial, LLC | 62 | 0,00 | 3 | 0,00 | ||||
| 2025-08-14 | 13F | Bank Of America Corp /de/ | 769 014 | −5,23 | 39 189 | −1,12 | ||||
| 2025-08-15 | 13F | Tower Research Capital LLC (TRC) | 20 | 566,67 | 1 | |||||
| 2025-07-25 | 13F | Concurrent Investment Advisors, LLC | 14 478 | 28,19 | 738 | 33,76 | ||||
| 2025-08-06 | 13F | Columbia River Financial Group, LLC | 10 080 | 0,24 | 1 | |||||
| 2025-08-13 | 13F | Oxler Private Wealth LLC | 13 164 | −8,96 | 671 | −5,10 | ||||
| 2025-08-04 | 13F | Amplius Wealth Advisors, LLC | 144 551 | 7 366 | ||||||
| 2025-08-12 | 13F | Proequities, Inc. | 0 | 0 | ||||||
| 2025-08-14 | 13F | Betterment LLC | 9 443 | 9,80 | 0 | |||||
| 2025-08-01 | 13F | Envestnet Asset Management Inc | 113 183 | 3,72 | 5 768 | 8,22 | ||||
| 2025-05-15 | 13F | D. E. Shaw & Co., Inc. | 0 | −100,00 | 0 | |||||
| 2025-07-11 | 13F | Essex Savings Bank | 4 200 | 0,00 | 214 | 3,90 | ||||
| 2025-07-10 | 13F | Moller Financial Services | 18 442 | 0,00 | 940 | 4,33 | ||||
| 2025-08-12 | 13F | Archer Investment Corp | 0 | −100,00 | 0 | |||||
| 2025-08-12 | 13F | Global Retirement Partners, LLC | 24 890 | −90,86 | 1 268 | −91,37 | ||||
| 2025-05-19 | 13F | Heck Capital Advisors, LLC | 0 | −100,00 | 0 | −100,00 | ||||
| 2025-07-15 | 13F | Herbst Group, Llc | 29 806 | −1,97 | 1 519 | 2,22 | ||||
| 2025-08-13 | 13F | Cresset Asset Management, LLC | 7 728 | 0,00 | 394 | 4,24 | ||||
| 2025-08-12 | 13F | Jpmorgan Chase & Co | 44 080 | −15,62 | 2 246 | −11,96 | ||||
| 2025-08-14 | 13F | Ameriprise Financial Inc | 488 696 | −0,15 | 24 909 | 4,44 | ||||
| 2025-07-11 | 13F | Pinnacle Bancorp, Inc. | 0 | −100,00 | 0 | |||||
| 2025-07-25 | 13F | Means Investment Co., Inc. | 12 836 | 0,10 | 654 | 4,47 | ||||
| 2025-07-31 | 13F | Kathleen S. Wright Associates Inc. | 134 700 | −1,71 | 6 864 | 2,57 | ||||
| 2025-08-06 | 13F | Commonwealth Equity Services, Llc | 104 907 | −8,76 | 5 | 0,00 | ||||
| 2025-08-14 | 13F | Blue Capital, Inc. | 0 | −100,00 | 0 | |||||
| 2025-07-30 | 13F | Eqis Capital Management, Inc. | 4 962 | −1,70 | 253 | 2,44 | ||||
| 2025-08-14 | 13F | Fmr Llc | 6 412 | 22,23 | 327 | 27,34 | ||||
| 2025-08-05 | 13F | Claro Advisors LLC | 8 199 | 3,12 | 418 | 7,47 | ||||
| 2025-08-12 | 13F | Nemes Rush Group LLC | 9 215 | −37,70 | 470 | −35,04 | ||||
| 2025-08-13 | 13F | Jones Financial Companies Lllp | 1 144 | 12,27 | 58 | 18,37 | ||||
| 2025-08-14 | 13F | Citadel Advisors Llc | 0 | −100,00 | 0 | |||||
| 2025-08-07 | 13F | Howard Bailey Securities, Llc | 48 781 | −0,52 | 2 486 | 3,76 | ||||
| 2025-08-14 | 13F | CoreCap Advisors, LLC | 2 434 | −0,65 | 124 | 4,20 | ||||
| 2025-08-14 | 13F | Stifel Financial Corp | 46 487 | 6,99 | 2 369 | 11,59 | ||||
| 2025-07-18 | 13F | Institute for Wealth Management, LLC. | 4 290 | 0,00 | 219 | 4,31 | ||||
| 2025-07-24 | 13F | IFP Advisors, Inc | 624 | 0,00 | 32 | 3,33 | ||||
| 2025-08-06 | 13F | Modera Wealth Management, LLC | 6 821 | 0,00 | 348 | 4,20 | ||||
| 2025-08-15 | 13F | Morgan Stanley | 726 470 | −3,13 | 37 021 | 1,07 | ||||
| 2025-08-12 | 13F | O'shaughnessy Asset Management, Llc | 3 417 | 125,10 | 174 | 135,14 | ||||
| 2025-09-04 | 13F/A | Advisor Group Holdings, Inc. | 48 005 | 44,22 | 2 447 | 50,52 | ||||
| 2025-07-25 | 13F | Cwm, Llc | 12 502 | 1,22 | 1 | |||||
| 2025-08-14 | 13F | Warren Averett Asset Management, LLC | 79 765 | 0,00 | 4 065 | 4,34 | ||||
| 2025-08-14 | 13F | Wiley Bros.-aintree Capital, Llc | 34 555 | 0,00 | 1 761 | 4,14 | ||||
| 2025-08-27 | NP | FFOX - FundX Future Fund Opportunities ETF | 1 078 | 55 | ||||||
| 2025-08-14 | 13F | Jane Street Group, Llc | 9 970 | 508 | ||||||
| 2025-08-07 | 13F | Addison Advisors LLC | 225 | 0,00 | 11 | 10,00 | ||||
| 2025-05-08 | 13F | FSA Advisors, Inc. | 0 | −100,00 | 0 | |||||
| 2025-08-14 | 13F | Colony Group, LLC | 3 975 | −37,15 | 203 | −34,42 | ||||
| 2025-05-01 | 13F | Quest 10 Wealth Builders, Inc. | 46 | −50,00 | 2 | −50,00 | ||||
| 2025-08-14 | 13F | Talon Private Wealth, LLC | 168 | 9 | ||||||
| 2025-08-13 | 13F | Beacon Pointe Advisors, LLC | 0 | −100,00 | 0 | |||||
| 2025-08-18 | 13F | Tyler-Stone Wealth Management | 18 197 | 0,12 | 927 | 4,51 | ||||
| 2025-04-29 | 13F | U.S. Capital Wealth Advisors, LLC | 0 | −100,00 | 0 | |||||
| 2025-08-07 | 13F | Parkside Financial Bank & Trust | 0 | −100,00 | 0 | |||||
| 2025-04-25 | 13F | Joel Isaacson & Co., LLC | 0 | −100,00 | 0 | |||||
| 2025-08-19 | 13F | Advisory Services Network, LLC | 5 167 | −2,18 | 266 | 3,50 | ||||
| 2025-05-12 | 13F | First Western Trust Bank | 0 | −100,00 | 0 | |||||
| 2025-08-14 | 13F | Goldman Sachs Group Inc | 15 029 | 0,00 | 766 | 4,22 | ||||
| 2025-05-07 | 13F | Motco | 0 | −100,00 | 0 | |||||
| 2025-08-13 | 13F | Luminist Capital LLC | 7 | 0,00 | 0 | |||||
| 2025-08-13 | 13F | Northwestern Mutual Wealth Management Co | 821 | 22,90 | 42 | 28,13 | ||||
| 2025-08-14 | 13F | Two Sigma Investments, Lp | 45 700 | −43,58 | 2 329 | −41,15 | ||||
| 2025-05-08 | 13F | Wellington Shields Capital Management, LLC | 0 | −100,00 | 0 | −100,00 | ||||
| 2025-08-14 | 13F | Raymond James Financial Inc | 106 755 | −0,52 | 5 440 | 3,80 | ||||
| 2025-08-14 | 13F | Comerica Bank | 2 905 | −20,13 | 148 | −16,38 | ||||
| 2025-08-14 | 13F | Wells Fargo & Company/mn | 124 571 | 73,19 | 6 348 | 80,75 | ||||
| 2025-07-10 | 13F | Envision Financial LLC | 4 632 | 0,00 | 236 | 4,42 | ||||
| 2025-07-28 | 13F | Harbour Investments, Inc. | 3 712 | 11,17 | 189 | 15,95 | ||||
| 2025-07-29 | 13F | Crux Wealth Advisors | 4 988 | −65,58 | 254 | −64,07 | ||||
| 2025-07-07 | 13F | Wilson & Boucher Capital Management, LLC | 5 400 | 0,00 | 275 | 4,56 | ||||
| 2025-08-08 | 13F | Pnc Financial Services Group, Inc. | 1 605 | 0,00 | 82 | 3,85 | ||||
| 2025-08-05 | 13F | Key FInancial Inc | 255 510 | −19,37 | 13 021 | −15,87 | ||||
| 2025-08-06 | 13F | Savant Capital, LLC | 215 894 | −7,90 | 11 002 | −3,90 | ||||
| 2025-08-04 | 13F | Flagship Harbor Advisors, Llc | 14 957 | 1,78 | 762 | 6,28 | ||||
| 2025-08-13 | 13F | Continuum Advisory, LLC | 0 | −100,00 | 0 | |||||
| 2025-08-14 | 13F | Essential Planning, LLC. | 7 803 | 0,01 | 398 | 4,20 | ||||
| 2025-07-02 | 13F | Lvm Capital Management Ltd/mi | 4 326 | −0,69 | 0 | |||||
| 2025-07-28 | 13F | RFG Advisory, LLC | 5 912 | −6,34 | 301 | −2,27 | ||||
| 2025-08-06 | 13F | AE Wealth Management LLC | 2 309 | −5,02 | 118 | −0,85 | ||||
| 2025-07-17 | 13F | New Perspectives, Inc | 25 905 | −16,30 | 1 320 | −12,64 | ||||
| 2025-07-10 | 13F | Exchange Traded Concepts, Llc | 669 | 34 | ||||||
| 2025-08-08 | 13F | Avantax Advisory Services, Inc. | 48 331 | −0,45 | 2 463 | 3,84 | ||||
| 2025-08-04 | 13F | Savvy Advisors, Inc. | 5 908 | 0,03 | 301 | 4,51 |
Other Listings
| MX:EES |