Grunnleggende statistikk
| Institusjonelle eiere | 104 total, 104 long only, 0 short only, 0 long/short - change of −4,55% MRQ |
| Gjennomsnittlig porteføljeallokering | 0.0184 % - change of −6,75% MRQ |
| Institusjonelle aksjer (Long) | 1 232 962 (ex 13D/G) - change of −0,24MM shares −16,40% MRQ |
| Institusjonell verdi (Long) | $ 29 831 USD ($1000) |
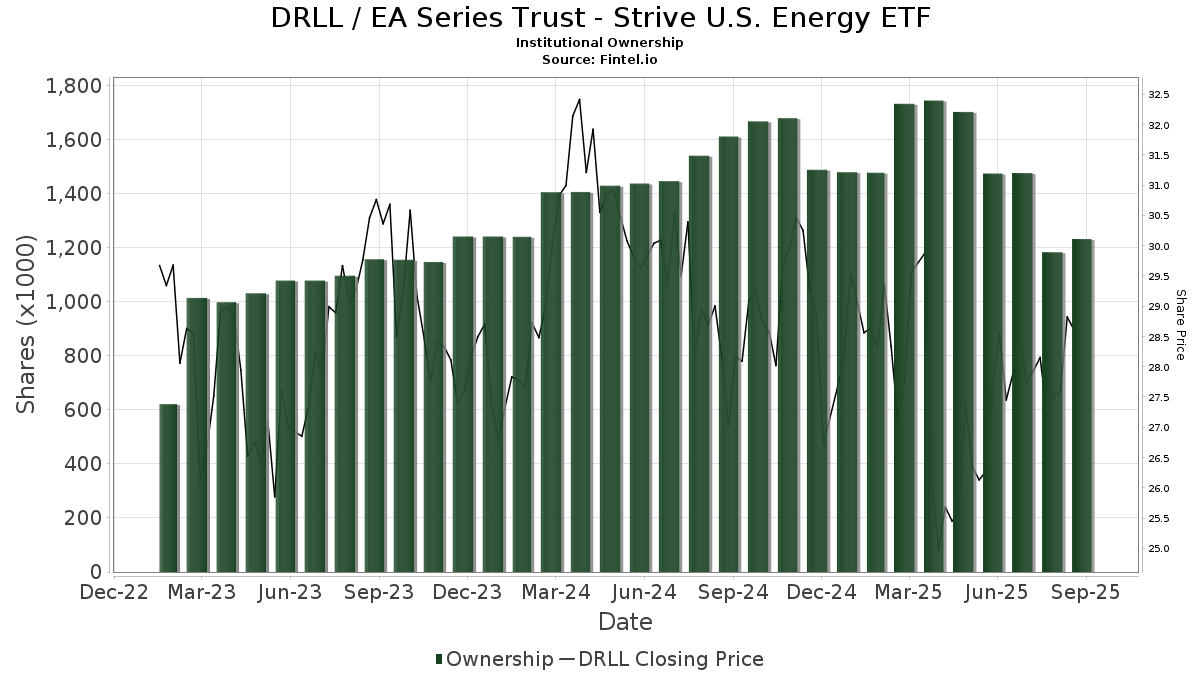
Institusjonelt eierskap og aksjonærer
EA Series Trust - Strive U.S. Energy ETF (US:DRLL) har 104 institusjonelle eiere og aksjonærer som har sendt inn 13D/G- eller 13F-skjemaer til Securities Exchange Commission (SEC). Disse institusjonene eier til sammen 1,232,962 aksjer. De største aksjonærene inkluderer Raymond James Financial Inc, LPL Financial LLC, Gts Securities Llc, Susquehanna International Group, Llp, Financial Management Network Inc, Cambridge Investment Research Advisors, Inc., Stifel Financial Corp, UBS Group AG, Bank Of America Corp /de/, and Visionary Wealth Advisors .
EA Series Trust - Strive U.S. Energy ETF (NYSE:DRLL) institusjonell eierstruktur viser nåværende posisjoner i selskapet fordelt på institusjoner og fond, samt de siste endringene i posisjonsstørrelse. De største aksjonærene kan være individuelle investorer, verdipapirfond, hedgefond eller institusjoner. Schedule 13D indikerer at investoren eier (eller har eid) mer enn 5 % av selskapet og har til hensikt (eller hadde til hensikt) å aktivt forfølge en endring i forretningsstrategien. Schedule 13G indikerer en passiv investering på over 5 %.
The share price as of September 12, 2025 is 28,57 / share. Previously, on September 13, 2024, the share price was 27,36 / share. This represents an increase of 4,42% over that period.
Fondssentiment-score
Fondssentiment Score (også kjent som akkumulering av eierskap poengsum) viser hvilke aksjer som er mest kjøpt av fond. Den er resultatet av en sofistikert, kvantitativ flerfaktormodell som identifiserer selskaper med de høyeste nivåene av institusjonell akkumulering. Beregningsmodellen for poeng bruker en kombinasjon av den totale økningen i antall offentliggjorte eiere, endringer i porteføljeallokeringen til disse eierne og andre beregninger. Tallet går fra 0 til 100, der høyere tall indikerer en høyere grad av akkumulering i forhold til sammenlignbare selskaper, der 50 er gjennomsnittet.
Oppdateringsfrekvens: Daglig
Sjekk ut Ownership Explorer, som inneholder en liste over de høyest rangerte selskapene.
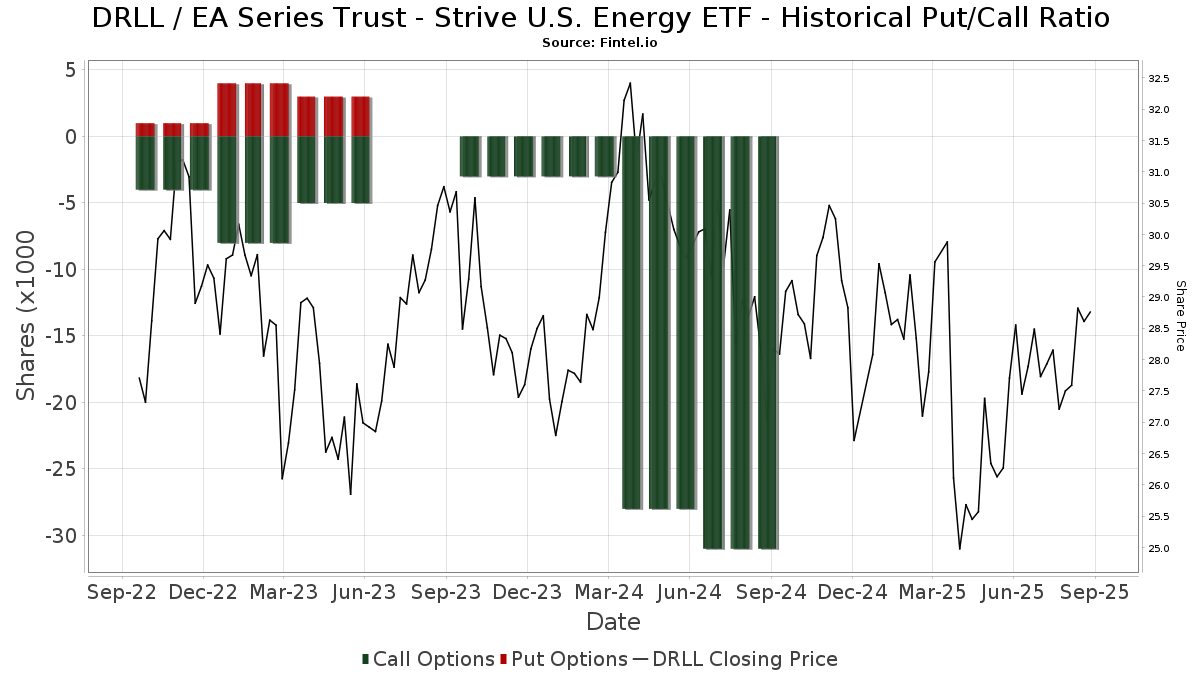
Institusjonell Put/Call-forhold
I tillegg til å rapportere standard aksje- og gjeldsemisjoner må institusjoner med mer enn 100 millioner kroner i forvaltningskapital også oppgi beholdningen av put- og callopsjoner. Siden put-opsjoner generelt indikerer et negativt sentiment, og call-opsjoner indikerer et positivt sentiment, kan vi få et inntrykk av det generelle institusjonelle sentimentet ved å plotte forholdet mellom put- og call-opsjoner. Diagrammet til høyre viser det historiske forholdet mellom put- og call-opsjoner for dette instrumentet.
Ved å bruke Put/Call-forholdet som en indikator på investorsentimentet kan man overvinne en av de viktigste svakhetene ved å bruke totalt institusjonelt eierskap, nemlig at en betydelig andel av forvaltningskapitalen investeres passivt for å følge indekser. Passivt forvaltede fond kjøper vanligvis ikke opsjoner, slik at indikatoren for put/call-forhold i større grad gjenspeiler stemningen i aktivt forvaltede fond.
13F- og NPORT-arkiveringer
Detaljer om 13F-arkiveringer er gratis. Detaljer om NP-arkiveringer krever et premium-medlemskap. Grønne rader indikerer nye posisjoner. Røde rader indikerer lukkede posisjoner. Klikk på lenke ikonet for å se hele transaksjonshistorikken.
Oppgrader
for å låse opp premiedata og eksportere til Excel. ![]() .
.
| Fildato | Kilde | Investor | Type | Gjennomsnittlig pris (estimert) |
Aksjer | Δ Aksjer (%) |
Rapportert verdi ($1000) | Verdi (%) | Portallokering (%) | |
|---|---|---|---|---|---|---|---|---|---|---|
| 2025-08-11 | 13F | Strategic Wealth Partners, Ltd. | 32 | 1 | ||||||
| 2025-07-17 | 13F | HB Wealth Management, LLC | 0 | −100,00 | 0 | −100,00 | ||||
| 2025-08-14 | 13F | Susquehanna International Group, Llp | 65 911 | 69,20 | 1 789 | 54,67 | ||||
| 2025-08-11 | 13F | Greykasell Wealth Strategies, Inc. | 0 | −100,00 | 0 | |||||
| 2025-04-16 | 13F | Wealth Enhancement Advisory Services, Llc | 0 | −100,00 | 0 | |||||
| 2025-07-16 | 13F | Signaturefd, Llc | 1 130 | 0,71 | 31 | −9,09 | ||||
| 2025-08-14 | 13F | Wells Fargo & Company/mn | 101 | 4 950,00 | 3 | |||||
| 2025-07-24 | 13F | Us Bancorp \de\ | 39 040 | 0,00 | 1 060 | −8,63 | ||||
| 2025-07-07 | 13F | Versant Capital Management, Inc | 310 | 8 | ||||||
| 2025-07-10 | 13F | Oliver Lagore Vanvalin Investment Group | 345 | 1,47 | 10 | 11,11 | ||||
| 2025-08-12 | 13F | WealthTrak Capital Management LLC | 2 004 | 0,00 | 54 | −8,47 | ||||
| 2025-08-18 | 13F | Hollencrest Capital Management | 375 | 0,00 | 10 | −9,09 | ||||
| 2025-08-13 | 13F | Jones Financial Companies Lllp | 23 661 | 13,23 | 647 | 5,21 | ||||
| 2025-07-16 | 13F | ORG Partners LLC | 200 | 0,00 | 5 | 0,00 | ||||
| 2025-07-10 | 13F | Financial Management Network Inc | 60 710 | −7,90 | 1 701 | 4,10 | ||||
| 2025-07-28 | 13F | Harbour Investments, Inc. | 8 534 | 50,72 | 232 | 37,50 | ||||
| 2025-05-12 | 13F | Richard W. Paul & Associates, LLC | 0 | −100,00 | 0 | −100,00 | ||||
| 2025-07-14 | 13F | Whitener Capital Management, Inc. | 9 320 | 10,17 | 253 | 0,40 | ||||
| 2025-08-14 | 13F | Fmr Llc | 163 | −43,99 | 4 | −50,00 | ||||
| 2025-08-14 | 13F | EP Wealth Advisors, Inc. | 19 251 | 0,89 | 522 | −7,77 | ||||
| 2025-08-14 | 13F | Raymond James Financial Inc | 89 205 | 2,10 | 2 421 | −6,67 | ||||
| 2025-08-04 | 13F | IFG Advisory, LLC | 19 708 | 15,58 | 535 | 5,53 | ||||
| 2025-07-08 | 13F | Parallel Advisors, LLC | 725 | −40,82 | 20 | −47,22 | ||||
| 2025-08-14 | 13F | Visionary Wealth Advisors | 43 172 | −47,08 | 1 172 | −51,65 | ||||
| 2025-08-08 | 13F | Comprehensive Financial Planning, Inc./PA | 0 | −100,00 | 0 | |||||
| 2025-07-11 | 13F | Farther Finance Advisors, LLC | 600 | 16 | ||||||
| 2025-07-22 | 13F | Rocky Mountain Advisers, Llc | 334 | 0,00 | 9 | 0,00 | ||||
| 2025-08-08 | 13F | Capital Investment Advisory Services, LLC | 2 153 | 0,00 | 58 | −7,94 | ||||
| 2025-05-13 | 13F | Bank Of Montreal /can/ | 0 | −100,00 | 0 | |||||
| 2025-08-14 | 13F | Bank Of America Corp /de/ | 43 542 | 5,43 | 1 182 | −3,67 | ||||
| 2025-08-14 | 13F | UBS Group AG | 52 578 | 33,82 | 1 427 | 22,30 | ||||
| 2025-08-12 | 13F | Global Retirement Partners, LLC | 260 | 2 500,00 | 7 | |||||
| 2025-08-13 | 13F | StoneX Group Inc. | 22 040 | 8,38 | 600 | −0,66 | ||||
| 2025-08-13 | 13F | Transce3nd, LLC | 25 | 212,50 | 1 | |||||
| 2025-04-17 | 13F | Highline Wealth Partners Llc | 0 | −100,00 | 0 | −100,00 | ||||
| 2025-08-12 | 13F | Howe & Rusling Inc | 1 875 | 0,00 | 51 | −9,09 | ||||
| 2025-07-17 | 13F | Sound Income Strategies, LLC | 35 | 0,00 | 1 | −100,00 | ||||
| 2025-08-13 | 13F | Capital Analysts, Inc. | 91 | 0,00 | 0 | |||||
| 2025-05-16 | 13F | Coppell Advisory Solutions LLC | 0 | −100,00 | 0 | |||||
| 2025-05-09 | 13F | Delta Asset Management Llc/tn | 0 | −100,00 | 0 | |||||
| 2025-07-16 | 13F/A | CX Institutional | 153 | 0,00 | 0 | |||||
| 2025-07-28 | 13F | Mowery & Schoenfeld Wealth Management, LLC | 9 | 0,00 | 0 | |||||
| 2025-07-08 | 13F/A | Salem Investment Counselors Inc | 200 | 0,00 | 5 | 0,00 | ||||
| 2025-08-12 | 13F | Winnow Wealth Llc | 0 | −100,00 | 0 | −100,00 | ||||
| 2025-07-25 | 13F | Concurrent Investment Advisors, LLC | 10 671 | −8,71 | 290 | −16,71 | ||||
| 2025-07-23 | 13F | Heck Capital Advisors, LLC | 0 | −100,00 | 0 | |||||
| 2025-08-12 | 13F | CIBC Private Wealth Group, LLC | 14 133 | 0,00 | 384 | 12,65 | ||||
| 2025-05-09 | 13F | Pathway Financial Advisers, LLC | 0 | −100,00 | 0 | |||||
| 2025-07-30 | 13F | Demars Financial Group, LLC | 8 355 | −95,93 | 227 | 3 666,67 | ||||
| 2025-08-13 | 13F | Flow Traders U.s. Llc | 29 931 | 1 | ||||||
| 2025-04-29 | 13F | Lee Danner & Bass Inc | 0 | −100,00 | 0 | |||||
| 2025-07-07 | 13F | Trust Co | 355 | 0,00 | 10 | −10,00 | ||||
| 2025-08-07 | 13F | McClarren Financial Advisors, Inc. | 0 | −100,00 | 0 | |||||
| 2025-08-14 | 13F | GWM Advisors LLC | 34 | 0,00 | 1 | −100,00 | ||||
| 2025-07-23 | 13F | Indiana Trust & Investment Management CO | 1 140 | −60,07 | 31 | −64,29 | ||||
| 2025-08-14 | 13F | Mariner, LLC | 15 374 | 0,25 | 417 | −8,35 | ||||
| 2025-05-01 | 13F | WESPAC Advisors, LLC | 0 | −100,00 | 0 | |||||
| 2025-07-24 | 13F | IFP Advisors, Inc | 2 039 | 2,93 | 55 | −5,17 | ||||
| 2025-08-14 | 13F | McIlrath & Eck, LLC | 31 279 | 16,60 | 849 | 6,53 | ||||
| 2025-08-15 | 13F | Kestra Advisory Services, LLC | 17 014 | 28,12 | 462 | 17,01 | ||||
| 2025-08-14 | 13F | Goldman Sachs Group Inc | 9 739 | −30,72 | 264 | −36,69 | ||||
| 2025-07-21 | 13F | Ameritas Advisory Services, LLC | 941 | 26 | ||||||
| 2025-08-14 | 13F | Stifel Financial Corp | 52 991 | −12,96 | 1 438 | −20,46 | ||||
| 2025-08-29 | 13F | Total Investment Management Inc | 370 | 10 | ||||||
| 2025-08-12 | 13F | MAI Capital Management | 1 619 | 0,25 | 44 | −8,51 | ||||
| 2025-08-04 | 13F | Creative Financial Designs Inc /adv | 861 | 0,58 | 23 | −8,00 | ||||
| 2025-08-08 | 13F | Pnc Financial Services Group, Inc. | 0 | −100,00 | 0 | −100,00 | ||||
| 2025-07-15 | 13F | Fifth Third Bancorp | 816 | 0,00 | 22 | −8,33 | ||||
| 2025-07-29 | 13F | Tradewinds Capital Management, LLC | 54 | 0,00 | 1 | 0,00 | ||||
| 2025-08-14 | 13F | Harwood Advisory Group, LLC | 208 | 0,00 | 6 | 0,00 | ||||
| 2025-07-10 | 13F | Family Legacy Financial Solutions, LLC | 1 021 | 28 | ||||||
| 2025-07-23 | 13F | RMG Wealth Management LLC | 98 | 3 | ||||||
| 2025-08-12 | 13F | Nemes Rush Group LLC | 0 | −100,00 | 0 | |||||
| 2025-04-17 | 13F | Copia Wealth Management | 0 | −100,00 | 0 | |||||
| 2025-08-11 | 13F | Principal Securities, Inc. | 2 821 | 3,37 | 77 | 2,70 | ||||
| 2025-07-24 | 13F | JNBA Financial Advisors | 172 | 0,00 | 5 | −20,00 | ||||
| 2025-08-19 | 13F | Anchor Investment Management, LLC | 1 100 | 0,00 | 30 | −9,37 | ||||
| 2025-05-15 | 13F | Old Mission Capital Llc | 0 | −100,00 | 0 | −100,00 | ||||
| 2025-07-28 | 13F | Duncker Streett & Co Inc | 500 | 0,00 | 14 | −7,14 | ||||
| 2025-08-14 | 13F | Mml Investors Services, Llc | 12 101 | −4,76 | 0 | |||||
| 2025-08-08 | 13F | Avantax Advisory Services, Inc. | 29 291 | −1,63 | 795 | −10,18 | ||||
| 2025-08-15 | 13F | Morgan Stanley | 2 281 | −36,52 | 62 | −42,45 | ||||
| 2025-07-24 | 13F | Ronald Blue Trust, Inc. | 541 | 0,00 | 15 | −12,50 | ||||
| 2025-08-07 | 13F | Allworth Financial LP | 1 038 | 4,43 | 28 | 12,00 | ||||
| 2025-07-10 | 13F | Pacific Asset Management, LLC | 8 247 | 0,82 | 224 | −7,85 | ||||
| 2025-08-04 | 13F | Spire Wealth Management | 825 | −26,67 | 22 | −33,33 | ||||
| 2025-07-17 | 13F | Beacon Capital Management, LLC | 940 | 0,00 | 26 | −7,41 | ||||
| 2025-07-18 | 13F | Vigilare Wealth Management | 13 470 | 0,31 | 366 | −8,29 | ||||
| 2025-07-29 | 13F | Woodard & Co Asset Management Group Inc /adv | 1 000 | 0,00 | 27 | −6,90 | ||||
| 2025-07-14 | 13F | AdvisorNet Financial, Inc | 154 | −89,69 | 4 | −90,91 | ||||
| 2025-07-07 | 13F | Nova Wealth Management, Inc. | 100 | 0,00 | 3 | 0,00 | ||||
| 2025-08-04 | 13F | Covey Capital Advisors, LLC | 10 000 | 0,00 | 271 | −8,75 | ||||
| 2025-08-12 | 13F | Steward Partners Investment Advisory, Llc | 6 384 | −12,26 | 173 | −19,91 | ||||
| 2025-07-08 | 13F | Nbc Securities, Inc. | 519 | 0,00 | 0 | |||||
| 2025-07-28 | 13F | Holistic Planning, LLC | 21 714 | 0,14 | 589 | −8,54 | ||||
| 2025-08-08 | 13F | Gts Securities Llc | 68 431 | 228,68 | 1 857 | 200,49 | ||||
| 2025-07-25 | 13F | Cwm, Llc | 3 940 | 0,00 | 0 | |||||
| 2025-07-31 | 13F | Cambridge Investment Research Advisors, Inc. | 55 426 | −42,39 | 2 | −50,00 | ||||
| 2025-08-15 | 13F | Captrust Financial Advisors | 0 | −100,00 | 0 | |||||
| 2025-07-30 | 13F | Gables Capital Management Inc. | 5 960 | 53,41 | 162 | 40,00 | ||||
| 2025-08-13 | 13F | Continuum Advisory, LLC | 0 | −100,00 | 0 | |||||
| 2025-08-15 | 13F | Semmax Financial Advisors Inc. | 81 | 1,25 | 2 | 0,00 | ||||
| 2025-04-22 | 13F | Castleview Partners, Llc | 0 | −100,00 | 0 | |||||
| 2025-08-12 | 13F | Jpmorgan Chase & Co | 0 | −100,00 | 0 | |||||
| 2025-08-18 | 13F | Tactive Advisors, LLC | 0 | −100,00 | 0 | |||||
| 2025-09-04 | 13F/A | Advisor Group Holdings, Inc. | 29 883 | −5,76 | 811 | −13,82 | ||||
| 2025-07-10 | 13F | Farmers & Merchants Trust Co of Chambersburg PA | 100 | 0,00 | 0 | |||||
| 2025-08-14 | 13F | CoreCap Advisors, LLC | 677 | 0,00 | 18 | −10,00 | ||||
| 2025-08-18 | 13F | Geneos Wealth Management Inc. | 14 474 | 69,74 | 393 | 54,94 | ||||
| 2025-07-15 | 13F | Mather Group, Llc. | 0 | −100,00 | 0 | |||||
| 2025-05-14 | 13F | Northwestern Mutual Wealth Management Co | 0 | −100,00 | 0 | |||||
| 2025-08-06 | 13F | Commonwealth Equity Services, Llc | 31 725 | −12,30 | 1 | −100,00 | ||||
| 2025-07-31 | 13F | Oppenheimer & Co Inc | 0 | −100,00 | 0 | |||||
| 2025-08-08 | 13F | Cetera Investment Advisers | 29 783 | 1,46 | 808 | −7,23 | ||||
| 2025-07-30 | 13F | Brookstone Capital Management | 0 | −100,00 | 0 | |||||
| 2025-08-14 | 13F | Sunbelt Securities, Inc. | 506 | 0,00 | 14 | −13,33 | ||||
| 2025-08-01 | 13F | Envestnet Asset Management Inc | 14 861 | −28,88 | 403 | −35,00 | ||||
| 2025-04-21 | 13F | Nelson, Van Denburg & Campbell Wealth Management Group, LLC | 0 | −100,00 | 0 | |||||
| 2025-08-12 | 13F | Proequities, Inc. | 0 | 0 | ||||||
| 2025-07-23 | 13F | Friedenthal Financial | 0 | −100,00 | 0 | |||||
| 2025-08-14 | 13F | Heritage Wealth Management, Inc. | 11 504 | 312 | ||||||
| 2025-07-23 | 13F | Godsey & Gibb Associates | 410 | 0,00 | 11 | −8,33 | ||||
| 2025-07-25 | 13F | Atria Wealth Solutions, Inc. | 9 341 | 0,00 | 262 | −5,78 | ||||
| 2025-05-14 | 13F | Jane Street Group, Llc | 0 | −100,00 | 0 | |||||
| 2025-07-07 | 13F | Horizons Wealth Management | 19 | 0,00 | 1 | |||||
| 2025-05-14 | 13F | Change Path, LLC | 0 | −100,00 | 0 | |||||
| 2025-08-14 | 13F | Royal Bank Of Canada | 27 447 | −42,46 | 745 | −47,39 | ||||
| 2025-08-08 | 13F | WASHINGTON TRUST Co | 0 | −100,00 | 0 | |||||
| 2025-08-11 | 13F | Aptus Capital Advisors, LLC | 1 893 | 0,00 | 51 | −8,93 | ||||
| 2025-04-10 | 13F | Park Edge Advisors, LLC | 0 | −100,00 | 0 | |||||
| 2025-05-15 | 13F | Two Sigma Securities, Llc | 0 | −100,00 | 0 | |||||
| 2025-08-05 | 13F | Simplex Trading, Llc | 557 | 0 | ||||||
| 2025-08-07 | 13F | King Luther Capital Management Corp | 258 | −8,87 | ||||||
| 2025-07-08 | 13F | Advance Capital Management, Inc. | 0 | −100,00 | 0 | |||||
| 2025-07-16 | 13F | Brown, Lisle/cummings, Inc. | 100 | 0,00 | 3 | 0,00 | ||||
| 2025-07-25 | 13F | Stephens Consulting, LLC | 957 | 0,00 | 26 | −10,71 | ||||
| 2025-07-28 | 13F | Kiker Wealth Management, LLC | 2 810 | 462,00 | 76 | 442,86 | ||||
| 2025-08-12 | 13F | LPL Financial LLC | 86 056 | −2,45 | 2 336 | −10,88 | ||||
| 2025-08-06 | 13F | AE Wealth Management LLC | 4 084 | 20,58 | 111 | 10,00 | ||||
| 2025-07-17 | 13F | Global Trust Asset Management, LLC | 500 | 0,00 | 14 | −7,14 | ||||
| 2025-04-18 | 13F | Pacific Capital Wealth Advisors, Inc | 0 | −100,00 | 0 | −100,00 | ||||
| 2025-08-11 | 13F | HighTower Advisors, LLC | 11 014 | 4,30 | 299 | −4,79 | ||||
| 2025-07-16 | 13F | Evergreen Private Wealth LLC | 390 | 0,00 | 11 | −9,09 |