Grunnleggende statistikk
| Institusjonelle eiere | 122 total, 122 long only, 0 short only, 0 long/short - change of 2,48% MRQ |
| Gjennomsnittlig porteføljeallokering | 0.0618 % - change of −15,38% MRQ |
| Institusjonelle aksjer (Long) | 10 226 244 (ex 13D/G) - change of 0,83MM shares 8,86% MRQ |
| Institusjonell verdi (Long) | $ 172 870 USD ($1000) |
Institusjonelt eierskap og aksjonærer
Global X Funds - Global X SuperDividend U.S. ETF (US:DIV) har 122 institusjonelle eiere og aksjonærer som har sendt inn 13D/G- eller 13F-skjemaer til Securities Exchange Commission (SEC). Disse institusjonene eier til sammen 10,226,244 aksjer. De største aksjonærene inkluderer FUKOKU MUTUAL LIFE INSURANCE Co, Morgan Stanley, AE Wealth Management LLC, LPL Financial LLC, Wells Fargo & Company/mn, Bank Of America Corp /de/, Global X Japan Co., Ltd., Wealthfront Advisers Llc, Northwestern Mutual Wealth Management Co, and Commonwealth Equity Services, Llc .
Global X Funds - Global X SuperDividend U.S. ETF (ARCA:DIV) institusjonell eierstruktur viser nåværende posisjoner i selskapet fordelt på institusjoner og fond, samt de siste endringene i posisjonsstørrelse. De største aksjonærene kan være individuelle investorer, verdipapirfond, hedgefond eller institusjoner. Schedule 13D indikerer at investoren eier (eller har eid) mer enn 5 % av selskapet og har til hensikt (eller hadde til hensikt) å aktivt forfølge en endring i forretningsstrategien. Schedule 13G indikerer en passiv investering på over 5 %.
The share price as of September 10, 2025 is 17,62 / share. Previously, on September 11, 2024, the share price was 18,18 / share. This represents a decline of 3,05% over that period.

Fondssentiment-score
Fondssentiment Score (også kjent som akkumulering av eierskap poengsum) viser hvilke aksjer som er mest kjøpt av fond. Den er resultatet av en sofistikert, kvantitativ flerfaktormodell som identifiserer selskaper med de høyeste nivåene av institusjonell akkumulering. Beregningsmodellen for poeng bruker en kombinasjon av den totale økningen i antall offentliggjorte eiere, endringer i porteføljeallokeringen til disse eierne og andre beregninger. Tallet går fra 0 til 100, der høyere tall indikerer en høyere grad av akkumulering i forhold til sammenlignbare selskaper, der 50 er gjennomsnittet.
Oppdateringsfrekvens: Daglig
Sjekk ut Ownership Explorer, som inneholder en liste over de høyest rangerte selskapene.
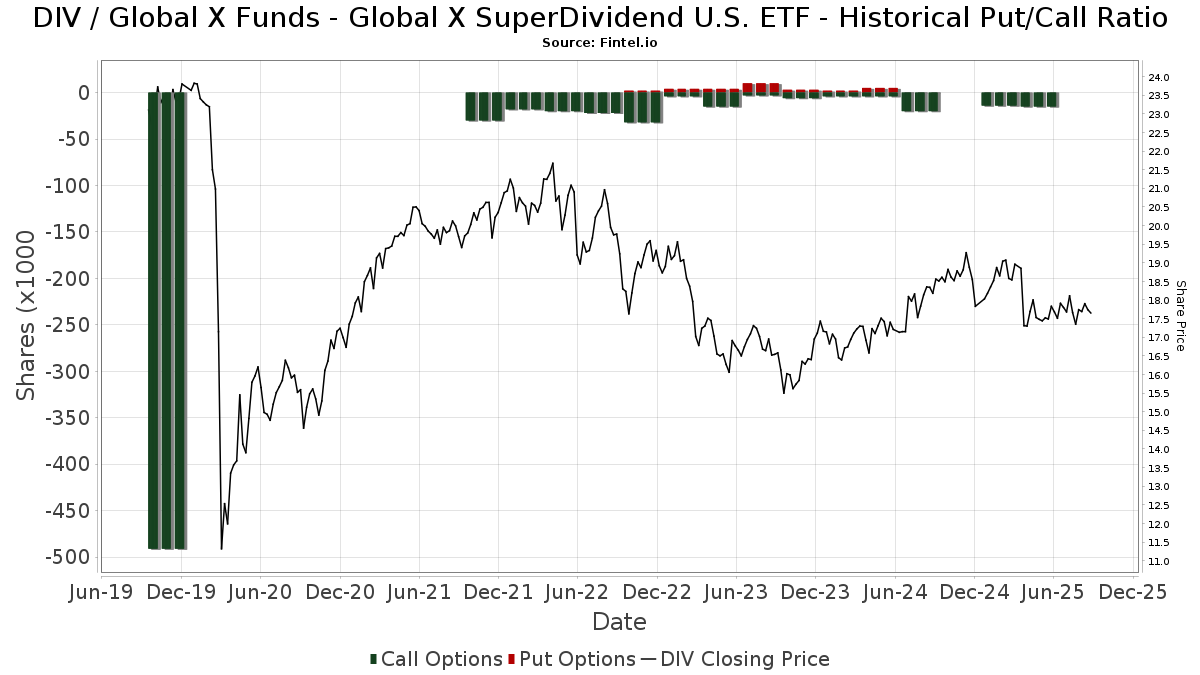
Institusjonell Put/Call-forhold
I tillegg til å rapportere standard aksje- og gjeldsemisjoner må institusjoner med mer enn 100 millioner kroner i forvaltningskapital også oppgi beholdningen av put- og callopsjoner. Siden put-opsjoner generelt indikerer et negativt sentiment, og call-opsjoner indikerer et positivt sentiment, kan vi få et inntrykk av det generelle institusjonelle sentimentet ved å plotte forholdet mellom put- og call-opsjoner. Diagrammet til høyre viser det historiske forholdet mellom put- og call-opsjoner for dette instrumentet.
Ved å bruke Put/Call-forholdet som en indikator på investorsentimentet kan man overvinne en av de viktigste svakhetene ved å bruke totalt institusjonelt eierskap, nemlig at en betydelig andel av forvaltningskapitalen investeres passivt for å følge indekser. Passivt forvaltede fond kjøper vanligvis ikke opsjoner, slik at indikatoren for put/call-forhold i større grad gjenspeiler stemningen i aktivt forvaltede fond.
13F- og NPORT-arkiveringer
Detaljer om 13F-arkiveringer er gratis. Detaljer om NP-arkiveringer krever et premium-medlemskap. Grønne rader indikerer nye posisjoner. Røde rader indikerer lukkede posisjoner. Klikk på lenke ikonet for å se hele transaksjonshistorikken.
Oppgrader
for å låse opp premiedata og eksportere til Excel. ![]() .
.
| Fildato | Kilde | Investor | Type | Gjennomsnittlig pris (estimert) |
Aksjer | Δ Aksjer (%) |
Rapportert verdi ($1000) | Verdi (%) | Portallokering (%) | |
|---|---|---|---|---|---|---|---|---|---|---|
| 2025-08-08 | 13F | Creative Planning | 16 065 | −2,44 | 282 | −9,03 | ||||
| 2025-07-21 | 13F | Curran Financial Partners, LLC | 121 947 | −65,16 | 2 144 | −67,50 | ||||
| 2025-07-21 | 13F | Crews Bank & Trust | 7 305 | 0,00 | 128 | −6,57 | ||||
| 2025-08-14 | 13F | UBS Group AG | 40 512 | 14,95 | 712 | 7,39 | ||||
| 2025-08-11 | 13F | Private Advisor Group, LLC | 11 608 | 4,48 | 204 | −2,39 | ||||
| 2025-08-14 | 13F | Qube Research & Technologies Ltd | 303 | 10 000,00 | 5 | |||||
| 2025-07-18 | 13F | PFG Investments, LLC | 11 189 | −22,42 | 197 | −27,68 | ||||
| 2025-07-17 | 13F | Janney Montgomery Scott LLC | 35 832 | −3,84 | 1 | |||||
| 2025-07-11 | 13F | Caldwell Securities, Inc | 100 | 0,00 | 2 | 0,00 | ||||
| 2025-07-18 | 13F | Truist Financial Corp | 19 724 | −0,48 | 347 | −7,24 | ||||
| 2025-08-12 | 13F | Jpmorgan Chase & Co | 42 154 | −3,40 | 741 | −9,85 | ||||
| 2025-07-17 | 13F | C2C Wealth Management, LLC | 19 000 | 0,00 | 334 | −6,44 | ||||
| 2025-08-14 | 13F | Two Sigma Investments, Lp | 121 300 | 98,85 | 2 132 | 85,55 | ||||
| 2025-07-25 | 13F | Cwm, Llc | 16 119 | 0,00 | 0 | |||||
| 2025-08-05 | 13F | GPS Wealth Strategies Group, LLC | 4 639 | 366,23 | 82 | 350,00 | ||||
| 2025-04-30 | 13F | Slagle Financial, LLC | 0 | −100,00 | 0 | −100,00 | ||||
| 2025-04-29 | 13F | Wood Tarver Financial Group, LLC | 0 | −100,00 | 0 | |||||
| 2025-07-31 | 13F | Wealthfront Advisers Llc | 304 537 | 5,08 | 5 354 | −1,96 | ||||
| 2025-07-31 | 13F | Cambridge Investment Research Advisors, Inc. | 92 713 | −0,44 | 2 | 0,00 | ||||
| 2025-07-21 | 13F | Ntv Asset Management Llc | 24 725 | −7,48 | 435 | −13,72 | ||||
| 2025-07-21 | 13F | Ameritas Advisory Services, LLC | 2 049 | 36 | ||||||
| 2025-08-14 | 13F | Goldman Sachs Group Inc | 84 097 | −0,04 | 1 478 | −6,69 | ||||
| 2025-07-28 | 13F | Mutual Advisors, LLC | 36 840 | 23,36 | 657 | 22,80 | ||||
| 2025-08-08 | 13F | Advyzon Investment Management, LLC | 25 402 | 18,47 | 447 | 10,67 | ||||
| 2025-07-14 | 13F | AdvisorNet Financial, Inc | 646 | 0,00 | 11 | −8,33 | ||||
| 2025-08-14 | 13F | Royal Bank Of Canada | 145 222 | 22,80 | 2 553 | 14,59 | ||||
| 2025-08-06 | 13F | AE Wealth Management LLC | 999 605 | 7,93 | 17 573 | 0,71 | ||||
| 2025-08-12 | 13F | Founders Financial Alliance, LLC | 11 258 | 3,44 | 198 | −3,90 | ||||
| 2025-08-07 | 13F | Kestra Private Wealth Services, Llc | 21 415 | 24,33 | 376 | 16,05 | ||||
| 2025-07-18 | 13F | Chelsea Counsel Co | 5 350 | 46,58 | 94 | 38,24 | ||||
| 2025-07-21 | 13F | Ameriflex Group, Inc. | 367 | 0,00 | 6 | 0,00 | ||||
| 2025-08-14 | 13F | Citadel Advisors Llc | Put | 0 | −100,00 | 0 | ||||
| 2025-08-08 | 13F | Wiser Advisor Group LLC | 0 | −100,00 | 0 | |||||
| 2025-07-25 | 13F | Atria Wealth Solutions, Inc. | 0 | −100,00 | 0 | |||||
| 2025-08-04 | 13F | Creekmur Asset Management LLC | 0 | 0 | ||||||
| 2025-08-04 | 13F | Joseph P. Lucia & Associates, LLC | 15 610 | −11,21 | 274 | −17,22 | ||||
| 2025-08-12 | 13F | Park Square Financial Group, LLC | 11 068 | 4,11 | 195 | −3,00 | ||||
| 2025-08-19 | 13F | Newbridge Financial Services Group, Inc. | 1 800 | −28,57 | 32 | −34,04 | ||||
| 2025-07-24 | 13F | IFP Advisors, Inc | 4 300 | −7,27 | 76 | −13,79 | ||||
| 2025-07-30 | 13F | Patten Group, Inc. | 15 625 | 0,00 | 275 | −6,80 | ||||
| 2025-08-06 | 13F | Commonwealth Equity Services, Llc | 191 027 | 2,42 | 3 | 0,00 | ||||
| 2025-08-12 | 13F | Global Retirement Partners, LLC | 28 963 | 1,18 | 509 | −1,36 | ||||
| 2025-07-11 | 13F | Global X Japan Co., Ltd. | 424 451 | 22,92 | 7 462 | 14,70 | ||||
| 2025-08-13 | 13F | SMART Wealth LLC | 163 275 | 17,84 | 2 870 | 9,96 | ||||
| 2025-08-14 | 13F | Harwood Advisory Group, LLC | 1 | 0,00 | 0 | |||||
| 2025-07-16 | 13F | Perigon Wealth Management, LLC | 10 005 | 0,00 | 176 | −6,91 | ||||
| 2025-08-12 | 13F | BlackRock, Inc. | 188 | 2,17 | 3 | 0,00 | ||||
| 2025-07-28 | 13F | RFG Advisory, LLC | 21 149 | 0,16 | 372 | −6,55 | ||||
| 2025-08-11 | 13F | Pineridge Advisors LLC | 1 819 | 0,55 | 32 | −8,82 | ||||
| 2025-08-14 | 13F | Bank Of America Corp /de/ | 704 289 | −18,33 | 12 381 | −23,80 | ||||
| 2025-08-12 | 13F | FUKOKU MUTUAL LIFE INSURANCE Co | 1 873 000 | 26,98 | 32 927 | 18,49 | ||||
| 2025-07-09 | 13F | Triumph Capital Management | 29 515 | −0,05 | 519 | −6,83 | ||||
| 2025-08-04 | 13F | Daymark Wealth Partners, Llc | 10 789 | 0,00 | 190 | −6,90 | ||||
| 2025-08-08 | 13F | Kingsview Wealth Management, LLC | 36 417 | 10,67 | 640 | 3,39 | ||||
| 2025-08-08 | 13F | Cetera Investment Advisers | 77 466 | 12,92 | 1 362 | 5,34 | ||||
| 2025-08-14 | 13F | Sequent Planning LLC | 13 047 | 229 | ||||||
| 2025-08-12 | 13F | Proequities, Inc. | 0 | 0 | ||||||
| 2025-08-06 | 13F | Walkner Condon Financial Advisors LLC | 16 650 | 0,75 | 293 | −6,11 | ||||
| 2025-08-13 | 13F | Colonial Trust Advisors | 500 | 0,00 | 9 | −11,11 | ||||
| 2025-07-29 | 13F | Stratos Wealth Partners, LTD. | 68 423 | 2,61 | 1 203 | −4,30 | ||||
| 2025-08-14 | 13F | Stifel Financial Corp | 15 150 | −3,73 | 266 | −10,14 | ||||
| 2025-07-24 | 13F | Blair William & Co/il | 1 005 | 18 | ||||||
| 2025-05-01 | 13F | Quest 10 Wealth Builders, Inc. | 22 040 | −2,18 | 415 | 2,22 | ||||
| 2025-07-15 | 13F | FLP Wealth Management, LLC | 0 | −100,00 | 0 | |||||
| 2025-08-04 | 13F | Assetmark, Inc | 5 | 0,00 | 0 | |||||
| 2025-08-08 | 13F | SBI Securities Co., Ltd. | 7 206 | 8,46 | 127 | 0,80 | ||||
| 2025-08-08 | 13F | Fortis Group Advisors, LLC | 300 | 0,00 | 5 | 0,00 | ||||
| 2025-07-24 | 13F | Us Bancorp \de\ | 5 320 | 0,00 | 94 | −7,00 | ||||
| 2025-08-15 | 13F | Tower Research Capital LLC (TRC) | 47 | 1 | ||||||
| 2025-07-21 | 13F | Monticello Wealth Management, Llc | 10 267 | 0,00 | 180 | −6,74 | ||||
| 2025-08-15 | 13F | Morgan Stanley | 1 091 703 | 10,85 | 19 192 | 3,44 | ||||
| 2025-08-13 | 13F | Northwestern Mutual Wealth Management Co | 264 502 | 526,95 | 4 650 | 485,52 | ||||
| 2025-05-06 | 13F | Venturi Wealth Management, LLC | 0 | −100,00 | 0 | |||||
| 2025-07-14 | 13F | Wealth Advisory Solutions, LLC | 24 725 | 44,17 | 435 | 34,37 | ||||
| 2025-08-12 | 13F | SRS Capital Advisors, Inc. | 64 | 0,00 | 1 | 0,00 | ||||
| 2025-07-18 | 13F | B.O.S.S. Retirement Advisors, LLC | 100 726 | −0,36 | 1 771 | −7,04 | ||||
| 2025-08-15 | 13F | Kestra Advisory Services, LLC | 18 861 | 28,64 | 332 | 19,93 | ||||
| 2025-07-31 | 13F | Buckingham Strategic Partners | 14 145 | 0,01 | 249 | −6,77 | ||||
| 2025-07-29 | 13F | Ballast, Inc. | 15 610 | 274 | ||||||
| 2025-08-06 | 13F | Hallmark Capital Management Inc | 1 | 0,00 | 0 | |||||
| 2025-08-08 | 13F | Foundations Investment Advisors, LLC | 18 415 | 1,63 | 324 | −5,28 | ||||
| 2025-09-04 | 13F/A | Advisor Group Holdings, Inc. | 148 764 | 74,54 | 2 616 | 62,83 | ||||
| 2025-08-18 | 13F/A | National Bank Of Canada /fi/ | 4 650 | 2,20 | 82 | −4,71 | ||||
| 2025-08-14 | 13F | Mariner, LLC | 28 170 | 0,44 | 495 | −6,25 | ||||
| 2025-07-11 | 13F | Farther Finance Advisors, LLC | 22 080 | 4,28 | 388 | −2,76 | ||||
| 2025-08-14 | 13F | Fmr Llc | 2 454 | −38,14 | 43 | −41,89 | ||||
| 2025-08-14 | 13F | Sunbelt Securities, Inc. | 6 900 | −0,26 | 124 | −4,62 | ||||
| 2025-08-08 | 13F/A | Sterling Capital Management LLC | 52 | 1,96 | 1 | |||||
| 2025-08-08 | 13F | Tortoise Investment Management, LLC | 1 000 | 0,00 | 18 | −5,56 | ||||
| 2025-08-05 | 13F | Huntington National Bank | 79 | −5,95 | ||||||
| 2025-07-09 | 13F | Breakwater Investment Management | 33 | 0,00 | 1 | |||||
| 2025-08-12 | 13F | CIBC Private Wealth Group, LLC | 992 | 39,52 | 17 | 54,55 | ||||
| 2025-07-14 | 13F | Caitlin John, LLC | 22 855 | 1,88 | 402 | −4,98 | ||||
| 2025-08-06 | 13F | Wedbush Securities Inc | 35 386 | −6,96 | 1 | |||||
| 2025-07-24 | 13F | Jfs Wealth Advisors, Llc | 1 544 | 0,00 | 27 | −6,90 | ||||
| 2025-07-24 | 13F | Ronald Blue Trust, Inc. | 250 | 0,00 | 4 | 0,00 | ||||
| 2025-08-12 | 13F | Steward Partners Investment Advisory, Llc | 33 408 | 12,93 | 587 | 5,39 | ||||
| 2025-08-14 | 13F | Comerica Bank | 2 644 | 0,00 | 46 | −6,12 | ||||
| 2025-08-14 | 13F | Raymond James Financial Inc | 108 546 | −20,64 | 1 908 | −25,93 | ||||
| 2025-08-14 | 13F | Citadel Advisors Llc | Call | 15 400 | 9,22 | 271 | 1,89 | |||
| 2025-08-12 | 13F | MAI Capital Management | 947 | 0,00 | 17 | −5,88 | ||||
| 2025-08-11 | 13F | HighTower Advisors, LLC | 14 817 | 29,79 | 260 | 20,93 | ||||
| 2025-08-13 | 13F | Scotia Capital Inc. | 10 888 | 0,00 | 191 | −6,83 | ||||
| 2025-08-05 | 13F | Cherry Tree Wealth Management, LLC | 1 064 | 0,00 | 19 | −10,00 | ||||
| 2025-07-07 | 13F | Teamwork Financial Advisors, LLC | 12 388 | −0,26 | 218 | −6,87 | ||||
| 2025-08-14 | 13F | Mml Investors Services, Llc | 21 131 | 2,13 | 0 | |||||
| 2025-08-11 | 13F | Principal Securities, Inc. | 4 250 | 0,00 | 75 | −2,63 | ||||
| 2025-08-13 | 13F | Transce3nd, LLC | 4 352 | 3,20 | 77 | −3,80 | ||||
| 2025-07-21 | 13F | Mirae Asset Global Investments Co., Ltd. | 124 000 | 5,08 | 2 180 | −1,40 | ||||
| 2025-04-23 | 13F | Golden State Wealth Management, LLC | 0 | −100,00 | 0 | |||||
| 2025-08-06 | 13F | New Millennium Group LLC | 91 | 0,00 | 2 | 0,00 | ||||
| 2025-07-30 | 13F | Whittier Trust Co | 50 | 0,00 | 1 | |||||
| 2025-08-12 | 13F | J.w. Cole Advisors, Inc. | 15 456 | 272 | ||||||
| 2025-08-08 | 13F | Avantax Advisory Services, Inc. | 16 192 | −14,73 | 285 | −20,45 | ||||
| 2025-08-14 | 13F | GWM Advisors LLC | 4 858 | −0,96 | 85 | −7,61 | ||||
| 2025-07-22 | 13F | Simplicity Wealth,LLC | 27 414 | 72,77 | 482 | 61,41 | ||||
| 2025-08-14 | 13F | Susquehanna International Group, Llp | 25 718 | 452 | ||||||
| 2025-08-08 | 13F | Good Life Advisors, LLC | 23 339 | 3,62 | 410 | −3,30 | ||||
| 2025-08-11 | 13F | Citigroup Inc | 600 | 0,00 | 11 | −9,09 | ||||
| 2025-07-25 | 13F | Concord Wealth Partners | 725 | 13 | ||||||
| 2025-08-11 | 13F | TRUE Private Wealth Advisors | 12 175 | −17,73 | 214 | −23,02 | ||||
| 2025-08-01 | 13F | Envestnet Asset Management Inc | 64 596 | −2,25 | 1 136 | −8,84 | ||||
| 2025-07-23 | 13F | Eagle Strategies LLC | 39 354 | 6,99 | 692 | −0,14 | ||||
| 2025-08-14 | 13F | Arete Wealth Advisors, LLC | 0 | −100,00 | 0 | |||||
| 2025-08-13 | 13F | Jones Financial Companies Lllp | 45 727 | 24,12 | 803 | 16,38 | ||||
| 2025-07-31 | 13F | Cornerstone Management, Inc. | 11 663 | 0,00 | 205 | −6,39 | ||||
| 2025-08-11 | 13F | FSA Wealth Management LLC | 365 | 1,96 | 6 | 0,00 | ||||
| 2025-07-29 | 13F | Private Trust Co Na | 2 000 | 0,00 | 35 | −5,41 | ||||
| 2025-07-30 | 13F | LifeWealth Investments, LLC | 29 689 | 25,70 | 522 | 17,34 | ||||
| 2025-08-14 | 13F | Wells Fargo & Company/mn | 775 844 | 13,50 | 13 639 | 5,91 | ||||
| 2025-07-25 | 13F | Cypress Capital Group | 25 319 | 445 | ||||||
| 2025-07-25 | 13F | Apollon Wealth Management, LLC | 0 | −100,00 | 0 | −100,00 | ||||
| 2025-08-12 | 13F | LPL Financial LLC | 925 738 | −1,31 | 16 274 | −7,91 | ||||
| 2025-04-17 | 13F | Authentikos Wealth Advisory, LLC | 0 | −100,00 | 0 | |||||
| 2025-07-14 | 13F | Painted Porch Advisors LLC | 0 | −100,00 | 0 | |||||
| 2025-08-07 | 13F | Allworth Financial LP | 185 | −30,45 | 3 | −25,00 | ||||
| 2025-03-21 | 13F | Prostatis Group LLC | 0 | −100,00 | 0 | |||||
| 2025-08-14 | 13F | Bnp Paribas Arbitrage, Sa | 0 | −100,00 | 0 | |||||
| 2025-07-16 | 13F | Squire Investment Management Company, LLC | 14 089 | 0,00 | 248 | −6,79 |