Grunnleggende statistikk
| Institusjonelle eiere | 202 total, 202 long only, 0 short only, 0 long/short - change of 5,21% MRQ |
| Gjennomsnittlig porteføljeallokering | 0.5480 % - change of 0,97% MRQ |
| Institusjonelle aksjer (Long) | 24 687 341 (ex 13D/G) - change of −1,67MM shares −6,32% MRQ |
| Institusjonell verdi (Long) | $ 705 412 USD ($1000) |
Institusjonelt eierskap og aksjonærer
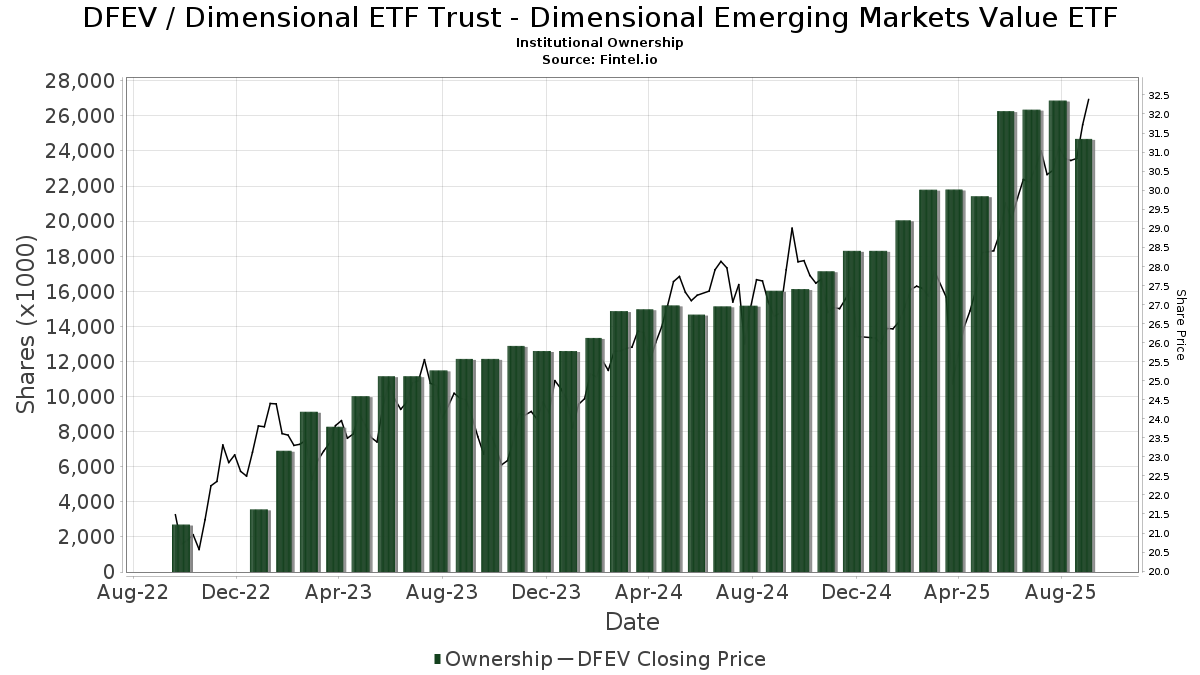
Dimensional ETF Trust - Dimensional Emerging Markets Value ETF (US:DFEV) har 202 institusjonelle eiere og aksjonærer som har sendt inn 13D/G- eller 13F-skjemaer til Securities Exchange Commission (SEC). Disse institusjonene eier til sammen 24,687,341 aksjer. De største aksjonærene inkluderer Asset Dedication, LLC, Ritholtz Wealth Management, Jones Financial Companies Lllp, HighTower Advisors, LLC, Raymond James Financial Inc, Fmr Llc, True Wealth Design, LLC, Sensible Money, LLC, Marquette Asset Management, LLC, and Beacon Pointe Advisors, LLC .
Dimensional ETF Trust - Dimensional Emerging Markets Value ETF (ARCA:DFEV) institusjonell eierstruktur viser nåværende posisjoner i selskapet fordelt på institusjoner og fond, samt de siste endringene i posisjonsstørrelse. De største aksjonærene kan være individuelle investorer, verdipapirfond, hedgefond eller institusjoner. Schedule 13D indikerer at investoren eier (eller har eid) mer enn 5 % av selskapet og har til hensikt (eller hadde til hensikt) å aktivt forfølge en endring i forretningsstrategien. Schedule 13G indikerer en passiv investering på over 5 %.
The share price as of September 10, 2025 is 31,72 / share. Previously, on September 11, 2024, the share price was 26,69 / share. This represents an increase of 18,85% over that period.
Fondssentiment-score
Fondssentiment Score (også kjent som akkumulering av eierskap poengsum) viser hvilke aksjer som er mest kjøpt av fond. Den er resultatet av en sofistikert, kvantitativ flerfaktormodell som identifiserer selskaper med de høyeste nivåene av institusjonell akkumulering. Beregningsmodellen for poeng bruker en kombinasjon av den totale økningen i antall offentliggjorte eiere, endringer i porteføljeallokeringen til disse eierne og andre beregninger. Tallet går fra 0 til 100, der høyere tall indikerer en høyere grad av akkumulering i forhold til sammenlignbare selskaper, der 50 er gjennomsnittet.
Oppdateringsfrekvens: Daglig
Sjekk ut Ownership Explorer, som inneholder en liste over de høyest rangerte selskapene.
Institusjonell Put/Call-forhold
I tillegg til å rapportere standard aksje- og gjeldsemisjoner må institusjoner med mer enn 100 millioner kroner i forvaltningskapital også oppgi beholdningen av put- og callopsjoner. Siden put-opsjoner generelt indikerer et negativt sentiment, og call-opsjoner indikerer et positivt sentiment, kan vi få et inntrykk av det generelle institusjonelle sentimentet ved å plotte forholdet mellom put- og call-opsjoner. Diagrammet til høyre viser det historiske forholdet mellom put- og call-opsjoner for dette instrumentet.
Ved å bruke Put/Call-forholdet som en indikator på investorsentimentet kan man overvinne en av de viktigste svakhetene ved å bruke totalt institusjonelt eierskap, nemlig at en betydelig andel av forvaltningskapitalen investeres passivt for å følge indekser. Passivt forvaltede fond kjøper vanligvis ikke opsjoner, slik at indikatoren for put/call-forhold i større grad gjenspeiler stemningen i aktivt forvaltede fond.
13D/G-arkiveringer
Vi presenterer 13D/G-arkiveringene separat fra 13F-arkiveringene fordi de behandles forskjellig av SEC. 13D/G-arkiveringene kan sendes inn av grupper av investorer (med én leder), mens 13D/G-arkiveringene ikke kan sendes inn. Dette fører til situasjoner der en investor kan sende inn en 13D/G-rapport med én verdi for alle aksjene (som representerer alle aksjene som eies av investorgruppen), men deretter sende inn en 13F-melding med en annen verdi for alle aksjene (som kun representerer deres eget eierskap). Dette betyr at aksjeeierskap i 13D/G-arkiveringene og 13F-arkiveringene ofte ikke er direkte sammenlignbare, og vi presenterer dem derfor separat.
Merk: Fra og med 16. mai 2021 viser vi ikke lenger eiere som ikke har sendt inn en 13D/G i løpet av det siste året. Tidligere viste vi hele historikken for 13D/G-arkiveringer. Generelt må enheter som er pålagt å sende inn 13D/G-arkiveringer, sende inn minst én gang i året før de sender inn en avsluttende rapport. Det hender imidlertid at fond trekker seg ut av posisjoner uten å sende inn en avsluttende innlevering (dvs. at de avvikler), slik at visning av hele historikken av og til fører til forvirring om det nåværende eierskapet. For å unngå forvirring viser vi nå bare "nåværende" eiere, det vil si eiere som har sendt inn informasjon i løpet av det siste året.
Upgrade to unlock premium data.
13F- og NPORT-arkiveringer
Detaljer om 13F-arkiveringer er gratis. Detaljer om NP-arkiveringer krever et premium-medlemskap. Grønne rader indikerer nye posisjoner. Røde rader indikerer lukkede posisjoner. Klikk på lenke ikonet for å se hele transaksjonshistorikken.
Oppgrader
for å låse opp premiedata og eksportere til Excel. ![]() .
.
| Fildato | Kilde | Investor | Type | Gjennomsnittlig pris (estimert) |
Aksjer | Δ Aksjer (%) |
Rapportert verdi ($1000) | Verdi (%) | Portallokering (%) | |
|---|---|---|---|---|---|---|---|---|---|---|
| 2025-07-11 | 13F | Farther Finance Advisors, LLC | 71 734 | 15,56 | 2 151 | 27,50 | ||||
| 2025-07-24 | 13F | Us Bancorp \de\ | 0 | −100,00 | 0 | |||||
| 2025-08-08 | 13F | Smithfield Trust Co | 1 996 | 0,00 | 0 | |||||
| 2025-08-13 | 13F | SageView Advisory Group, LLC | 8 041 | −1,97 | 246 | 10,86 | ||||
| 2025-07-17 | 13F | Applied Capital LLC | 51 695 | −15,76 | 1 550 | −6,57 | ||||
| 2025-07-07 | 13F | Versant Capital Management, Inc | 57 306 | 8,58 | 1 719 | 20,39 | ||||
| 2025-07-28 | 13F | RCS Financial Planning, LLC | 11 982 | −30,36 | 359 | −22,80 | ||||
| 2025-08-13 | 13F | Jones Financial Companies Lllp | 1 214 257 | 166,65 | 36 221 | 193,48 | ||||
| 2025-08-08 | 13F | Your Advocates Ltd., LLP | 427 | 0,00 | 13 | 9,09 | ||||
| 2025-08-14 | 13F | Great Valley Advisor Group, Inc. | 6 956 | 209 | ||||||
| 2025-08-15 | 13F | Kestra Advisory Services, LLC | 33 722 | −11,69 | 1 011 | −2,03 | ||||
| 2025-07-28 | 13F | Harbour Investments, Inc. | 156 | 5 | ||||||
| 2025-07-29 | 13F | Two West Capital Advisors LLC | 16 507 | 0,74 | 509 | 21,53 | ||||
| 2025-07-15 | 13F | Marquette Asset Management, LLC | 654 800 | 1,85 | 19 637 | 12,92 | ||||
| 2025-08-15 | 13F | CI Private Wealth, LLC | 103 445 | −26,07 | 3 102 | −18,02 | ||||
| 2025-07-22 | 13F | Gemmer Asset Management LLC | 7 396 | −2,00 | 222 | 8,33 | ||||
| 2025-08-14 | 13F | Monograph Wealth Advisors, Llc | 34 685 | 0,00 | 1 040 | 10,87 | ||||
| 2025-07-17 | 13F | XY Planning Network, Inc. | 9 687 | 291 | ||||||
| 2025-08-14 | 13F | Colony Group, LLC | 12 580 | −5,20 | 377 | 5,31 | ||||
| 2025-08-12 | 13F | Landing Point Financial Group, LLC | 20 212 | 29,37 | 606 | 43,60 | ||||
| 2025-07-14 | 13F | Maryland Capital Advisors Inc. | 126 576 | 3,53 | 3 796 | 14,79 | ||||
| 2025-07-14 | 13F | Shearwater Capital LLC | 6 967 | 209 | ||||||
| 2025-07-28 | 13F | Sterling Financial Planning, Inc. | 185 640 | 5,68 | 5 567 | 17,18 | ||||
| 2025-05-02 | 13F | Capital A Wealth Management, LLC | 12 | 0 | ||||||
| 2025-08-14 | 13F/A | Skopos Labs, Inc. | 2 867 | 86 | ||||||
| 2025-08-12 | 13F | Global Retirement Partners, LLC | 773 | 0,65 | 23 | 15,00 | ||||
| 2025-05-16 | 13F | Coppell Advisory Solutions LLC | 0 | −100,00 | 0 | |||||
| 2025-08-01 | 13F | Envestnet Asset Management Inc | 137 323 | 4,53 | 4 118 | 15,90 | ||||
| 2025-08-01 | 13F | Motco | 6 472 | 195 | ||||||
| 2025-08-08 | 13F | Avantax Advisory Services, Inc. | 8 208 | −24,45 | 246 | −16,04 | ||||
| 2025-08-12 | 13F | Jpmorgan Chase & Co | 56 216 | −20,50 | 1 686 | −11,87 | ||||
| 2025-07-17 | 13F | Porter White Investment Advisors, Inc. | 31 917 | −19,87 | 957 | −11,14 | ||||
| 2025-04-07 | 13F | GoalVest Advisory LLC | 0 | −100,00 | 0 | |||||
| 2025-07-25 | 13F | Sequoia Financial Advisors, LLC | 69 128 | −11,35 | 2 073 | −1,71 | ||||
| 2025-08-12 | 13F | McGrath & Associates, Inc. | 62 685 | −2,81 | 1 880 | 7,74 | ||||
| 2025-04-21 | 13F | Envestnet Portfolio Solutions, Inc. | 0 | −100,00 | 0 | |||||
| 2025-08-11 | 13F | Citigroup Inc | 17 649 | 84,84 | 529 | 105,04 | ||||
| 2025-07-09 | 13F | Bruce G. Allen Investments, LLC | 4 703 | 0,00 | 141 | 11,02 | ||||
| 2025-07-22 | 13F | Firethorn Wealth Partners, Llc | 12 702 | −3,65 | 381 | 6,74 | ||||
| 2025-07-25 | 13F | Tranquility Partners, LLC | 15 724 | 2,28 | 472 | 13,49 | ||||
| 2025-08-14 | 13F | Jane Street Group, Llc | 193 883 | −71,20 | 5 815 | −68,07 | ||||
| 2025-08-05 | 13F | Astra Wealth Partners LLC | 77 931 | −5,79 | 2 337 | 4,47 | ||||
| 2025-08-12 | 13F | LPL Financial LLC | 29 079 | 36,43 | 872 | 51,39 | ||||
| 2025-08-13 | 13F | GeoWealth Management, LLC | 0 | −100,00 | 0 | |||||
| 2025-07-22 | 13F | Wealthcare Advisory Partners LLC | 9 832 | 1,48 | 295 | 12,21 | ||||
| 2025-08-11 | 13F | HighTower Advisors, LLC | 942 664 | 3,81 | 28 270 | 15,09 | ||||
| 2025-07-10 | 13F | Oliver Lagore Vanvalin Investment Group | 0 | −100,00 | 0 | |||||
| 2025-08-21 | 13F | Aveo Capital Partners, LLC | 0 | −100,00 | 0 | |||||
| 2025-07-15 | 13F | Family Investment Center, Inc. | 104 279 | 3,40 | 3 127 | 14,67 | ||||
| 2025-08-13 | 13F | Ark & Tlk Investments, Llc | 10 461 | 314 | ||||||
| 2025-08-12 | 13F | Rather & Kittrell, Inc. | 28 074 | 38,54 | 842 | 53,47 | ||||
| 2025-08-13 | 13F | Natixis Advisors, L.p. | 42 466 | 157,21 | 1 | |||||
| 2025-08-13 | 13F | Baird Financial Group, Inc. | 28 680 | 26,86 | 860 | 40,75 | ||||
| 2025-08-14 | 13F | EP Wealth Advisors, Inc. | 19 890 | −56,30 | 596 | −51,58 | ||||
| 2025-07-21 | 13F | Financial Architects, LLC | 254 015 | 0,11 | 7 618 | 10,99 | ||||
| 2025-07-30 | 13F | Exencial Wealth Advisors, Llc | 539 495 | 9,93 | 16 179 | 21,88 | ||||
| 2025-08-14 | 13F | Wells Fargo & Company/mn | 867 | 510,56 | 26 | 766,67 | ||||
| 2025-07-14 | 13F | UMA Financial Services, Inc. | 1 721 | 0,00 | 52 | 10,87 | ||||
| 2025-08-01 | 13F | Red Lighthouse Investment Management, Llc | 4 398 | 0,00 | 132 | 14,91 | ||||
| 2025-08-14 | 13F | Bank Of America Corp /de/ | 90 008 | 93,53 | 2 699 | 114,55 | ||||
| 2025-04-17 | 13F | Retirement Solution Inc. | 0 | −100,00 | 0 | −100,00 | ||||
| 2025-07-11 | 13F | Rockwood Wealth Management, LLC | 9 818 | 0,00 | 294 | 10,94 | ||||
| 2025-08-13 | 13F | Northwestern Mutual Wealth Management Co | 758 | 23 | ||||||
| 2025-07-29 | 13F | Schubert & Co | 19 115 | −44,27 | 573 | −38,19 | ||||
| 2025-07-23 | 13F | Matisse Capital | 39 760 | 0,00 | 1 192 | 10,88 | ||||
| 2025-07-18 | 13F | Truist Financial Corp | 253 346 | 0,08 | 7 598 | 10,95 | ||||
| 2025-07-29 | 13F | Unison Advisors LLC | 18 813 | −4,52 | 564 | 6,02 | ||||
| 2025-08-13 | 13F | EverSource Wealth Advisors, LLC | 26 018 | 780 | ||||||
| 2025-08-14 | 13F | Glen Eagle Advisors, LLC | 4 960 | 0,00 | 149 | 10,45 | ||||
| 2025-08-14 | 13F | Raymond James Financial Inc | 877 088 | 5,14 | 26 304 | 16,57 | ||||
| 2025-08-06 | 13F | Commonwealth Equity Services, Llc | 57 335 | −6,95 | 2 | 0,00 | ||||
| 2025-08-13 | 13F | Beacon Pointe Advisors, LLC | 548 406 | −0,96 | 16 447 | 9,80 | ||||
| 2025-07-30 | 13F | Blume Capital Management, Inc. | 260 708 | 1,42 | 7 819 | 12,44 | ||||
| 2025-08-05 | 13F | Cherry Tree Wealth Management, LLC | 454 | 0,00 | 14 | 8,33 | ||||
| 2025-08-14 | 13F | Royal Bank Of Canada | 25 687 | −0,96 | 770 | 9,69 | ||||
| 2025-07-03 | 13F | Lam Group, Inc. | 84 585 | 0,59 | 2 537 | 11,52 | ||||
| 2025-07-17 | 13F | Eagle Wealth Strategies Llc | 470 016 | −0,32 | 14 096 | 10,51 | ||||
| 2025-07-21 | 13F | Mattern Capital Management, Llc | 7 513 | 225 | ||||||
| 2025-08-11 | 13F | Dorsey & Whitney Trust CO LLC | 21 719 | 0,00 | 651 | 10,90 | ||||
| 2025-08-14 | 13F | Acorn Wealth Advisors, LLC | 10 265 | 14,90 | 308 | 27,39 | ||||
| 2025-07-24 | 13F | Jfs Wealth Advisors, Llc | 20 335 | 0,00 | 610 | 10,73 | ||||
| 2025-07-28 | 13F | Pettinga Financial Advisors, LLC | 36 207 | 122,68 | 1 086 | 147,15 | ||||
| 2025-07-29 | 13F | Chicago Partners Investment Group LLC | 83 980 | 2,84 | 2 606 | 16,55 | ||||
| 2025-08-14 | 13F | Comerica Bank | 1 363 | −63,29 | 41 | −60,00 | ||||
| 2025-07-30 | 13F | Rehmann Capital Advisory Group | 10 668 | 8,60 | 320 | 20,38 | ||||
| 2025-07-25 | 13F | Concord Wealth Partners | 74 | 0,00 | 2 | 100,00 | ||||
| 2025-08-05 | 13F | Dravo Bay Llc | 97 142 | −0,89 | 2 990 | 12,75 | ||||
| 2025-08-05 | 13F | Dunhill Financial, LLC | 158 | 5 | ||||||
| 2025-08-14 | 13F | Susquehanna International Group, Llp | 325 631 | 316,81 | 9 766 | 362,14 | ||||
| 2025-08-13 | 13F | Millstone Evans Group, LLC | 605 | −65,09 | 18 | −60,87 | ||||
| 2025-08-13 | 13F | United Wealth Management, LLC | 152 898 | 2,26 | 4 585 | 13,38 | ||||
| 2025-07-23 | 13F | Sax Wealth Advisors, Llc | 69 332 | 28,86 | 2 079 | 42,89 | ||||
| 2025-08-12 | 13F | Accredited Wealth Management, LLC | 400 | 0,00 | 12 | 10,00 | ||||
| 2025-07-15 | 13F | Verum Partners LLC | 89 314 | −2,09 | 2 679 | 8,55 | ||||
| 2025-08-04 | 13F | Bay Colony Advisory Group, Inc d/b/a Bay Colony Advisors | 9 617 | 288 | ||||||
| 2025-08-11 | 13F | Foundation Wealth Management, LLC\PA | 35 944 | −19,92 | 1 078 | −11,29 | ||||
| 2025-07-30 | 13F | Mills Wealth Advisors LLC | 150 625 | 15,78 | 4 517 | 28,36 | ||||
| 2025-08-04 | 13F | Integrity Alliance, Llc. | 99 612 | −0,56 | 2 987 | 10,26 | ||||
| 2025-07-18 | 13F | Heritage Financial Services, LLC | 86 021 | −1,66 | 2 580 | 9,00 | ||||
| 2025-07-09 | 13F | Christopher J. Hasenberg, Inc | 338 | 10 | ||||||
| 2025-08-12 | 13F | Pathstone Holdings, LLC | 112 915 | −7,14 | 3 386 | 3,23 | ||||
| 2025-08-27 | 13F/A | Brinker Capital Investments, LLC | 56 937 | 567,10 | 1 708 | 642,17 | ||||
| 2025-07-23 | 13F | Abel Hall, LLC | 54 856 | −6,79 | 1 645 | 3,33 | ||||
| 2025-07-17 | 13F | Oceanside Advisors LLC | 28 109 | −9,20 | 843 | 0,72 | ||||
| 2025-08-11 | 13F | Root Financial Partners, LLC | 239 147 | −37,21 | 7 172 | −30,37 | ||||
| 2025-05-15 | 13F/A | Orion Portfolio Solutions, LLC | 8 535 | 231 | ||||||
| 2025-08-14 | 13F | C M Bidwell & Associates Ltd | 1 026 | 91,78 | 31 | 114,29 | ||||
| 2025-07-09 | 13F | Alesco Advisors Llc | 320 787 | 14,22 | 9 620 | 26,65 | ||||
| 2025-08-14 | 13F | Mml Investors Services, Llc | 71 626 | 54,37 | 2 | 100,00 | ||||
| 2025-07-22 | 13F | Sutton Place Investors Llc | 10 454 | 18,73 | 314 | 31,51 | ||||
| 2025-08-14 | 13F | Mariner, LLC | 7 884 | 4,94 | 236 | 16,26 | ||||
| 2025-08-14 | 13F | DecisionPoint Financial, LLC | 910 | 0,00 | 27 | 12,50 | ||||
| 2025-08-01 | 13F | Heritage Wealth Management, Inc./Texas | 0 | −100,00 | 0 | |||||
| 2025-08-01 | 13F | SwitchPoint Financial Planning, LLC | 13 697 | 0,00 | 411 | 10,81 | ||||
| 2025-07-30 | 13F | Clune & Associates, Ltd. | 11 897 | 0,57 | 357 | 11,60 | ||||
| 2025-08-11 | 13F | von Borstel & Associates, Inc. | 251 390 | 2,69 | 8 | 16,67 | ||||
| 2025-07-10 | 13F | White Wing Wealth Management | 72 883 | −1,61 | 2 186 | 14,34 | ||||
| 2025-08-05 | 13F | Bank Of Montreal /can/ | 44 624 | −0,36 | 1 338 | 10,49 | ||||
| 2025-05-15 | 13F | Evergreen Capital Management Llc | 0 | −100,00 | 0 | |||||
| 2025-08-05 | 13F | Golden Bell Financial Planning LLC | 66 575 | −0,38 | 1 997 | 10,46 | ||||
| 2025-08-07 | 13F | Resources Investment Advisors, LLC. | 90 899 | −3,05 | 2 726 | 7,49 | ||||
| 2025-08-08 | 13F | Pinney & Scofield, Inc. | 44 174 | −0,12 | 1 325 | 10,70 | ||||
| 2025-08-12 | 13F | Howe & Rusling Inc | 112 | 3 | ||||||
| 2025-05-12 | 13F | C2P Capital Advisory Group, LLC d.b.a. Prosperity Capital Advisors | 0 | −100,00 | 0 | −100,00 | ||||
| 2025-07-15 | 13F | Cordant, Inc. | 162 708 | −10,38 | 4 880 | −0,63 | ||||
| 2025-07-23 | 13F | First Financial Group Corp | 9 380 | 23,75 | 281 | 37,07 | ||||
| 2025-08-08 | 13F | Tortoise Investment Management, LLC | 181 634 | 12,16 | 5 447 | 24,36 | ||||
| 2025-07-28 | 13F | Eq Wealth Advisors, Llc | 101 460 | 18,37 | 3 043 | 31,23 | ||||
| 2025-07-17 | 13F | Avondale Wealth Management | 2 000 | 0,00 | 60 | 9,26 | ||||
| 2025-07-16 | 13F | Tru Independence Asset Management 2, Llc | 33 647 | 12,64 | 1 009 | 24,88 | ||||
| 2025-07-30 | 13F | Phillips Financial Management, Llc | 5 534 | 0,34 | 166 | 10,74 | ||||
| 2025-08-06 | 13F | Vestmark Advisory Solutions, Inc. | 421 062 | 107,54 | 12 628 | 130,13 | ||||
| 2025-07-18 | 13F | PBMares Wealth Management LLC | 168 304 | −4,39 | 5 047 | 6,01 | ||||
| 2025-07-31 | 13F | Opes Wealth Management LLC | 335 130 | 1,35 | 10 051 | 12,37 | ||||
| 2025-07-14 | 13F | U.S. Capital Wealth Advisors, LLC | 26 992 | −5,90 | 809 | 4,39 | ||||
| 2025-08-07 | 13F | Allworth Financial LP | 73 565 | −3,17 | 2 206 | 8,56 | ||||
| 2025-07-31 | 13F | Buckingham Strategic Partners | 16 450 | −3,12 | 493 | 7,41 | ||||
| 2025-09-09 | 13F | Cambridge Financial Group, LLC | 510 972 | 11,11 | 15 324 | 23,18 | ||||
| 2025-07-25 | 13F | Index Fund Advisors, Inc. | 365 272 | 9,62 | 10 954 | 21,54 | ||||
| 2025-08-14 | 13F | Warren Averett Asset Management, LLC | 184 984 | −6,69 | 5 548 | 3,45 | ||||
| 2025-08-14 | 13F | UBS Group AG | 314 | −19,49 | 9 | −10,00 | ||||
| 2025-07-28 | 13F | Ritholtz Wealth Management | 1 247 799 | 23,74 | 37 421 | 37,19 | ||||
| 2025-08-14 | 13F | Principia Wealth Advisory, LLC | 1 310 | −6,43 | 39 | 14,71 | ||||
| 2025-07-03 | 13F | Fiduciary Financial Group, Llc | 12 307 | 0,22 | 370 | 21,31 | ||||
| 2025-08-12 | 13F | Vestor Capital, Llc | 27 470 | 642,43 | 3 | |||||
| 2025-07-21 | 13F | Family CFO Inc | 15 413 | 408,68 | 462 | 470,37 | ||||
| 2025-07-22 | 13F | Simplicity Wealth,LLC | 0 | −100,00 | 0 | |||||
| 2025-08-06 | 13F | Savant Capital, LLC | 93 378 | −12,14 | 2 800 | −2,57 | ||||
| 2025-08-14 | 13F | NCM Capital Management, LLC | 13 950 | 11,60 | 419 | 23,67 | ||||
| 2025-08-15 | 13F | Morgan Stanley | 7 407 | −40,84 | 222 | −34,32 | ||||
| 2025-08-14 | 13F | Beaird Harris Wealth Management, LLC | 645 | 19 | ||||||
| 2025-08-14 | 13F | Cardiff Park Advisors, Llc | 44 914 | 1,54 | 1 347 | 12,54 | ||||
| 2025-08-08 | 13F | Sittner & Nelson, Llc | 362 | −41,89 | 11 | −37,50 | ||||
| 2025-08-14 | 13F | Citadel Advisors Llc | 0 | −100,00 | 0 | |||||
| 2025-07-16 | 13F | Vestia Personal Wealth Advisors | 96 718 | 7,96 | 2 900 | 19,69 | ||||
| 2025-07-16 | 13F | Blue Oak Capital, LLC | 85 789 | 5,40 | 2 573 | 16,86 | ||||
| 2025-08-01 | 13F | Austin Private Wealth, LLC | 13 242 | 14,70 | 397 | 27,24 | ||||
| 2025-07-09 | 13F | Graves-Light Private Wealth Management, Inc. | 323 304 | 2,85 | 9 696 | 14,02 | ||||
| 2025-07-24 | 13F | Wealth Advisors Northwest LLC | 85 045 | 2,92 | 2 550 | 14,09 | ||||
| 2025-08-04 | 13F | Spire Wealth Management | 46 762 | −2,32 | 1 402 | 8,35 | ||||
| 2025-07-09 | 13F | Efficient Frontier Advisors LLC | 32 975 | 0,00 | 989 | 10,89 | ||||
| 2025-07-29 | 13F | Grunden Financial Advisory, Inc. | 32 628 | 25,00 | 979 | 38,53 | ||||
| 2025-08-14 | 13F | Integrated Wealth Concepts LLC | 9 736 | 0,80 | 292 | 11,49 | ||||
| 2025-08-14 | 13F | Fmr Llc | 847 228 | −77,34 | 25 408 | −74,88 | ||||
| 2025-08-05 | 13F | Sensible Money, LLC | 688 611 | 8,11 | 20 651 | 19,86 | ||||
| 2025-08-14 | 13F | Old Mission Capital Llc | 118 958 | 3 568 | ||||||
| 2025-07-18 | 13F | TruNorth Capital Management, LLC | 198 | 0,00 | 6 | 0,00 | ||||
| 2025-07-30 | 13F | Eqis Capital Management, Inc. | 403 824 | −5,51 | 12 111 | 4,76 | ||||
| 2025-07-24 | 13F | Vantage Point Financial LLC | 46 844 | 6,75 | 1 405 | 18,28 | ||||
| 2025-08-13 | 13F | American Investment Services, Inc. | 11 064 | −5,37 | 332 | 4,75 | ||||
| 2025-07-17 | 13F | Janney Montgomery Scott LLC | 474 303 | 2,85 | 14 | 16,67 | ||||
| 2025-07-15 | 13F | Evanson Asset Management, LLC | 476 845 | 4,06 | 14 301 | 15,37 | ||||
| 2025-08-13 | 13F | Daner Wealth Management, LLC | 11 072 | −7,19 | 344 | 8,20 | ||||
| 2025-08-12 | 13F | Steward Partners Investment Advisory, Llc | 82 770 | 29,69 | 2 482 | 43,80 | ||||
| 2025-08-15 | 13F | Equitable Holdings, Inc. | 7 324 | −26,76 | 220 | −18,89 | ||||
| 2025-08-14 | 13F | GWM Advisors LLC | 144 796 | −4,33 | 4 342 | 6,08 | ||||
| 2025-08-12 | 13F | Hanover Advisors Inc | 18 394 | 1,62 | 552 | 12,68 | ||||
| 2025-07-23 | 13F | Gentry Private Wealth, Llc | 0 | −100,00 | 0 | −100,00 | ||||
| 2025-08-14 | 13F | Betterment LLC | 205 777 | 2,54 | 6 | 20,00 | ||||
| 2025-07-21 | 13F | Triad Wealth Partners, LLC | 9 790 | 294 | ||||||
| 2025-07-14 | 13F | Ridgewood Investments LLC | 396 | 12 | ||||||
| 2025-07-25 | 13F | Gibson Capital, LLC | 32 021 | 0,12 | 960 | 10,98 | ||||
| 2025-08-07 | 13F | Timonier Family Office, LTD. | 139 155 | 10,14 | 4 173 | 22,12 | ||||
| 2025-08-08 | 13F | Schwarz Dygos Wheeler Investment Advisors Llc | 82 305 | 0,62 | 2 468 | 11,57 | ||||
| 2025-07-23 | 13F | Mraz, Amerine & Associates, Inc. | 9 070 | 0,00 | 272 | 11,02 | ||||
| 2025-08-14 | 13F | Ancora Advisors, LLC | 3 051 | −16,82 | 91 | −8,08 | ||||
| 2025-07-14 | 13F | Park Avenue Securities Llc | 0 | −100,00 | 0 | |||||
| 2025-08-13 | 13F | Providence Capital Advisors, LLC | 289 | 9 | ||||||
| 2025-07-31 | 13F | Strata Wealth Advisors, LLC | 537 847 | 12,90 | 16 130 | 25,17 | ||||
| 2025-07-16 | 13F | BOS Asset Management, LLC | 18 420 | 0,03 | 552 | 10,84 | ||||
| 2025-08-01 | 13F | Clark Asset Management, LLC | 40 644 | 5,41 | 1 219 | 16,89 | ||||
| 2025-07-09 | 13F | Breakwater Capital Group | 149 737 | −4,31 | 4 491 | 6,07 | ||||
| 2025-07-10 | 13F | Pacific Asset Management, LLC | 9 733 | 0,58 | 292 | 11,49 | ||||
| 2025-07-31 | 13F | Glass Jacobson Investment Advisors llc | 84 609 | 11,44 | 2 537 | 27,55 | ||||
| 2025-08-14 | 13F | McIlrath & Eck, LLC | 793 | 0,00 | 24 | 9,52 | ||||
| 2025-08-06 | 13F | True Wealth Design, LLC | 746 985 | −7,32 | 22 402 | 2,75 | ||||
| 2025-05-15 | 13F | Wealth Management Nebraska | 0 | −100,00 | 0 | |||||
| 2025-07-30 | 13F | Forum Financial Management, LP | 32 209 | 0,00 | 966 | 10,79 | ||||
| 2025-07-17 | 13F | Lazari Capital Management, Inc. | 7 667 | −7,76 | 230 | 2,23 | ||||
| 2025-07-17 | 13F | DiNuzzo Private Wealth, Inc. | 225 906 | 2,99 | 6 775 | 14,17 | ||||
| 2025-04-18 | 13F | Edge Financial Advisors LLC | 0 | −100,00 | 0 | |||||
| 2025-08-12 | 13F | Proequities, Inc. | 0 | 0 | ||||||
| 2025-07-15 | 13F | BKA Wealth Consulting, Inc. | 67 175 | −22,22 | 2 015 | −13,78 | ||||
| 2025-08-12 | 13F | O'shaughnessy Asset Management, Llc | 8 457 | 53,88 | 254 | 70,95 | ||||
| 2025-07-29 | 13F | Wingate Wealth Advisors, Inc. | 8 661 | 0,62 | 260 | 11,64 | ||||
| 2025-08-06 | 13F | Cloud Capital Management, LLC | 7 477 | 5,41 | 0 | |||||
| 2025-07-16 | 13F | Perigon Wealth Management, LLC | 52 354 | −12,43 | 1 570 | −2,91 | ||||
| 2025-08-14 | 13F | Main Street Financial Solutions, LLC | 79 354 | 2,70 | 2 380 | 13,83 | ||||
| 2025-07-17 | 13F | Halbert Hargrove Global Advisors, Llc | 0 | −100,00 | 0 | |||||
| 2025-08-19 | 13F | Asset Dedication, LLC | 2 556 229 | 1,24 | 76 661 | 12,24 | ||||
| 2025-08-08 | 13F | Altiora Financial Group, LLC | 22 676 | 0,00 | 680 | 10,93 | ||||
| 2025-07-24 | 13F | IFP Advisors, Inc | 30 | −54,55 | 1 | −100,00 | ||||
| 2025-05-12 | 13F | Hantz Financial Services, Inc. | 0 | −100,00 | 0 | |||||
| 2025-08-06 | 13F | AE Wealth Management LLC | 301 362 | 12,71 | 9 038 | 24,96 | ||||
| 2025-05-14 | 13F | Lionshead Wealth Management, LLC | 0 | −100,00 | 0 | |||||
| 2025-08-14 | 13F | Css Llc/il | 27 631 | 17,78 | 829 | 30,60 | ||||
| 2025-07-30 | 13F | EnRich Financial Partners LLC | 51 213 | −3,95 | 1 536 | 6,45 | ||||
| 2025-07-31 | 13F | Cambridge Investment Research Advisors, Inc. | 22 930 | 117,37 | 1 | |||||
| 2025-05-08 | 13F | IFG Advisory, LLC | 0 | −100,00 | 0 | |||||
| 2025-07-03 | 13F | Garde Capital, Inc. | 1 035 | 25,76 | 31 | 40,91 | ||||
| 2025-07-23 | 13F | Elevate Wealth Advisory, Inc | 3 507 | 0,00 | 105 | 11,70 | ||||
| 2025-04-16 | 13F | Wealth Enhancement Advisory Services, Llc | 0 | −100,00 | 0 | |||||
| 2025-07-24 | 13F | Grand Wealth Management, Llc | 552 | 122,58 | 17 | 166,67 | ||||
| 2025-07-16 | 13F | Moisand Fitzgerald Tamayo, LLC | 18 151 | −2,07 | 544 | 8,58 | ||||
| 2025-09-04 | 13F/A | Advisor Group Holdings, Inc. | 42 396 | −37,74 | 1 272 | −30,94 |