Grunnleggende statistikk
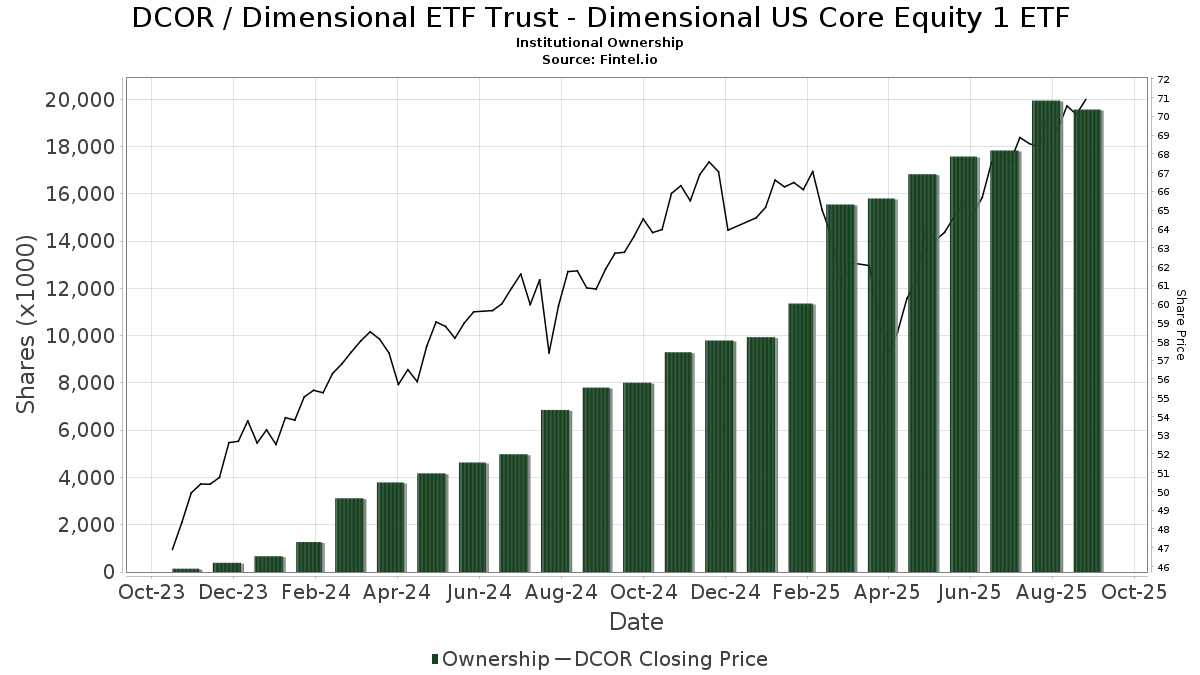
| Institusjonelle eiere | 179 total, 179 long only, 0 short only, 0 long/short - change of 26,06% MRQ |
| Gjennomsnittlig porteføljeallokering | 1.1887 % - change of −8,70% MRQ |
| Institusjonelle aksjer (Long) | 19 571 368 (ex 13D/G) - change of 1,99MM shares 11,32% MRQ |
| Institusjonell verdi (Long) | $ 1 208 459 USD ($1000) |
Institusjonelt eierskap og aksjonærer
Dimensional ETF Trust - Dimensional US Core Equity 1 ETF (US:DCOR) har 179 institusjonelle eiere og aksjonærer som har sendt inn 13D/G- eller 13F-skjemaer til Securities Exchange Commission (SEC). Disse institusjonene eier til sammen 19,571,368 aksjer. De største aksjonærene inkluderer Pure Financial Advisors, Inc., DFAW - Dimensional World Equity ETF, Your Advocates Ltd., LLP, C2P Capital Advisory Group, LLC d.b.a. Prosperity Capital Advisors, Brighton Jones Llc, Private Advisor Group, LLC, Rather & Kittrell, Inc., Resources Investment Advisors, LLC., Monograph Wealth Advisors, Llc, and LRI Investments, LLC .
Dimensional ETF Trust - Dimensional US Core Equity 1 ETF (ARCA:DCOR) institusjonell eierstruktur viser nåværende posisjoner i selskapet fordelt på institusjoner og fond, samt de siste endringene i posisjonsstørrelse. De største aksjonærene kan være individuelle investorer, verdipapirfond, hedgefond eller institusjoner. Schedule 13D indikerer at investoren eier (eller har eid) mer enn 5 % av selskapet og har til hensikt (eller hadde til hensikt) å aktivt forfølge en endring i forretningsstrategien. Schedule 13G indikerer en passiv investering på over 5 %.
The share price as of September 12, 2025 is 71,34 / share. Previously, on September 13, 2024, the share price was 61,79 / share. This represents an increase of 15,46% over that period.
Fondssentiment-score
Fondssentiment Score (også kjent som akkumulering av eierskap poengsum) viser hvilke aksjer som er mest kjøpt av fond. Den er resultatet av en sofistikert, kvantitativ flerfaktormodell som identifiserer selskaper med de høyeste nivåene av institusjonell akkumulering. Beregningsmodellen for poeng bruker en kombinasjon av den totale økningen i antall offentliggjorte eiere, endringer i porteføljeallokeringen til disse eierne og andre beregninger. Tallet går fra 0 til 100, der høyere tall indikerer en høyere grad av akkumulering i forhold til sammenlignbare selskaper, der 50 er gjennomsnittet.
Oppdateringsfrekvens: Daglig
Sjekk ut Ownership Explorer, som inneholder en liste over de høyest rangerte selskapene.
Institusjonell Put/Call-forhold
I tillegg til å rapportere standard aksje- og gjeldsemisjoner må institusjoner med mer enn 100 millioner kroner i forvaltningskapital også oppgi beholdningen av put- og callopsjoner. Siden put-opsjoner generelt indikerer et negativt sentiment, og call-opsjoner indikerer et positivt sentiment, kan vi få et inntrykk av det generelle institusjonelle sentimentet ved å plotte forholdet mellom put- og call-opsjoner. Diagrammet til høyre viser det historiske forholdet mellom put- og call-opsjoner for dette instrumentet.
Ved å bruke Put/Call-forholdet som en indikator på investorsentimentet kan man overvinne en av de viktigste svakhetene ved å bruke totalt institusjonelt eierskap, nemlig at en betydelig andel av forvaltningskapitalen investeres passivt for å følge indekser. Passivt forvaltede fond kjøper vanligvis ikke opsjoner, slik at indikatoren for put/call-forhold i større grad gjenspeiler stemningen i aktivt forvaltede fond.
13F- og NPORT-arkiveringer
Detaljer om 13F-arkiveringer er gratis. Detaljer om NP-arkiveringer krever et premium-medlemskap. Grønne rader indikerer nye posisjoner. Røde rader indikerer lukkede posisjoner. Klikk på lenke ikonet for å se hele transaksjonshistorikken.
Oppgrader
for å låse opp premiedata og eksportere til Excel. ![]() .
.
| Fildato | Kilde | Investor | Type | Gjennomsnittlig pris (estimert) |
Aksjer | Δ Aksjer (%) |
Rapportert verdi ($1000) | Verdi (%) | Portallokering (%) | |
|---|---|---|---|---|---|---|---|---|---|---|
| 2025-09-04 | 13F/A | Advisor Group Holdings, Inc. | 185 113 | 293,28 | 12 376 | 328,83 | ||||
| 2025-07-31 | 13F | Brighton Jones Llc | 644 970 | 19,73 | 43 116 | 30,51 | ||||
| 2025-06-26 | NP | DFAW - Dimensional World Equity ETF | 1 942 271 | 15,13 | 117 080 | 4,89 | ||||
| 2025-07-10 | 13F | Wealth Enhancement Advisory Services, Llc | 5 265 | 0,00 | 358 | 11,18 | ||||
| 2025-07-23 | 13F | Hardy Reed LLC | 282 278 | 16,42 | 18 870 | 26,90 | ||||
| 2025-07-11 | 13F | Colorado Capital Management, Inc. | 4 602 | 29,56 | 0 | |||||
| 2025-07-31 | 13F | Aspen Capital Management, LLC | 84 133 | −14,96 | 5 624 | −7,30 | ||||
| 2025-08-04 | 13F | Mesirow Financial Investment Management, Inc. | 22 647 | 0,16 | 1 514 | 9,16 | ||||
| 2025-08-08 | 13F | Your Advocates Ltd., LLP | 1 005 411 | 2,67 | 67 212 | 11,91 | ||||
| 2025-07-11 | 13F | Andrews, Lucia Wealth Management Llc | 6 647 | 444 | ||||||
| 2025-08-05 | 13F | C2P Capital Advisory Group, LLC d.b.a. Prosperity Capital Advisors | 853 734 | 3,84 | 57 072 | 12,77 | ||||
| 2025-08-11 | 13F | WPWealth LLP | 20 148 | 150,57 | 1 347 | 173,02 | ||||
| 2025-08-06 | 13F | Cloud Capital Management, LLC | 71 684 | −4,05 | 5 | 0,00 | ||||
| 2025-08-11 | 13F | Goodman Financial Corp | 23 600 | 0,00 | 1 578 | 8,98 | ||||
| 2025-08-01 | 13F | Ashton Thomas Private Wealth, LLC | 29 396 | 203,05 | 1 965 | 230,81 | ||||
| 2025-08-05 | 13F | WorthPointe, LLC | 3 465 | 0,26 | 232 | 9,48 | ||||
| 2025-07-11 | 13F | Quantum Financial Advisors, LLC | 239 017 | −11,46 | 15 978 | −3,49 | ||||
| 2025-07-28 | 13F | RCS Financial Planning, LLC | 10 104 | −1,44 | 675 | 7,48 | ||||
| 2025-07-17 | 13F | Nelson, Van Denburg & Campbell Wealth Management Group, LLC | 3 434 | 0,00 | 230 | 9,05 | ||||
| 2025-08-01 | 13F | Envestnet Asset Management Inc | 117 732 | 7,93 | 7 870 | 17,64 | ||||
| 2025-08-07 | 13F | Allworth Financial LP | 66 336 | 1,13 | 4 435 | 13,23 | ||||
| 2025-07-25 | 13F | Investment Advisory Group, LLC | 43 982 | 24,68 | 2 940 | 35,92 | ||||
| 2025-07-10 | 13F | Exchange Traded Concepts, Llc | 8 540 | 571 | ||||||
| 2025-07-17 | 13F | SC&H Financial Advisors, Inc. | 327 338 | 88,93 | 21 883 | 105,93 | ||||
| 2025-07-25 | 13F | LRI Investments, LLC | 407 930 | 224,34 | 27 270 | 253,56 | ||||
| 2025-07-30 | 13F | Phillips Financial Management, Llc | 5 440 | 11,68 | 364 | 21,81 | ||||
| 2025-04-15 | 13F | Signet Financial Management, Llc | 0 | −100,00 | 0 | |||||
| 2025-07-03 | 13F | Fiduciary Financial Group, Llc | 10 511 | 0,35 | 706 | 17,89 | ||||
| 2025-08-07 | 13F | Prospect Financial Group LLC | 113 224 | 7 569 | ||||||
| 2025-08-14 | 13F | Essential Planning, LLC. | 45 014 | 44,33 | 3 009 | 57,37 | ||||
| 2025-07-23 | 13F | Morton Capital Management LLC/CA | 101 954 | 42,97 | 6 816 | 55,84 | ||||
| 2025-07-22 | 13F | Yardley Wealth Management LLC | 6 788 | 16,13 | 0 | |||||
| 2025-07-18 | 13F | BCO Wealth Management LLC | 358 149 | 3,75 | 23 942 | 13,09 | ||||
| 2025-08-08 | 13F | Truepoint, Inc. | 91 843 | 77,86 | 6 140 | 93,90 | ||||
| 2025-08-14 | 13F | IHT Wealth Management, LLC | 15 123 | 0,00 | 1 011 | 8,95 | ||||
| 2025-08-12 | 13F | Proequities, Inc. | 0 | 0 | ||||||
| 2025-08-04 | 13F | Hutchinson Capital Management/ca | 4 180 | 279 | ||||||
| 2025-08-12 | 13F | J.w. Cole Advisors, Inc. | 8 031 | 537 | ||||||
| 2025-08-12 | 13F | CIBC Private Wealth Group, LLC | 137 | 9 | ||||||
| 2025-08-13 | 13F | American Investment Services, Inc. | 0 | −100,00 | 0 | |||||
| 2025-07-11 | 13F | Farther Finance Advisors, LLC | 79 870 | 1,47 | 5 339 | 10,20 | ||||
| 2025-08-12 | 13F | Change Path, LLC | 42 220 | 7,27 | 2 822 | 16,95 | ||||
| 2025-07-17 | 13F | XY Planning Network, Inc. | 13 178 | 86,18 | 881 | 102,76 | ||||
| 2025-08-14 | 13F | Qube Research & Technologies Ltd | 895 | 60 | ||||||
| 2025-08-15 | 13F | Kestra Advisory Services, LLC | 33 181 | 54,74 | 2 218 | 68,67 | ||||
| 2025-04-18 | 13F | Global Trust Asset Management, LLC | 0 | −100,00 | 0 | |||||
| 2025-07-17 | 13F | Heritage Investment Group, Inc. | 134 163 | 614,89 | 8 969 | 679,83 | ||||
| 2025-07-21 | 13F | Sageworth Trust Co | 296 687 | 23,13 | 19 834 | 34,22 | ||||
| 2025-08-13 | 13F | EverSource Wealth Advisors, LLC | 132 141 | −5,36 | 8 834 | 3,15 | ||||
| 2025-07-10 | 13F | Strathmore Capital Advisors, Inc. | 35 009 | 102,56 | 2 377 | 114,53 | ||||
| 2025-08-14 | 13F | UBS Group AG | 0 | −100,00 | 0 | |||||
| 2025-07-17 | 13F | Mustard Seed Financial, LLC | 3 239 | 217 | ||||||
| 2025-08-13 | 13F | Millstone Evans Group, LLC | 12 044 | −65,50 | 805 | −62,40 | ||||
| 2025-08-14 | 13F | Integrated Wealth Concepts LLC | 328 949 | 26,25 | 21 990 | 37,61 | ||||
| 2025-08-14 | 13F | Betterment LLC | 279 263 | 1,37 | 19 | 12,50 | ||||
| 2025-07-24 | 13F | Wealth Advisors Northwest LLC | 13 428 | 51,88 | 898 | 65,50 | ||||
| 2025-08-07 | 13F | Keystone Financial Services | 3 582 | 0,11 | 239 | 9,13 | ||||
| 2025-08-12 | 13F | LPL Financial LLC | 35 978 | 49,24 | 2 405 | 62,72 | ||||
| 2025-07-29 | 13F | Financial Symmetry Inc | 3 061 | 205 | ||||||
| 2025-08-01 | 13F | Rossby Financial, LCC | 626 | 0,16 | 42 | 10,81 | ||||
| 2025-08-12 | 13F | Eldridge Investment Advisors, Inc. | 54 423 | 4,14 | 3 638 | 13,51 | ||||
| 2025-07-09 | 13F | GEM Asset Management, LLC | 4 462 | 301 | ||||||
| 2025-07-22 | 13F | Firethorn Wealth Partners, Llc | 13 530 | 0,85 | 905 | 9,98 | ||||
| 2025-07-14 | 13F | ABLE Financial Group, LLC | 109 007 | 7 287 | ||||||
| 2025-08-12 | 13F | Jpmorgan Chase & Co | 4 703 | 14,40 | 314 | 24,60 | ||||
| 2025-08-12 | 13F | MAI Capital Management | 41 | 0,00 | 3 | 0,00 | ||||
| 2025-08-13 | 13F | Cerity Partners LLC | 66 831 | −35,57 | 4 468 | −29,78 | ||||
| 2025-08-08 | 13F | CWS Financial Advisors, LLC | 6 134 | −1,98 | 410 | 7,05 | ||||
| 2025-08-08 | 13F | SageOak Financial, LLC | 262 918 | 15,15 | 17 576 | 25,52 | ||||
| 2025-08-14 | 13F | STAR Financial Bank | 17 804 | 3,55 | 1 190 | 12,90 | ||||
| 2025-08-14 | 13F | Old Mission Capital Llc | 5 567 | −58,74 | 372 | −55,02 | ||||
| 2025-07-14 | 13F | Kfg Wealth Management, Llc | 303 016 | 2,98 | 20 257 | 12,25 | ||||
| 2025-07-14 | 13F | Financial Harvest, LLC | 3 777 | 252 | ||||||
| 2025-08-13 | 13F | Townsquare Capital Llc | 10 425 | −79,96 | 697 | −78,18 | ||||
| 2025-07-29 | 13F | Fundamentun, Llc | 351 460 | 608,07 | 23 495 | 671,85 | ||||
| 2025-07-21 | 13F | Triad Wealth Partners, LLC | 8 924 | 597 | ||||||
| 2025-08-12 | 13F | Rather & Kittrell, Inc. | 476 709 | 17,16 | 31 868 | 27,70 | ||||
| 2025-07-18 | 13F | Fmb Wealth Management | 43 097 | 1,22 | 2 881 | 10,34 | ||||
| 2025-07-18 | 13F | Truist Financial Corp | 45 442 | −1,88 | 3 038 | 6,94 | ||||
| 2025-08-18 | 13F/A | National Bank Of Canada /fi/ | 339 | 23 | ||||||
| 2025-07-24 | 13F | Cyndeo Wealth Partners, LLC | 69 131 | 4,00 | 4 621 | 13,37 | ||||
| 2025-08-05 | 13F | GPS Wealth Strategies Group, LLC | 1 878 | 0,00 | 126 | 8,70 | ||||
| 2025-07-15 | 13F | Maseco Llp | 7 029 | 470 | ||||||
| 2025-07-29 | 13F | Wealthstream Advisors, Inc. | 6 748 | −5,02 | 451 | 3,68 | ||||
| 2025-08-05 | 13F | Allodium Investment Consultants, LLC | 5 992 | 77,91 | 401 | 94,17 | ||||
| 2025-07-16 | 13F | Vestia Personal Wealth Advisors | 6 339 | 424 | ||||||
| 2025-07-15 | 13F | Great Oak Capital Partners, Llc | 374 113 | 5,56 | 25 361 | 12,27 | ||||
| 2025-07-17 | 13F | Archford Capital Strategies, LLC | 104 799 | 2,80 | 7 006 | 12,04 | ||||
| 2025-07-30 | 13F | Eqis Capital Management, Inc. | 15 112 | 1,85 | 1 010 | 10,99 | ||||
| 2025-07-09 | 13F | Dynamic Advisor Solutions LLC | 6 720 | −0,18 | 449 | 8,98 | ||||
| 2025-07-24 | 13F | Vantage Point Financial LLC | 289 099 | 2,05 | 19 326 | 11,24 | ||||
| 2025-04-15 | 13F | Michael A. Dubis Financial Planning, LLC | 21 585 | 6,07 | 1 324 | 132 200,00 | ||||
| 2025-07-11 | 13F | SILVER OAK SECURITIES, Inc | 12 135 | −3,79 | 811 | 5,60 | ||||
| 2025-07-17 | 13F | Elser Financial Planning, Inc | 104 227 | 7 014 | ||||||
| 2025-08-06 | 13F | Commonwealth Equity Services, Llc | 136 058 | 78,06 | 9 | 125,00 | ||||
| 2025-08-07 | 13F | Resources Investment Advisors, LLC. | 430 932 | 41,36 | 28 808 | 54,08 | ||||
| 2025-07-28 | 13F | RFG Advisory, LLC | 3 058 | −79,32 | 204 | −77,48 | ||||
| 2025-07-31 | 13F | Glass Jacobson Investment Advisors llc | 20 427 | 4,20 | 1 366 | 8,59 | ||||
| 2025-08-11 | 13F | Keyes, Stange & Wooten Wealth Management, LLC | 322 413 | −1,39 | 21 553 | 7,49 | ||||
| 2025-08-14 | 13F | DecisionPoint Financial, LLC | 113 578 | 415,23 | 7 626 | 464,40 | ||||
| 2025-07-21 | 13F | Onyx Financial Advisors, LLC | 21 266 | 107,74 | 1 422 | 126,63 | ||||
| 2025-07-21 | 13F | Sageworth Trust Co of South Dakota | 72 147 | 1,37 | 4 823 | 10,49 | ||||
| 2025-08-08 | 13F | Altiora Financial Group, LLC | 204 695 | 17,86 | 13 684 | 28,47 | ||||
| 2025-08-05 | 13F | Bank Of Montreal /can/ | 1 749 | 0,00 | 117 | 8,41 | ||||
| 2025-08-13 | 13F | B&D White Capital Company, LLC | 131 005 | 8 758 | ||||||
| 2025-07-15 | 13F | Evanson Asset Management, LLC | 9 827 | 34,71 | 657 | 46,76 | ||||
| 2025-07-23 | 13F | Woodside Wealth Management LLC | 3 039 | 0,00 | 203 | 9,14 | ||||
| 2025-08-08 | 13F | Cetera Investment Advisers | 26 270 | 1 756 | ||||||
| 2025-08-05 | 13F | Gould Asset Management Llc /ca/ | 22 782 | 19,46 | 1 523 | 30,20 | ||||
| 2025-07-18 | 13F | Pure Financial Advisors, Inc. | 2 107 446 | 3,67 | 140 883 | 13,00 | ||||
| 2025-08-05 | 13F | Dunhill Financial, LLC | 249 | 17 | ||||||
| 2025-08-13 | 13F | Vermillion & White Wealth Management Group, LLC | 232 | 0,00 | 16 | 7,14 | ||||
| 2025-08-14 | 13F | Wells Fargo & Company/mn | 406 | 27 | ||||||
| 2025-08-15 | 13F | CI Private Wealth, LLC | 0 | −100,00 | 0 | |||||
| 2025-07-16 | 13F | TCI Wealth Advisors, Inc. | 63 037 | 4 214 | ||||||
| 2025-07-17 | 13F | HB Wealth Management, LLC | 62 609 | −23,56 | 4 185 | −16,68 | ||||
| 2025-07-22 | 13F | USAdvisors Wealth Management, LLC | 37 979 | 0,44 | 3 | 0,00 | ||||
| 2025-08-06 | 13F | AE Wealth Management LLC | 331 | 0,00 | 22 | 10,00 | ||||
| 2025-07-24 | 13F | Riverchase Wealth Management, Llc | 235 501 | −1,32 | 15 743 | 7,56 | ||||
| 2025-08-13 | 13F | Annandale Capital, LLC | 369 615 | 14,41 | 25 | 26,32 | ||||
| 2025-07-23 | 13F | Sax Wealth Advisors, Llc | 34 445 | 87,02 | 2 303 | 103,90 | ||||
| 2025-08-14 | 13F | Raymond James Financial Inc | 111 662 | 7 465 | ||||||
| 2025-07-24 | 13F | IFP Advisors, Inc | 22 264 | 5,69 | 1 488 | 15,17 | ||||
| 2025-08-13 | 13F | Summit Wealth Group Llc / Co | 13 745 | 919 | ||||||
| 2025-08-12 | 13F | SRS Capital Advisors, Inc. | 2 952 | 0,00 | 197 | 8,84 | ||||
| 2025-07-25 | 13F | Concord Wealth Partners | 2 030 | 32,85 | 136 | 45,16 | ||||
| 2025-07-22 | 13F | Merit Financial Group, LLC | 10 650 | 4,15 | 712 | 13,40 | ||||
| 2025-07-16 | 13F | Perigon Wealth Management, LLC | 7 805 | −73,94 | 522 | −71,62 | ||||
| 2025-08-14 | 13F | Monograph Wealth Advisors, Llc | 408 744 | −10,82 | 27 325 | −2,79 | ||||
| 2025-07-16 | 13F | Plancorp, LLC | 86 025 | 5 751 | ||||||
| 2025-08-14 | 13F | Financial Engines Advisors L.L.C. | 19 070 | 23,77 | 1 275 | 34,92 | ||||
| 2025-08-08 | 13F | Avantax Advisory Services, Inc. | 6 349 | 16,50 | 424 | 26,95 | ||||
| 2025-07-08 | 13F | Apella Capital, LLC | 21 844 | 1 474 | ||||||
| 2025-07-25 | 13F | Hemington Wealth Management | 15 526 | 0,00 | 1 | |||||
| 2025-08-04 | 13F | Assetmark, Inc | 549 | −2,83 | 37 | 5,88 | ||||
| 2025-08-06 | 13F | Modera Wealth Management, LLC | 34 011 | 34,39 | 2 274 | 46,46 | ||||
| 2025-08-14 | 13F | Susquehanna International Group, Llp | 22 845 | −70,50 | 1 527 | −67,85 | ||||
| 2025-07-10 | 13F | Pacific Asset Management, LLC | 3 135 | 210 | ||||||
| 2025-08-14 | 13F | Comerica Bank | 57 | 4 | ||||||
| 2025-08-14 | 13F | Citadel Advisors Llc | 5 064 | 339 | ||||||
| 2025-07-11 | 13F | Sprinkle Financial Consultants LLC | 5 645 | 0,28 | 377 | 9,28 | ||||
| 2025-08-06 | 13F | Prospera Financial Services Inc | 14 947 | 999 | ||||||
| 2025-08-08 | 13F | Capital Investment Advisory Services, LLC | 88 522 | −1,47 | 5 918 | 7,41 | ||||
| 2025-07-24 | 13F | Drucker Wealth 3.0, LLC | 4 233 | −14,69 | 287 | −5,59 | ||||
| 2025-08-14 | 13F | Great Valley Advisor Group, Inc. | 0 | −100,00 | 0 | |||||
| 2025-07-29 | 13F | Werba Rubin Papier Wealth Management | 17 589 | 79,41 | 1 176 | 95,51 | ||||
| 2025-07-02 | 13F | Doliver Advisors, Lp | 3 020 | −29,27 | 202 | −22,99 | ||||
| 2025-08-11 | 13F | Foundation Wealth Management, LLC\PA | 4 472 | −28,36 | 299 | −21,99 | ||||
| 2025-08-13 | 13F | GeoWealth Management, LLC | 18 578 | 32,22 | 1 242 | 44,13 | ||||
| 2025-08-14 | 13F | EP Wealth Advisors, Inc. | 7 160 | 479 | ||||||
| 2025-08-14 | 13F | Note Advisors, LLC | 23 129 | 290,30 | 1 546 | 325,90 | ||||
| 2025-07-22 | 13F | Warwick Investment Management, Inc. | 3 214 | 215 | ||||||
| 2025-07-25 | 13F | Cwm, Llc | 10 590 | 133,16 | 1 | |||||
| 2025-07-14 | 13F | Park Avenue Securities Llc | 46 082 | 3 | ||||||
| 2025-05-15 | 13F/A | Orion Portfolio Solutions, LLC | 182 721 | 6,89 | 11 206 | 2,18 | ||||
| 2025-08-13 | 13F | Northern Trust Corp | 4 200 | −2,33 | 281 | 6,46 | ||||
| 2025-08-11 | 13F | Copperleaf Capital, LLC | 69 149 | 5,08 | 4 623 | 14,55 | ||||
| 2025-07-31 | 13F | BIP Wealth, LLC | 43 216 | 12,39 | 2 889 | 22,48 | ||||
| 2025-08-12 | 13F | Global Retirement Partners, LLC | 7 778 | 12 246,03 | 520 | 12 875,00 | ||||
| 2025-08-12 | 13F | Coldstream Capital Management Inc | 15 985 | 0,10 | 1 069 | 9,09 | ||||
| 2025-07-24 | 13F | Ronald Blue Trust, Inc. | 578 | 0,17 | 39 | 8,57 | ||||
| 2025-08-14 | 13F | Jane Street Group, Llc | 0 | −100,00 | 0 | |||||
| 2025-08-14 | 13F | Colony Group, LLC | 24 543 | 1 641 | ||||||
| 2025-08-27 | 13F/A | Brinker Capital Investments, LLC | 204 500 | 11,92 | 13 671 | 21,99 | ||||
| 2025-08-11 | 13F | Private Advisor Group, LLC | 564 735 | 22,64 | 37 753 | 33,68 | ||||
| 2025-08-14 | 13F | Main Street Financial Solutions, LLC | 43 405 | −5,37 | 2 902 | 3,17 | ||||
| 2025-08-07 | 13F | Alpha Financial Advisors, LLC | 60 869 | 4 069 | ||||||
| 2025-09-02 | 13F/A | FSC Wealth Advisors, LLC | 3 497 | 234 | ||||||
| 2025-08-14 | 13F | Mariner, LLC | 107 895 | 40,55 | 7 212 | 53,19 | ||||
| 2025-08-18 | 13F | Geneos Wealth Management Inc. | 298 528 | 4,02 | 19 957 | 13,39 | ||||
| 2025-07-09 | 13F | StrongBox Wealth, LLC | 4 192 | −19,57 | 280 | −12,23 | ||||
| 2025-08-05 | 13F | Hutchens & Kramer Investment Management Group, LLC | 203 353 | −0,38 | 13 653 | 9,06 | ||||
| 2025-07-31 | 13F | Cambridge Investment Research Advisors, Inc. | 228 977 | 18,48 | 15 | 36,36 | ||||
| 2025-08-15 | 13F | Morgan Stanley | 414 | 28 | ||||||
| 2025-08-12 | 13F | Pathstone Holdings, LLC | 0 | −100,00 | 0 | |||||
| 2025-08-01 | 13F | SwitchPoint Financial Planning, LLC | 0 | −100,00 | 0 | |||||
| 2025-08-11 | 13F | Wealthspire Advisors, LLC | 83 352 | 67,47 | 5 572 | 82,57 | ||||
| 2025-07-09 | 13F | Divergent Planning, LLC | 4 192 | 280 | ||||||
| 2025-08-14 | 13F | Mml Investors Services, Llc | 8 438 | 12,87 | 1 | |||||
| 2025-07-10 | 13F | Cypress Point Wealth Management, LLC | 227 308 | 217,68 | 15 196 | 246,29 | ||||
| 2025-07-24 | 13F | Grand Wealth Management, Llc | 26 772 | 1 790 | ||||||
| 2025-07-23 | 13F | Elevate Wealth Advisory, Inc | 576 | 200,00 | 39 | 245,45 | ||||
| 2025-08-08 | 13F | Advyzon Investment Management, LLC | 4 008 | 268 | ||||||
| 2025-08-14 | 13F | Royal Bank Of Canada | 5 384 | 360 | ||||||
| 2025-07-11 | 13F | Scratch Capital Llc | 11 529 | 771 | ||||||
| 2025-07-31 | 13F | Kathleen S. Wright Associates Inc. | 15 554 | 23,53 | 1 040 | 34,59 | ||||
| 2025-08-14 | 13F | Smartleaf Asset Management LLC | 114 821 | 1,34 | 7 647 | 10,73 | ||||
| 2025-08-15 | 13F | Tower Research Capital LLC (TRC) | 18 327 | 1 225 | ||||||
| 2025-08-26 | 13F/A | Thrivent Financial For Lutherans | 78 767 | 5 |