Grunnleggende statistikk
| Institusjonelle eiere | 151 total, 150 long only, 0 short only, 1 long/short - change of 0,66% MRQ |
| Gjennomsnittlig porteføljeallokering | 0.2989 % - change of −12,48% MRQ |
| Institusjonelle aksjer (Long) | 11 098 255 (ex 13D/G) - change of −1,18MM shares −9,61% MRQ |
| Institusjonell verdi (Long) | $ 278 861 USD ($1000) |
Institusjonelt eierskap og aksjonærer
Invesco DB Multi-Sector Commodity Trust - Invesco DB Agriculture Fund (US:DBA) har 151 institusjonelle eiere og aksjonærer som har sendt inn 13D/G- eller 13F-skjemaer til Securities Exchange Commission (SEC). Disse institusjonene eier til sammen 11,098,255 aksjer. De største aksjonærene inkluderer Wells Fargo & Company/mn, New York Life Investment Management Llc, Morgan Stanley, Bank Of America Corp /de/, QAI - IQ Hedge Multi-Strategy Tracker ETF, 1832 Asset Management L.P., Kestra Advisory Services, LLC, HighTower Advisors, LLC, Jpmorgan Chase & Co, and Cambria Investment Management, L.P. .
Invesco DB Multi-Sector Commodity Trust - Invesco DB Agriculture Fund (ARCA:DBA) institusjonell eierstruktur viser nåværende posisjoner i selskapet fordelt på institusjoner og fond, samt de siste endringene i posisjonsstørrelse. De største aksjonærene kan være individuelle investorer, verdipapirfond, hedgefond eller institusjoner. Schedule 13D indikerer at investoren eier (eller har eid) mer enn 5 % av selskapet og har til hensikt (eller hadde til hensikt) å aktivt forfølge en endring i forretningsstrategien. Schedule 13G indikerer en passiv investering på over 5 %.
The share price as of September 9, 2025 is 27,10 / share. Previously, on September 10, 2024, the share price was 24,49 / share. This represents an increase of 10,66% over that period.

Fondssentiment-score
Fondssentiment Score (også kjent som akkumulering av eierskap poengsum) viser hvilke aksjer som er mest kjøpt av fond. Den er resultatet av en sofistikert, kvantitativ flerfaktormodell som identifiserer selskaper med de høyeste nivåene av institusjonell akkumulering. Beregningsmodellen for poeng bruker en kombinasjon av den totale økningen i antall offentliggjorte eiere, endringer i porteføljeallokeringen til disse eierne og andre beregninger. Tallet går fra 0 til 100, der høyere tall indikerer en høyere grad av akkumulering i forhold til sammenlignbare selskaper, der 50 er gjennomsnittet.
Oppdateringsfrekvens: Daglig
Sjekk ut Ownership Explorer, som inneholder en liste over de høyest rangerte selskapene.
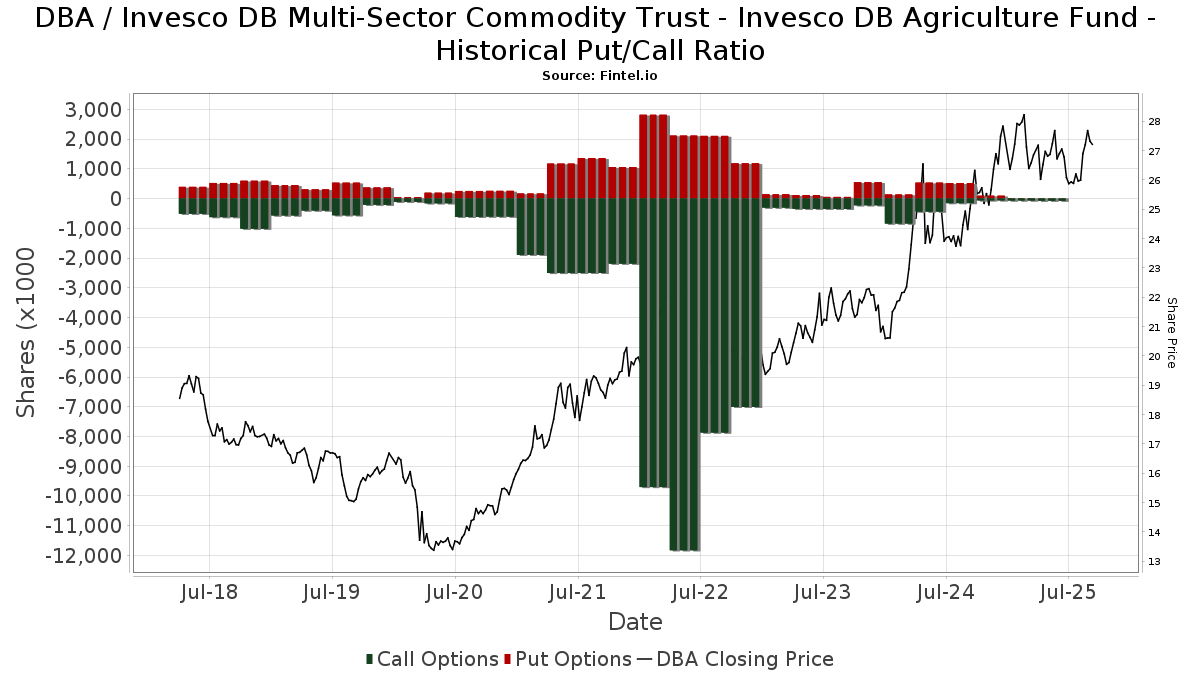
Institusjonell Put/Call-forhold
I tillegg til å rapportere standard aksje- og gjeldsemisjoner må institusjoner med mer enn 100 millioner kroner i forvaltningskapital også oppgi beholdningen av put- og callopsjoner. Siden put-opsjoner generelt indikerer et negativt sentiment, og call-opsjoner indikerer et positivt sentiment, kan vi få et inntrykk av det generelle institusjonelle sentimentet ved å plotte forholdet mellom put- og call-opsjoner. Diagrammet til høyre viser det historiske forholdet mellom put- og call-opsjoner for dette instrumentet.
Ved å bruke Put/Call-forholdet som en indikator på investorsentimentet kan man overvinne en av de viktigste svakhetene ved å bruke totalt institusjonelt eierskap, nemlig at en betydelig andel av forvaltningskapitalen investeres passivt for å følge indekser. Passivt forvaltede fond kjøper vanligvis ikke opsjoner, slik at indikatoren for put/call-forhold i større grad gjenspeiler stemningen i aktivt forvaltede fond.
13F- og NPORT-arkiveringer
Detaljer om 13F-arkiveringer er gratis. Detaljer om NP-arkiveringer krever et premium-medlemskap. Grønne rader indikerer nye posisjoner. Røde rader indikerer lukkede posisjoner. Klikk på lenke ikonet for å se hele transaksjonshistorikken.
Oppgrader
for å låse opp premiedata og eksportere til Excel. ![]() .
.
| Fildato | Kilde | Investor | Type | Gjennomsnittlig pris (estimert) |
Aksjer | Δ Aksjer (%) |
Rapportert verdi ($1000) | Verdi (%) | Portallokering (%) | |
|---|---|---|---|---|---|---|---|---|---|---|
| 2025-08-13 | 13F | VestGen Advisors, LLC | 76 917 | 2 011 | ||||||
| 2025-08-14 | 13F | Wiley Bros.-aintree Capital, Llc | 25 644 | 27,23 | 671 | 25,70 | ||||
| 2025-06-30 | NP | CAPTX - Canterbury Portfolio Thermostat Fund Institutional Shares | 14 945 | 0,00 | 401 | −2,91 | ||||
| 2025-08-12 | 13F | Jpmorgan Chase & Co | 427 297 | −25,44 | 11 174 | −25,98 | ||||
| 2025-08-08 | 13F | Creative Planning | 11 804 | 28,25 | 309 | 27,27 | ||||
| 2025-08-19 | 13F | Advisory Services Network, LLC | 0 | −100,00 | 0 | |||||
| 2025-07-01 | 13F | First National Bank Sioux Falls | 0 | −100,00 | 0 | |||||
| 2025-08-06 | 13F | Moors & Cabot, Inc. | 24 022 | 0,97 | 628 | 0,32 | ||||
| 2025-08-14 | 13F | Boston Private Wealth Llc | 0 | −100,00 | 0 | |||||
| 2025-07-21 | 13F | Ameritas Advisory Services, LLC | 200 | 5 | ||||||
| 2025-07-28 | 13F | Harbour Investments, Inc. | 4 654 | 45,17 | 122 | 44,05 | ||||
| 2025-07-25 | 13F | Atria Wealth Solutions, Inc. | 15 443 | 0,00 | 404 | −0,74 | ||||
| 2025-08-08 | 13F | Advyzon Investment Management, LLC | 8 424 | 220 | ||||||
| 2025-07-11 | 13F | Farther Finance Advisors, LLC | 26 | 0,00 | 1 | |||||
| 2025-08-19 | 13F | Asset Dedication, LLC | 140 | 0,00 | 4 | 0,00 | ||||
| 2025-09-04 | 13F/A | Advisor Group Holdings, Inc. | 214 622 | −1,43 | 5 612 | −2,13 | ||||
| 2025-08-14 | 13F | UBS Group AG | 107 952 | −42,79 | 2 823 | −43,22 | ||||
| 2025-08-14 | 13F/A | Rockefeller Capital Management L.P. | 61 559 | 4,51 | 1 610 | 3,74 | ||||
| 2025-08-14 | 13F | Federation des caisses Desjardins du Quebec | 89 | 0,00 | 2 | 0,00 | ||||
| 2025-08-14 | 13F | TCG Advisory Services, LLC | 0 | −100,00 | 0 | |||||
| 2025-07-11 | 13F | SILVER OAK SECURITIES, Inc | 37 906 | −3,49 | 991 | −4,62 | ||||
| 2025-08-12 | 13F | Blueprint Investment Partners LLC | 0 | −100,00 | 0 | |||||
| 2025-08-05 | 13F | Huntington National Bank | 105 | −0,95 | ||||||
| 2025-08-11 | 13F | Midwest Professional Planners, LTD. | 0 | −100,00 | 0 | |||||
| 2025-04-17 | 13F | FNY Investment Advisers, LLC | 0 | −100,00 | 0 | |||||
| 2025-08-04 | 13F | Atria Investments Llc | 19 307 | 3,81 | 505 | 3,07 | ||||
| 2025-07-17 | 13F | Janney Montgomery Scott LLC | 8 838 | 0,00 | 0 | |||||
| 2025-08-05 | 13F | Westside Investment Management, Inc. | 5 104 | 0,00 | 133 | −0,75 | ||||
| 2025-08-14 | 13F | Stifel Financial Corp | 91 648 | 3,10 | 2 397 | 2,35 | ||||
| 2025-07-01 | 13F | Harbor Investment Advisory, Llc | 3 033 | 0,00 | 79 | 0,00 | ||||
| 2025-08-12 | 13F | Picton Mahoney Asset Management | 2 170 | 30,72 | 0 | |||||
| 2025-07-25 | 13F | Sharp Financial Services, LLC | 19 200 | 6,67 | 502 | 5,91 | ||||
| 2025-06-24 | NP | TNMAX - 1290 Multi-Alternative Strategies Fund Class A | 30 740 | 21,79 | 824 | 18,39 | ||||
| 2025-08-13 | 13F | Quadrature Capital Ltd | 216 891 | 5 671 | ||||||
| 2025-07-23 | 13F | WestEnd Advisors, LLC | 3 910 | 102 | ||||||
| 2025-08-14 | 13F | Ameriprise Financial Inc | 165 033 | 28,03 | 4 289 | 26,27 | ||||
| 2025-08-06 | 13F | OneAscent Wealth Management LLC | 0 | −100,00 | 0 | |||||
| 2025-07-18 | 13F | PFG Investments, LLC | 15 008 | 3,62 | 392 | 2,89 | ||||
| 2025-08-08 | 13F | Hartland & Co., LLC | 471 | 0,00 | 12 | 0,00 | ||||
| 2025-08-13 | 13F | Cambria Investment Management, L.P. | 308 923 | −4,33 | 8 078 | −5,02 | ||||
| 2025-08-13 | 13F | Vermillion & White Wealth Management Group, LLC | 5 | 0,00 | 0 | |||||
| 2025-08-14 | 13F | Main Street Financial Solutions, LLC | 16 335 | 427 | ||||||
| 2025-08-12 | 13F | Global Retirement Partners, LLC | 7 476 | −11,80 | 195 | −13,33 | ||||
| 2025-07-29 | 13F | Sowa Financial Group, Inc. | 0 | −100,00 | 0 | |||||
| 2025-07-14 | 13F | AdvisorNet Financial, Inc | 4 800 | 0,00 | 126 | −0,79 | ||||
| 2025-08-14 | 13F | Private Wealth Advisors, LLC | 184 499 | −0,43 | 4 825 | −1,15 | ||||
| 2025-08-13 | 13F | Custom Index Systems, Llc | 17 511 | −4,60 | 458 | −5,38 | ||||
| 2025-07-10 | 13F | Signal Advisors Wealth, LLC | 8 424 | 0,00 | 220 | −0,45 | ||||
| 2025-08-12 | 13F | Accredited Wealth Management, LLC | 300 | −72,73 | 8 | −75,00 | ||||
| 2025-05-02 | 13F | Transcendent Capital Group LLC | 0 | −100,00 | 0 | |||||
| 2025-08-14 | 13F | Citadel Advisors Llc | Call | 8 900 | 20,27 | 233 | 19,59 | |||
| 2025-08-14 | 13F | Citadel Advisors Llc | 17 437 | −70,16 | 456 | −70,44 | ||||
| 2025-08-14 | 13F | Citadel Advisors Llc | Put | 10 000 | −43,82 | 262 | −44,23 | |||
| 2025-07-24 | 13F | Trust Co Of Toledo Na /oh/ | 5 527 | 145 | ||||||
| 2025-08-11 | 13F | Principal Securities, Inc. | 1 315 | 3 187,50 | 34 | 3 300,00 | ||||
| 2025-05-09 | 13F | GeoWealth Management, LLC | 0 | −100,00 | 0 | |||||
| 2025-05-13 | 13F | Bank Of Montreal /can/ | 0 | −100,00 | 0 | |||||
| 2025-07-24 | 13F | IFP Advisors, Inc | 7 058 | 212,58 | 185 | 211,86 | ||||
| 2025-07-16 | 13F | Perigon Wealth Management, LLC | 171 255 | 408,90 | 4 478 | 405,42 | ||||
| 2025-08-14 | 13F | Susquehanna International Group, Llp | 0 | −100,00 | 0 | |||||
| 2025-08-11 | 13F | Citigroup Inc | 791 | 21 | ||||||
| 2025-08-12 | 13F | Insigneo Advisory Services, Llc | 27 003 | 0,00 | 706 | −0,70 | ||||
| 2025-08-15 | 13F | Equitable Holdings, Inc. | 63 327 | 8,02 | 1 656 | 7,25 | ||||
| 2025-08-26 | NP | EQ ADVISORS TRUST - 1290 VT Multi-Alternative Strategies Portfolio Class IB | 14 570 | 3,70 | 381 | 2,97 | ||||
| 2025-08-08 | 13F | Avantax Advisory Services, Inc. | 93 071 | 8,49 | 2 434 | 7,70 | ||||
| 2025-05-28 | NP | GHTA - Goose Hollow Tactical Allocation ETF | 0 | −100,00 | 0 | −100,00 | ||||
| 2025-08-06 | 13F | Pekin Hardy Strauss, Inc. | 30 570 | −1,85 | 799 | −2,56 | ||||
| 2025-08-14 | 13F | Parallax Volatility Advisers, L.P. | 9 103 | 0,00 | 238 | −0,42 | ||||
| 2025-08-04 | 13F | Mesirow Financial Investment Management, Inc. | 54 243 | 3,83 | 1 418 | 3,05 | ||||
| 2025-08-12 | 13F | CIBC Private Wealth Group, LLC | 4 477 | 0,00 | 117 | 3,54 | ||||
| 2025-08-14 | 13F | GWM Advisors LLC | 7 671 | 0,00 | 201 | −0,99 | ||||
| 2025-08-14 | 13F | Daiwa Securities Group Inc. | 151 500 | 5,43 | 4 | 0,00 | ||||
| 2025-07-17 | 13F | Sound Income Strategies, LLC | 5 889 | 154 | ||||||
| 2025-07-08 | 13F | Nbc Securities, Inc. | 61 096 | −10,07 | 2 | 0,00 | ||||
| 2025-08-14 | 13F | Two Sigma Securities, Llc | 10 945 | 17,15 | 286 | 16,26 | ||||
| 2025-08-06 | 13F | Commonwealth Equity Services, Llc | 99 664 | 14,00 | 3 | 0,00 | ||||
| 2025-08-08 | 13F/A | Ignite Planners, LLC | 27 928 | 16,67 | 727 | 13,97 | ||||
| 2025-07-22 | 13F | Hillcrest Wealth Advisors - NY, LLC | 11 400 | 0,00 | 298 | −0,67 | ||||
| 2025-08-11 | 13F | Independent Advisor Alliance | 0 | −100,00 | 0 | |||||
| 2025-08-08 | 13F | Foundations Investment Advisors, LLC | 19 475 | −4,06 | 509 | −4,68 | ||||
| 2025-07-22 | 13F | Knights of Columbus Asset Advisors LLC | 3 314 | −19,93 | 87 | −21,10 | ||||
| 2025-05-14 | 13F | Walleye Trading LLC | Call | 0 | −100,00 | 0 | ||||
| 2025-04-24 | 13F | Wingate Wealth Advisors, Inc. | 0 | −100,00 | 0 | |||||
| 2025-05-16 | 13F | Coppell Advisory Solutions LLC | 0 | −100,00 | 0 | |||||
| 2025-07-25 | 13F | Cwm, Llc | 18 579 | 2,18 | 0 | |||||
| 2025-08-14 | 13F | Jane Street Group, Llc | 50 537 | −63,21 | 1 322 | −63,48 | ||||
| 2025-05-15 | 13F | Squarepoint Ops LLC | Call | 0 | −100,00 | 0 | ||||
| 2025-08-11 | 13F | FineMark National Bank & Trust | 0 | −100,00 | 0 | |||||
| 2025-08-08 | 13F | Pnc Financial Services Group, Inc. | 5 317 | 42,59 | 139 | 41,84 | ||||
| 2025-07-31 | 13F | Leavell Investment Management, Inc. | 0 | −100,00 | 0 | |||||
| 2025-08-01 | 13F | New York Life Investment Management Llc | 807 885 | −14,77 | 21 126 | −15,38 | ||||
| 2025-08-11 | 13F | TD Waterhouse Canada Inc. | 390 | −28,57 | 10 | −28,57 | ||||
| 2025-08-14 | 13F | Wells Fargo & Company/mn | 913 416 | −3,86 | 23 886 | −4,56 | ||||
| 2025-08-07 | 13F | Parkside Financial Bank & Trust | 90 | 0,00 | 2 | 0,00 | ||||
| 2025-08-12 | 13F | Financial Advocates Investment Management | 22 468 | −59,24 | 588 | −59,55 | ||||
| 2025-07-25 | 13F | We Are One Seven, LLC | 90 857 | 11,24 | 2 376 | 10,41 | ||||
| 2025-08-13 | 13F | Continuum Advisory, LLC | 0 | −100,00 | 0 | |||||
| 2025-08-14 | 13F | Mml Investors Services, Llc | 9 862 | 9,27 | 0 | |||||
| 2025-08-25 | 13F/A | Neuberger Berman Group LLC | 83 930 | 2 195 | ||||||
| 2025-07-24 | 13F | Ronald Blue Trust, Inc. | 0 | −100,00 | 0 | |||||
| 2025-07-30 | 13F | Mid-American Wealth Advisory Group, Inc. | 241 | 6 | ||||||
| 2025-08-14 | 13F | Modern Wealth Management, LLC | 15 769 | 0,69 | 412 | 0,00 | ||||
| 2025-04-29 | 13F | Hm Payson & Co | 0 | −100,00 | 0 | |||||
| 2025-08-14 | 13F | EP Wealth Advisors, Inc. | 45 750 | 1 196 | ||||||
| 2025-08-14 | 13F | Fmr Llc | 2 809 | 152,38 | 73 | 151,72 | ||||
| 2025-08-14 | 13F | Mercer Global Advisors Inc /adv | 40 000 | −50,00 | 1 046 | −50,36 | ||||
| 2025-08-08 | 13F | Passaic Partners LLC | 0 | −100,00 | 0 | |||||
| 2025-08-04 | 13F | Flagship Harbor Advisors, Llc | 30 970 | 6,75 | 810 | 5,89 | ||||
| 2025-05-16 | 13F/A | Kestra Investment Management, LLC | 0 | −100,00 | 0 | |||||
| 2025-07-24 | 13F | Eastern Bank | 0 | −100,00 | 0 | |||||
| 2025-07-14 | 13F | Painted Porch Advisors LLC | 275 | 0,00 | 7 | 0,00 | ||||
| 2025-08-12 | 13F | Steward Partners Investment Advisory, Llc | 43 381 | 2,85 | 1 134 | 2,07 | ||||
| 2025-08-12 | 13F | LPL Financial LLC | 249 201 | 14,10 | 6 517 | 13,28 | ||||
| 2025-07-31 | 13F | Intelligent Financial Strategies | 239 | 6 | ||||||
| 2025-07-11 | 13F | Caldwell Securities, Inc | 1 362 | 27,05 | 36 | 25,00 | ||||
| 2025-05-12 | 13F | Providence First Trust Co | 0 | −100,00 | 0 | |||||
| 2025-07-30 | 13F | Capital Wealth Alliance, LLC | 196 693 | −13,36 | 5 145 | −13,99 | ||||
| 2025-08-11 | 13F | ARS Investment Partners, LLC | 10 508 | −76,27 | 275 | −76,72 | ||||
| 2025-08-08 | 13F | Itau Unibanco Holding S.A. | 168 400 | 1,32 | 4 404 | 109 975,00 | ||||
| 2025-07-31 | 13F | Oppenheimer & Co Inc | 19 973 | 522 | ||||||
| 2025-07-23 | 13F | Tyche Wealth Partners LLC | 12 502 | 8,21 | 327 | 7,24 | ||||
| 2025-08-07 | 13F | Allworth Financial LP | 2 260 | 0,00 | 59 | −3,28 | ||||
| 2025-08-08 | 13F | Gts Securities Llc | 0 | −100,00 | 0 | |||||
| 2025-08-14 | 13F | Goldman Sachs Group Inc | 18 319 | 82,42 | 479 | 81,44 | ||||
| 2025-08-13 | 13F | Flow Traders U.s. Llc | 27 255 | −62,12 | 1 | −100,00 | ||||
| 2025-07-14 | 13F | Armstrong Advisory Group, Inc | 1 350 | 0,00 | 35 | 0,00 | ||||
| 2025-07-28 | 13F | Kiker Wealth Management, LLC | 115 | 0,00 | 3 | 0,00 | ||||
| 2025-08-14 | 13F | Bnp Paribas Arbitrage, Sa | 4 413 | −91,30 | 115 | −91,39 | ||||
| 2025-08-04 | 13F | Amplius Wealth Advisors, LLC | 10 840 | 0,00 | 283 | −0,70 | ||||
| 2025-04-15 | 13F | Simplicity Wealth,LLC | 0 | −100,00 | 0 | |||||
| 2025-07-21 | 13F | Hilltop National Bank | 705 | 18 | ||||||
| 2025-08-14 | 13F | Raymond James Financial Inc | 57 685 | −28,51 | 1 508 | −29,04 | ||||
| 2025-08-14 | 13F | Group One Trading, L.p. | 1 359 | 36 | ||||||
| 2025-05-06 | 13F | WT Wealth Management | 23 682 | 38,43 | 624 | 37,22 | ||||
| 2025-07-30 | 13F | Bogart Wealth, LLC | 3 000 | 0,00 | 78 | −1,27 | ||||
| 2025-08-13 | 13F | Barclays Plc | 0 | −100,00 | 0 | |||||
| 2025-07-15 | 13F | Fifth Third Bancorp | 10 800 | 0,00 | 282 | −0,70 | ||||
| 2025-08-11 | 13F | Duff & Phelps Investment Management Co | 20 525 | 130,62 | 537 | 129,06 | ||||
| 2025-08-13 | 13F | Jones Financial Companies Lllp | 219 | 6 | ||||||
| 2025-07-30 | 13F | D.a. Davidson & Co. | 30 221 | 40,96 | 790 | 40,07 | ||||
| 2025-08-14 | 13F | Susquehanna International Group, Llp | Call | 60 800 | 10,75 | 1 590 | 9,89 | |||
| 2025-07-07 | 13F | Park Edge Advisors, LLC | 11 554 | −17,08 | 302 | −17,71 | ||||
| 2025-06-27 | NP | GMOM - Cambria Global Momentum ETF | 228 998 | −6,32 | 6 139 | −9,01 | ||||
| 2025-08-25 | NP | MAINSTAY VP FUNDS TRUST - MainStay VP IQ Hedge Multi-Strategy Portfolio Initial Class | 179 800 | −19,90 | 4 702 | −20,48 | ||||
| 2025-08-14 | 13F | Hrt Financial Lp | 25 881 | 1 | ||||||
| 2025-08-15 | 13F | Kestra Advisory Services, LLC | 483 845 | 11,17 | 12 653 | 10,37 | ||||
| 2025-08-04 | 13F | Creekmur Asset Management LLC | 399 | −0,25 | 10 | 0,00 | ||||
| 2025-08-06 | 13F | Adviser Investments LLC | 12 583 | 0,00 | 329 | −0,60 | ||||
| 2025-08-07 | 13F | Guardian Partners Inc. | 26 096 | 24,55 | 677 | 19,65 | ||||
| 2025-04-25 | 13F | Perissos Private Wealth Management, LLC | 0 | −100,00 | 0 | |||||
| 2025-07-14 | 13F | Savior LLC | 64 845 | 10,12 | 1 696 | 9,28 | ||||
| 2025-05-15 | 13F | IHT Wealth Management, LLC | 0 | −100,00 | 0 | |||||
| 2025-08-04 | 13F | Spire Wealth Management | 46 728 | 1,08 | 1 222 | 0,33 | ||||
| 2025-05-09 | 13F | Plan Group Financial, LLC | 0 | −100,00 | 0 | −100,00 | ||||
| 2025-08-01 | 13F | Envestnet Asset Management Inc | 31 121 | −19,29 | 814 | −19,90 | ||||
| 2025-07-17 | 13F | Vermillion Wealth Management, Inc. | 2 061 | 0,00 | 54 | −1,85 | ||||
| 2025-08-05 | 13F | Key FInancial Inc | 1 860 | 0,00 | 49 | 0,00 | ||||
| 2025-08-01 | 13F | Solstein Capital, LLC | 20 523 | 0,00 | 537 | −0,74 | ||||
| 2025-08-14 | 13F | Manufacturers Life Insurance Company, The | 87 229 | 48,54 | 2 281 | 47,54 | ||||
| 2025-08-14 | 13F | Comerica Bank | 5 547 | 0,00 | 145 | −0,68 | ||||
| 2025-08-12 | 13F | Weaver Consulting Group | 10 640 | 0,00 | 278 | −0,71 | ||||
| 2025-08-14 | 13F | CIBC World Markets Inc. | 22 772 | 107,83 | 595 | 106,60 | ||||
| 2025-08-08 | 13F | Larson Financial Group LLC | 1 486 | 0,00 | 39 | −2,56 | ||||
| 2025-08-14 | 13F | Qube Research & Technologies Ltd | 0 | −100,00 | 0 | |||||
| 2025-04-28 | 13F | Heritage Oak Wealth Advisors Llc | 0 | −100,00 | 0 | |||||
| 2025-08-15 | 13F | Morgan Stanley | 709 984 | −33,66 | 18 566 | −34,13 | ||||
| 2025-07-10 | 13F | Clare Market Investments LLC | 15 915 | 14,99 | 416 | 14,29 | ||||
| 2025-07-16 | 13F | BOS Asset Management, LLC | 8 489 | 0,00 | 222 | −0,90 | ||||
| 2025-08-26 | NP | PDPAX - Virtus Rampart Alternatives Diversifier Fund Class A | 20 525 | 130,62 | 537 | 129,06 | ||||
| 2025-08-08 | 13F | Citizens Financial Group Inc/ri | 121 676 | −0,58 | 3 182 | −1,30 | ||||
| 2025-08-13 | 13F | 1832 Asset Management L.P. | 555 547 | 8,46 | 14 528 | 7,67 | ||||
| 2025-08-14 | 13F | Ancora Advisors, LLC | 100 | 0,00 | 3 | 0,00 | ||||
| 2025-08-12 | 13F | Proequities, Inc. | 0 | 0 | ||||||
| 2025-08-14 | 13F | Bank Of America Corp /de/ | 698 437 | −0,98 | 18 264 | −1,69 | ||||
| 2025-07-24 | 13F | Us Bancorp \de\ | 125 | 3 | ||||||
| 2025-08-11 | 13F | HighTower Advisors, LLC | 471 132 | 0,30 | 12 320 | −0,42 | ||||
| 2025-08-13 | 13F | M Holdings Securities, Inc. | 16 654 | 0 | ||||||
| 2025-05-12 | 13F | Kohmann Bosshard Financial Services, LLC | 0 | −100,00 | 0 | |||||
| 2025-08-18 | 13F/A | National Bank Of Canada /fi/ | 30 905 | −0,80 | 808 | −1,59 | ||||
| 2025-08-14 | 13F | Royal Bank Of Canada | 111 102 | −3,23 | 2 905 | −3,94 | ||||
| 2025-07-31 | 13F | Cambridge Investment Research Advisors, Inc. | 33 539 | 9,81 | 1 | |||||
| 2025-08-05 | 13F | Intellectus Partners, LLC | 33 345 | 0,00 | 872 | −0,80 | ||||
| 2025-08-08 | 13F | Cetera Investment Advisers | 98 219 | −10,32 | 2 568 | −10,96 | ||||
| 2025-08-15 | 13F | Tower Research Capital LLC (TRC) | 22 | 22,22 | 1 | |||||
| 2025-07-09 | 13F | Camelot Technology Advisors, Inc. | 25 274 | −11,95 | 661 | −12,70 | ||||
| 2025-08-13 | 13F | Northwestern Mutual Wealth Management Co | 247 | 6 | ||||||
| 2025-08-08 | 13F | Kingsview Wealth Management, LLC | 10 649 | −10,95 | 278 | −11,46 | ||||
| 2025-08-14 | 13F | Glen Eagle Advisors, LLC | 500 | 0,00 | 13 | 0,00 | ||||
| 2025-06-25 | NP | QAI - IQ Hedge Multi-Strategy Tracker ETF | 606 448 | −14,25 | 16 259 | −16,71 | ||||
| 2025-08-19 | 13F | National Asset Management, Inc. | 44 250 | 32,73 | 1 157 | 30,59 | ||||
| 2025-08-14 | 13F | Colony Group, LLC | 27 227 | 10,63 | 712 | 9,72 | ||||
| 2025-06-27 | NP | TRTY - Cambria Trinity ETF | 79 925 | −3,39 | 2 143 | −6,18 | ||||
| 2025-05-14 | 13F | Susquehanna International Group, Llp | Put | 0 | −100,00 | 0 | −100,00 |