Grunnleggende statistikk
| Institusjonelle eiere | 205 total, 199 long only, 2 short only, 4 long/short - change of 3,52% MRQ |
| Gjennomsnittlig porteføljeallokering | 0.1268 % - change of −13,14% MRQ |
| Institusjonelle aksjer (Long) | 17 928 223 (ex 13D/G) - change of −1,25MM shares −6,50% MRQ |
| Institusjonell verdi (Long) | $ 621 625 USD ($1000) |
Institusjonelt eierskap og aksjonærer
Global X Funds - Global X Copper Miners ETF (US:COPX) har 205 institusjonelle eiere og aksjonærer som har sendt inn 13D/G- eller 13F-skjemaer til Securities Exchange Commission (SEC). Disse institusjonene eier til sammen 17,960,243 aksjer. De største aksjonærene inkluderer MIRAE ASSET GLOBAL ETFS HOLDINGS Ltd., Price T Rowe Associates Inc /md/, PRAFX - T. Rowe Price Real Assets Fund, Inc., Invesco Ltd., VSCAX - Invesco Small Cap Value Fund Class A, Jpmorgan Chase & Co, Morgan Stanley, Bank Of America Corp /de/, Fielder Capital Group LLC, and LPL Financial LLC .
Global X Funds - Global X Copper Miners ETF (ARCA:COPX) institusjonell eierstruktur viser nåværende posisjoner i selskapet fordelt på institusjoner og fond, samt de siste endringene i posisjonsstørrelse. De største aksjonærene kan være individuelle investorer, verdipapirfond, hedgefond eller institusjoner. Schedule 13D indikerer at investoren eier (eller har eid) mer enn 5 % av selskapet og har til hensikt (eller hadde til hensikt) å aktivt forfølge en endring i forretningsstrategien. Schedule 13G indikerer en passiv investering på over 5 %.
The share price as of September 12, 2025 is 53,40 / share. Previously, on September 13, 2024, the share price was 41,35 / share. This represents an increase of 29,14% over that period.

Fondssentiment-score
Fondssentiment Score (også kjent som akkumulering av eierskap poengsum) viser hvilke aksjer som er mest kjøpt av fond. Den er resultatet av en sofistikert, kvantitativ flerfaktormodell som identifiserer selskaper med de høyeste nivåene av institusjonell akkumulering. Beregningsmodellen for poeng bruker en kombinasjon av den totale økningen i antall offentliggjorte eiere, endringer i porteføljeallokeringen til disse eierne og andre beregninger. Tallet går fra 0 til 100, der høyere tall indikerer en høyere grad av akkumulering i forhold til sammenlignbare selskaper, der 50 er gjennomsnittet.
Oppdateringsfrekvens: Daglig
Sjekk ut Ownership Explorer, som inneholder en liste over de høyest rangerte selskapene.
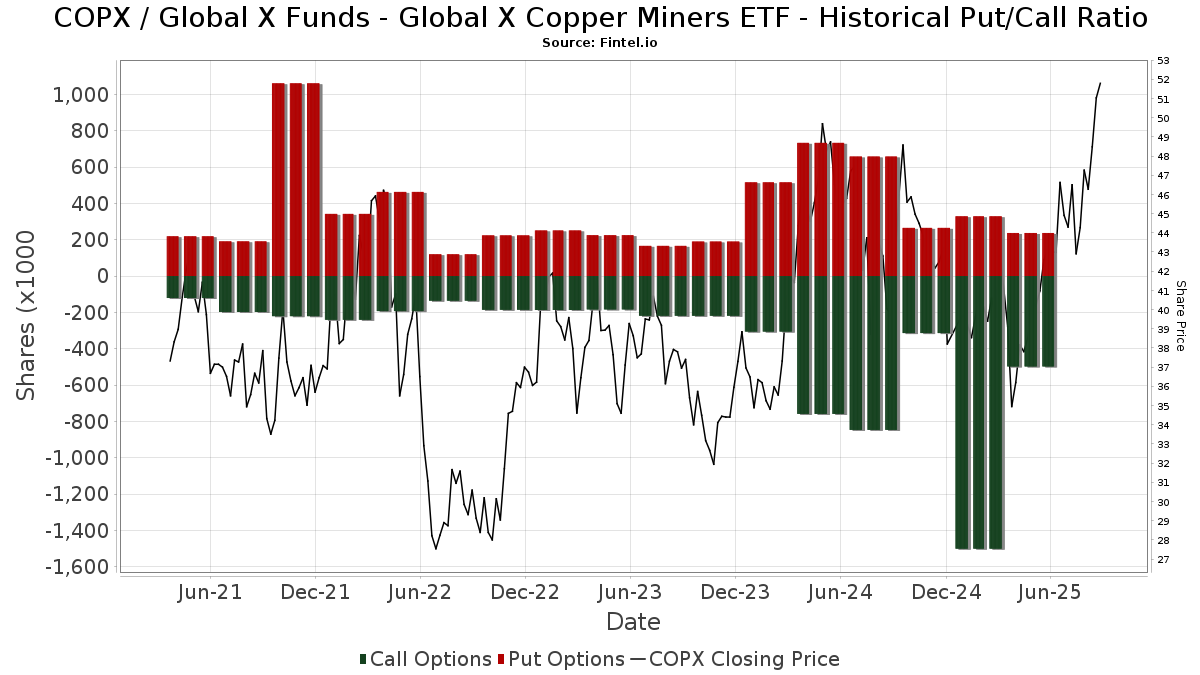
Institusjonell Put/Call-forhold
I tillegg til å rapportere standard aksje- og gjeldsemisjoner må institusjoner med mer enn 100 millioner kroner i forvaltningskapital også oppgi beholdningen av put- og callopsjoner. Siden put-opsjoner generelt indikerer et negativt sentiment, og call-opsjoner indikerer et positivt sentiment, kan vi få et inntrykk av det generelle institusjonelle sentimentet ved å plotte forholdet mellom put- og call-opsjoner. Diagrammet til høyre viser det historiske forholdet mellom put- og call-opsjoner for dette instrumentet.
Ved å bruke Put/Call-forholdet som en indikator på investorsentimentet kan man overvinne en av de viktigste svakhetene ved å bruke totalt institusjonelt eierskap, nemlig at en betydelig andel av forvaltningskapitalen investeres passivt for å følge indekser. Passivt forvaltede fond kjøper vanligvis ikke opsjoner, slik at indikatoren for put/call-forhold i større grad gjenspeiler stemningen i aktivt forvaltede fond.
13F- og NPORT-arkiveringer
Detaljer om 13F-arkiveringer er gratis. Detaljer om NP-arkiveringer krever et premium-medlemskap. Grønne rader indikerer nye posisjoner. Røde rader indikerer lukkede posisjoner. Klikk på lenke ikonet for å se hele transaksjonshistorikken.
Oppgrader
for å låse opp premiedata og eksportere til Excel. ![]() .
.
| Fildato | Kilde | Investor | Type | Gjennomsnittlig pris (estimert) |
Aksjer | Δ Aksjer (%) |
Rapportert verdi ($1000) | Verdi (%) | Portallokering (%) | |
|---|---|---|---|---|---|---|---|---|---|---|
| 2025-08-01 | 13F | Advisory Alpha, LLC | 9 475 | −0,28 | 426 | 14,82 | ||||
| 2025-08-12 | 13F | Jpmorgan Chase & Co | 759 883 | 770,45 | 34 195 | 902,76 | ||||
| 2025-07-18 | 13F | Truist Financial Corp | 15 814 | 18,13 | 712 | 35,95 | ||||
| 2025-08-11 | 13F | Private Advisor Group, LLC | 40 736 | −6,67 | 1 833 | 7,51 | ||||
| 2025-07-31 | 13F | Cambridge Investment Research Advisors, Inc. | 22 341 | 4,75 | 1 | |||||
| 2025-08-11 | 13F | TD Waterhouse Canada Inc. | 201 | 9 | ||||||
| 2025-08-14 | 13F | Boothbay Fund Management, Llc | 0 | −100,00 | 0 | |||||
| 2025-08-14 | 13F | Aqr Capital Management Llc | 4 900 | 220 | ||||||
| 2025-08-12 | 13F | Picton Mahoney Asset Management | 3 600 | 0,00 | 0 | |||||
| 2025-08-13 | 13F | Invesco Ltd. | 1 312 149 | 3,14 | 59 047 | 18,80 | ||||
| 2025-08-26 | NP | PRAFX - T. Rowe Price Real Assets Fund, Inc. This fund is a listed as child fund of Price T Rowe Associates Inc /md/ and if that institution has disclosed ownership in this security, then these positions will not be double counted when calculating total shares and total value | 1 384 481 | 0,00 | 62 302 | 15,18 | ||||
| 2025-08-14 | 13F | Millennium Management Llc | 22 271 | 78,14 | 1 002 | 105,33 | ||||
| 2025-05-09 | 13F | GeoWealth Management, LLC | 0 | −100,00 | 0 | |||||
| 2025-08-13 | 13F | Bank Of Nova Scotia | 0 | −100,00 | 0 | |||||
| 2025-08-14 | 13F/A | Barclays Plc | 51 906 | −5,47 | 2 | 0,00 | ||||
| 2025-08-14 | 13F | Qube Research & Technologies Ltd | 41 357 | 3 105,97 | 1 861 | 3 622,00 | ||||
| 2025-08-14 | 13F | Citadel Advisors Llc | Put | 113 800 | −19,46 | 5 121 | −7,23 | |||
| 2025-08-14 | 13F | Marathon Capital Management | 6 594 | 6,63 | 297 | 22,82 | ||||
| 2025-08-14 | 13F | Citadel Advisors Llc | Call | 180 700 | 181,46 | 8 132 | 224,20 | |||
| 2025-08-14 | 13F | Citadel Advisors Llc | 17 742 | −87,48 | 798 | −85,59 | ||||
| 2025-07-16 | 13F | ORG Partners LLC | 1 105 | 4 320,00 | 50 | |||||
| 2025-07-30 | 13F | Birch Hill Investment Advisors LLC | 29 020 | −0,75 | 1 306 | 14,27 | ||||
| 2025-07-22 | 13F | Valley National Advisers Inc | 2 664 | 0,00 | 0 | |||||
| 2025-08-18 | 13F/A | National Bank Of Canada /fi/ | 8 576 | 26,40 | 386 | 45,28 | ||||
| 2025-07-28 | 13F | J.Safra Asset Management Corp | 3 858 | 0,00 | 173 | 15,33 | ||||
| 2025-05-02 | 13F | Wealthfront Advisers Llc | 0 | −100,00 | 0 | −100,00 | ||||
| 2025-07-15 | 13F | SJS Investment Consulting Inc. | 140 | 0,00 | 6 | 20,00 | ||||
| 2025-08-29 | NP | HSZAX - Highland Small-Cap Equity Fund Class A | Short | −1 650 | −0,00 | −74 | 15,63 | |||
| 2025-07-03 | 13F | Garde Capital, Inc. | 9 489 | 7,29 | 427 | 23,77 | ||||
| 2025-07-21 | 13F | Ameriflex Group, Inc. | 3 046 | 0,00 | 139 | 16,95 | ||||
| 2025-07-10 | 13F | Kozak & Associates, Inc. | 8 | 0,00 | 0 | |||||
| 2025-08-14 | 13F | Old Mission Capital Llc | 0 | −100,00 | 0 | |||||
| 2025-08-12 | 13F | Pathstone Holdings, LLC | 5 702 | 0,00 | 257 | 15,32 | ||||
| 2025-08-15 | 13F/A | Symphony Financial, Ltd. Co. | 39 178 | 1 826 | ||||||
| 2025-07-29 | 13F | Stephens Inc /ar/ | 5 590 | −9,47 | 252 | 4,15 | ||||
| 2025-08-14 | 13F | Mml Investors Services, Llc | 24 395 | −1,13 | 1 | |||||
| 2025-07-31 | 13F | WFA Asset Management Corp | 544 | 25 | ||||||
| 2025-08-08 | 13F | Compass Financial Services Inc | 20 | 0,00 | 1 | |||||
| 2025-04-22 | 13F | Bright Futures Wealth Management, LLC. | 24 676 | −6,06 | 896 | −11,46 | ||||
| 2025-08-01 | 13F | Mizuho Markets Americas Llc | 19 934 | −61,78 | 897 | −55,96 | ||||
| 2025-08-12 | 13F | Park Square Financial Group, LLC | 99 | 30,26 | 4 | 100,00 | ||||
| 2025-08-12 | 13F | Proequities, Inc. | 0 | 0 | ||||||
| 2025-08-07 | 13F | Rathbone Brothers plc | 18 494 | −0,15 | 832 | 15,08 | ||||
| 2025-08-08 | 13F | SBI Securities Co., Ltd. | 473 | −3,27 | 21 | 10,53 | ||||
| 2025-08-14 | 13F | BTG Pactual Asset Management US LLC | 23 188 | 1 043 | ||||||
| 2025-05-13 | 13F | Hartland & Co., LLC | 0 | −100,00 | 0 | |||||
| 2025-07-17 | 13F | Sound Income Strategies, LLC | 22 | 0,00 | 1 | |||||
| 2025-08-04 | 13F | Quaker Wealth Management, LLC | Put | 0 | −100,00 | 0 | −100,00 | |||
| 2025-05-09 | 13F | Blair William & Co/il | 0 | −100,00 | 0 | −100,00 | ||||
| 2025-07-16 | 13F | Signaturefd, Llc | 76 | −39,20 | 3 | −25,00 | ||||
| 2025-08-08 | 13F | Cetera Investment Advisers | 24 141 | −2,32 | 1 086 | 12,54 | ||||
| 2025-08-05 | 13F | Tsfg, Llc | 200 | 0,00 | 0 | |||||
| 2025-07-30 | 13F | Denali Advisors Llc | 16 031 | −0,91 | 721 | 14,08 | ||||
| 2025-05-08 | 13F | Geneos Wealth Management Inc. | 0 | −100,00 | 0 | |||||
| 2025-07-24 | 13F | IFP Advisors, Inc | 450 | 350,00 | 20 | 566,67 | ||||
| 2025-08-14 | 13F | Financial Advisory Service, Inc. | 53 | 15,22 | 2 | 100,00 | ||||
| 2025-05-08 | 13F | Us Bancorp \de\ | 0 | −100,00 | 0 | |||||
| 2025-08-14 | 13F/A | Rockefeller Capital Management L.P. | 184 126 | 6,24 | 8 286 | 22,36 | ||||
| 2025-08-14 | 13F | D. E. Shaw & Co., Inc. | 38 166 | 608,75 | 1 717 | 717,62 | ||||
| 2025-07-10 | 13F | Wealth Enhancement Advisory Services, Llc | 46 617 | 2,99 | 2 166 | 22,45 | ||||
| 2025-07-17 | 13F | DiNuzzo Private Wealth, Inc. | 77 | 0,00 | 3 | 0,00 | ||||
| 2025-08-13 | 13F | Dynamic Wealth Strategies, LLC | 38 941 | 47,48 | 1 752 | 69,93 | ||||
| 2025-08-14 | 13F | Operose Advisors LLC | 107 | 5 | ||||||
| 2025-05-07 | 13F | Inspire Advisors, LLC | 0 | −100,00 | 0 | |||||
| 2025-09-04 | 13F/A | Advisor Group Holdings, Inc. | 46 089 | 26,89 | 2 012 | 41,72 | ||||
| 2025-08-14 | 13F | Wells Fargo & Company/mn | 227 736 | −3,28 | 10 248 | 11,40 | ||||
| 2025-04-28 | 13F | Buffington Mohr McNeal | 0 | −100,00 | 0 | |||||
| 2025-08-14 | 13F | Clark Capital Management Group, Inc. | 100 260 | −0,89 | 4 512 | 14,14 | ||||
| 2025-07-24 | 13F | Robertson Stephens Wealth Management, LLC | 7 850 | 0,00 | 355 | 16,01 | ||||
| 2025-08-13 | 13F | Northwestern Mutual Wealth Management Co | 57 407 | 9,75 | 2 583 | 26,43 | ||||
| 2025-08-13 | 13F | Capital Fund Management S.a. | 74 224 | −8,39 | 3 340 | 5,53 | ||||
| 2025-08-12 | 13F | Tocqueville Asset Management L.p. | 6 450 | 290 | ||||||
| 2025-08-06 | 13F | First Horizon Advisors, Inc. | 154 | 7 | ||||||
| 2025-08-14 | 13F | Snowden Capital Advisors LLC | 6 178 | 279 | ||||||
| 2025-08-08 | 13F | Capital Investment Advisory Services, LLC | 300 | 0,00 | 14 | 18,18 | ||||
| 2025-08-19 | 13F | National Asset Management, Inc. | 0 | −100,00 | 0 | |||||
| 2025-08-14 | 13F | Jane Street Group, Llc | 0 | −100,00 | 0 | |||||
| 2025-07-29 | 13F | Angeles Wealth Management, Llc | 0 | −100,00 | 0 | |||||
| 2025-08-14 | 13F | CIBC World Markets Inc. | 38 266 | −16,96 | 1 722 | −4,39 | ||||
| 2025-08-13 | 13F | Continuum Advisory, LLC | 0 | −100,00 | 0 | |||||
| 2025-07-28 | 13F | Harbour Investments, Inc. | 531 | −7,17 | 24 | 4,55 | ||||
| 2025-07-11 | 13F | Farther Finance Advisors, LLC | 3 507 | 158 | ||||||
| 2025-07-31 | 13F | 180 Wealth Advisors, Llc | 19 789 | 20,61 | 891 | 38,85 | ||||
| 2025-07-28 | 13F | Pettinga Financial Advisors, LLC | 26 350 | 22,08 | 1 186 | 40,57 | ||||
| 2025-07-14 | 13F | AdvisorNet Financial, Inc | 262 | 0,00 | 12 | 10,00 | ||||
| 2025-08-05 | 13F | Bank Of Montreal /can/ | 11 174 | −83,97 | 503 | −81,56 | ||||
| 2025-08-13 | 13F | IAG Wealth Partners, LLC | 310 | 0,00 | 14 | 8,33 | ||||
| 2025-08-14 | 13F | Millennium Management Llc | Call | 0 | −100,00 | 0 | −100,00 | |||
| 2025-08-14 | 13F | Comerica Bank | 3 472 | 0,00 | 156 | 15,56 | ||||
| 2025-07-14 | 13F | Sowell Financial Services LLC | 8 106 | 0,00 | 365 | 15,19 | ||||
| 2025-08-06 | 13F | Pekin Hardy Strauss, Inc. | 9 845 | −14,17 | 443 | −1,12 | ||||
| 2025-05-12 | 13F | Basso Capital Management, L.p. | 0 | −100,00 | 0 | |||||
| 2025-08-11 | 13F | GKV Capital Management Co., Inc. | 0 | −100,00 | 0 | −100,00 | ||||
| 2025-04-15 | 13F | Ibex Wealth Advisors | 0 | −100,00 | 0 | |||||
| 2025-08-14 | 13F | Cohen & Steers, Inc. | 0 | −100,00 | 0 | |||||
| 2025-08-14 | 13F | MIRAE ASSET GLOBAL ETFS HOLDINGS Ltd. | 4 193 338 | 9,75 | 188 323 | 23,19 | ||||
| 2025-08-11 | 13F | HighTower Advisors, LLC | 6 746 | −33,17 | 304 | −23,10 | ||||
| 2025-08-14 | 13F | Great Valley Advisor Group, Inc. | 4 478 | 202 | ||||||
| 2025-08-13 | 13F | Scotia Capital Inc. | 11 266 | 3,30 | 507 | 18,78 | ||||
| 2025-08-11 | 13F | Sprott Inc. | 12 435 | 560 | ||||||
| 2025-08-14 | 13F | Raymond James Financial Inc | 71 656 | 11,10 | 3 225 | 27,99 | ||||
| 2025-08-05 | 13F | Huntington National Bank | 0 | |||||||
| 2025-08-12 | 13F | MAI Capital Management | 100 | 0,00 | 4 | 33,33 | ||||
| 2025-08-06 | 13F | AE Wealth Management LLC | 441 | 8,62 | 20 | 26,67 | ||||
| 2025-08-14 | 13F | Ameriprise Financial Inc | 255 960 | 13,07 | 11 519 | 30,23 | ||||
| 2025-08-14 | 13F | Bluefin Capital Management, Llc | 7 134 | 321 | ||||||
| 2025-08-11 | 13F | Citigroup Inc | 14 578 | −66,83 | 656 | −61,79 | ||||
| 2025-06-30 | NP | VSCAX - Invesco Small Cap Value Fund Class A | 1 312 149 | 3,14 | 49 612 | 2,14 | ||||
| 2025-07-17 | 13F | BFI Infinity Ltd. | 5 605 | 0,00 | 252 | 15,60 | ||||
| 2025-08-13 | 13F | Quadrature Capital Ltd | 0 | −100,00 | 0 | |||||
| 2025-08-01 | 13F | Bessemer Group Inc | 0 | −100,00 | 0 | |||||
| 2025-08-07 | 13F | Proficio Capital Partners LLC | 33 050 | 1 487 | ||||||
| 2025-05-29 | NP | Cohen & Steers Closed-end Opportunity Fund, Inc. | 13 000 | 0,00 | 508 | 2,22 | ||||
| 2025-08-06 | 13F | Black Swift Group, LLC | 52 475 | 107,00 | 2 361 | 138,48 | ||||
| 2025-07-28 | 13F | Smart Portfolios, LLC | 16 577 | −2,86 | 746 | 11,86 | ||||
| 2025-08-12 | 13F | Howe & Rusling Inc | 0 | −100,00 | 0 | |||||
| 2025-08-13 | 13F | Summit Financial, LLC | 37 622 | 0,33 | 1 702 | 16,18 | ||||
| 2025-07-25 | 13F | Hazlett, Burt & Watson, Inc. | 440 | 0,00 | 0 | |||||
| 2025-08-04 | 13F | Creative Financial Designs Inc /adv | 1 591 | 0,00 | 72 | 14,52 | ||||
| 2025-07-29 | 13F | JTC Employer Solutions Trusteee Ltd | 606 | 0,00 | 0 | |||||
| 2025-08-07 | 13F | Valence8 US LP | 50 266 | 2 262 | ||||||
| 2025-08-19 | 13F | Cape Investment Advisory, Inc. | 5 | 0,00 | 0 | |||||
| 2025-08-13 | 13F | Capula Management Ltd | 45 974 | −37,13 | 2 069 | −27,62 | ||||
| 2025-07-08 | 13F | Lowe Wealth Advisors, LLC | 57 406 | 5,97 | 2 583 | 22,07 | ||||
| 2025-08-14 | 13F | Graham Capital Management, L.P. | 26 500 | 1 192 | ||||||
| 2025-08-25 | 13F/A | Neuberger Berman Group LLC | 171 088 | 0,08 | 7 699 | 15,26 | ||||
| 2025-05-15 | 13F | Tudor Investment Corp Et Al | 0 | −100,00 | 0 | −100,00 | ||||
| 2025-08-12 | 13F | SRS Capital Advisors, Inc. | 663 | 30 | ||||||
| 2025-08-06 | 13F | Ipsen Advisor Group LLC | 41 616 | 6,93 | 1 873 | 23,16 | ||||
| 2025-08-14 | 13F | Toronto Dominion Bank | 0 | −100,00 | 0 | |||||
| 2025-08-14 | 13F | Group One Trading, L.p. | 20 820 | −51,78 | 937 | −44,48 | ||||
| 2025-04-21 | 13F | Ronald Blue Trust, Inc. | 0 | −100,00 | 0 | |||||
| 2025-08-13 | 13F | Navis Wealth Advisors, LLC | 4 810 | 216 | ||||||
| 2025-08-13 | 13F | Laidlaw Wealth Management LLC | 0 | −100,00 | 0 | |||||
| 2025-08-14 | 13F | Price T Rowe Associates Inc /md/ | 3 628 983 | 4,80 | 163 | 20,74 | ||||
| 2025-08-14 | 13F | UBS Group AG | Call | 4 688 | −96,38 | 211 | −95,85 | |||
| 2025-07-22 | 13F | Inlight Wealth Management, LLC | 2 100 | 0,00 | 94 | 14,63 | ||||
| 2025-08-14 | 13F | UBS Group AG | 306 911 | −49,61 | 13 811 | −41,97 | ||||
| 2025-07-15 | 13F | West Oak Capital, LLC | 115 | 0,00 | 0 | |||||
| 2025-08-14 | 13F | Bank Of America Corp /de/ | 494 342 | −13,40 | 22 245 | −0,26 | ||||
| 2025-05-15 | 13F | Alphadyne Asset Management, LLC | Call | 0 | −100,00 | 0 | ||||
| 2025-08-12 | 13F | O'shaughnessy Asset Management, Llc | 21 | −72,37 | 1 | −100,00 | ||||
| 2025-08-06 | 13F | Tradewinds, LLC. | 0 | −100,00 | 0 | |||||
| 2025-08-14 | 13F | Abound Financial, Llc | 0 | −100,00 | 0 | |||||
| 2025-09-10 | 13F | WT Wealth Management | 17 042 | 28,11 | 767 | 47,59 | ||||
| 2025-07-08 | 13F | GK Wealth Management LLC | 5 017 | 226 | ||||||
| 2025-08-08 | 13F | SG Americas Securities, LLC | 14 562 | −82,62 | 1 | −100,00 | ||||
| 2025-08-14 | 13F | Gen-Wealth Partners Inc | 234 | 11 | ||||||
| 2025-07-29 | 13F | Stratos Wealth Partners, LTD. | 8 006 | 360 | ||||||
| 2025-07-14 | 13F | Park Avenue Securities Llc | 7 816 | 8,39 | 0 | |||||
| 2025-08-12 | 13F | Putnam Fl Investment Management Co | 4 660 | 210 | ||||||
| 2025-07-11 | 13F | First PREMIER Bank | 3 500 | 0,00 | 0 | |||||
| 2025-08-13 | 13F | Flow Traders U.s. Llc | 0 | −100,00 | 0 | |||||
| 2025-07-18 | 13F | PFG Investments, LLC | 0 | −100,00 | 0 | |||||
| 2025-07-31 | 13F | AlTi Global, Inc. | 0 | −100,00 | 0 | |||||
| 2025-08-14 | 13F | Goldman Sachs Group Inc | 16 692 | −33,27 | 751 | −23,13 | ||||
| 2025-08-14 | 13F | Barometer Capital Management Inc. | 12 500 | 83,82 | 562 | 112,08 | ||||
| 2025-07-28 | 13F | Wealthspan Partners, Llc | 12 634 | −6,42 | 569 | 7,78 | ||||
| 2025-08-05 | 13F | Sigma Planning Corp | 8 077 | 365 | ||||||
| 2025-08-12 | 13F | AlphaCore Capital LLC | 260 | 12 | ||||||
| 2025-08-14 | 13F | Jane Street Group, Llc | Put | 21 500 | −21,25 | 968 | −9,29 | |||
| 2025-07-30 | 13F | Whittier Trust Co Of Nevada Inc | 230 | −63,49 | 10 | −58,33 | ||||
| 2025-05-14 | 13F | Renaissance Technologies Llc | 0 | −100,00 | 0 | |||||
| 2025-07-21 | 13F | Ameritas Advisory Services, LLC | 21 421 | 8,65 | 964 | 25,06 | ||||
| 2025-05-14 | 13F | HITE Hedge Asset Management LLC | 0 | −100,00 | 0 | |||||
| 2025-08-14 | 13F | Brevan Howard Capital Management LP | 0 | −100,00 | 0 | |||||
| 2025-08-14 | 13F | Jane Street Group, Llc | Call | 8 000 | 11,11 | 360 | 28,11 | |||
| 2025-07-15 | 13F | Main Street Group, LTD | 1 360 | 0,00 | 61 | 15,09 | ||||
| 2025-08-11 | 13F | Principal Securities, Inc. | 6 118 | 55,67 | 275 | 83,33 | ||||
| 2025-08-01 | 13F | Ashton Thomas Private Wealth, LLC | 6 851 | 14,32 | 310 | 32,48 | ||||
| 2025-08-13 | 13F | Capital Fund Management S.a. | Call | 20 100 | −43,54 | 904 | −34,96 | |||
| 2025-08-13 | 13F | Capital Fund Management S.a. | Put | 42 600 | −7,19 | 1 917 | 6,92 | |||
| 2025-07-31 | 13F | Oppenheimer & Co Inc | 20 227 | 4,58 | 910 | 20,53 | ||||
| 2025-08-05 | 13F | Bank Of Montreal /can/ | Call | 0 | −100,00 | 0 | −100,00 | |||
| 2025-08-05 | 13F | Financial Sense Advisors, Inc. | 6 546 | −10,95 | 295 | 2,44 | ||||
| 2025-08-14 | 13F | Glen Eagle Advisors, LLC | 4 | 0,00 | 0 | |||||
| 2025-08-14 | 13F | Visionary Wealth Advisors | 5 365 | 0,00 | 241 | 15,31 | ||||
| 2025-08-14 | 13F | Cubist Systematic Strategies, LLC | 6 832 | 307 | ||||||
| 2025-08-06 | 13F | Golden State Wealth Management, LLC | 338 | 0,00 | 15 | 15,38 | ||||
| 2025-08-05 | 13F | Carolinas Wealth Consulting Llc | 0 | −100,00 | 0 | |||||
| 2025-08-05 | 13F | Magnolia Capital Advisors Llc | 8 477 | −1,61 | 381 | 13,39 | ||||
| 2025-08-06 | 13F | Commonwealth Equity Services, Llc | 100 562 | 1,96 | 5 | 33,33 | ||||
| 2025-08-13 | 13F | Townsquare Capital Llc | 0 | −100,00 | 0 | |||||
| 2025-08-04 | 13F | Assetmark, Inc | 0 | −100,00 | 0 | |||||
| 2025-08-14 | 13F | Hrt Financial Lp | 0 | −100,00 | 0 | |||||
| 2025-08-18 | 13F | Wolverine Trading, Llc | Put | 0 | −100,00 | 0 | −100,00 | |||
| 2025-07-18 | 13F | Parsons Capital Management Inc/ri | 20 702 | −0,74 | 932 | 14,37 | ||||
| 2025-07-31 | 13F | Sumitomo Mitsui Trust Holdings, Inc. | 20 300 | 914 | ||||||
| 2025-07-25 | 13F | Cwm, Llc | 4 079 | 1 356,79 | 0 | |||||
| 2025-08-14 | 13F | Fwl Investment Management, Llc | 3 096 | 43,20 | 139 | 65,48 | ||||
| 2025-08-14 | 13F | First International Bank of Israel Ltd. | 79 300 | 3 568 | ||||||
| 2025-08-14 | 13F | FIL Ltd | 110 060 | 4 557,64 | 4 953 | 5 282,61 | ||||
| 2025-04-15 | 13F | GPS Wealth Strategies Group, LLC | 0 | −100,00 | 0 | |||||
| 2025-08-07 | 13F | PCG Wealth Advisors, LLC | 69 065 | 8,47 | 3 108 | 24,93 | ||||
| 2025-07-22 | 13F | IMC-Chicago, LLC | 0 | −100,00 | 0 | |||||
| 2025-04-11 | 13F | Lake Hills Wealth Management, LLC | 0 | −100,00 | 0 | −100,00 | ||||
| 2025-04-21 | 13F | PSI Advisors, LLC | 0 | −100,00 | 0 | |||||
| 2025-07-23 | 13F | RMG Wealth Management LLC | 85 | 4 | ||||||
| 2025-08-13 | 13F | PACK Private Wealth, LLC | 5 746 | 259 | ||||||
| 2025-08-14 | 13F | BW Gestao de Investimentos Ltda. | 0 | −100,00 | 0 | |||||
| 2025-05-01 | 13F | Quest 10 Wealth Builders, Inc. | 110 | 0,00 | 4 | 0,00 | ||||
| 2025-08-07 | 13F | Winch Advisory Services, LLC | 186 | 0,00 | 8 | 14,29 | ||||
| 2025-08-13 | 13F | Marshall Wace, Llp | 0 | −100,00 | 0 | |||||
| 2025-08-11 | 13F | Strategic Wealth Partners, Ltd. | 462 | 21 | ||||||
| 2025-07-28 | 13F | Kiker Wealth Management, LLC | 0 | −100,00 | 0 | |||||
| 2025-05-15 | 13F | Wiley Bros.-aintree Capital, Llc | 0 | −100,00 | 0 | |||||
| 2025-05-16 | 13F | Coppell Advisory Solutions LLC | 0 | −100,00 | 0 | |||||
| 2025-08-14 | 13F | Stifel Financial Corp | 16 243 | 96,34 | 731 | 126,01 | ||||
| 2025-08-08 | 13F | Pnc Financial Services Group, Inc. | 1 129 | −21,38 | 51 | −10,71 | ||||
| 2025-05-15 | 13F | Two Sigma Securities, Llc | 0 | −100,00 | 0 | |||||
| 2025-08-01 | 13F | Envestnet Asset Management Inc | 71 888 | 14,28 | 3 235 | 31,62 | ||||
| 2025-08-26 | 13F/A | Thrivent Financial For Lutherans | 24 162 | −91,70 | 1 | −91,67 | ||||
| 2025-04-15 | 13F | Noble Wealth Management PBC | 0 | −100,00 | 0 | |||||
| 2025-05-13 | 13F | Twin Focus Capital Partners, Llc | 0 | −100,00 | 0 | |||||
| 2025-07-21 | 13F | Empirical Financial Services, LLC d.b.a. Empirical Wealth Management | 0 | −100,00 | 0 | |||||
| 2025-08-07 | 13F | Allworth Financial LP | 720 | 20,20 | 32 | 39,13 | ||||
| 2025-08-07 | 13F | Parkside Financial Bank & Trust | 225 | 0,00 | 10 | 25,00 | ||||
| 2025-07-02 | 13F | HBW Advisory Services LLC | 7 741 | 7,81 | 348 | 24,29 | ||||
| 2025-08-15 | 13F | Kestra Advisory Services, LLC | 19 061 | 10,93 | 858 | 27,72 | ||||
| 2025-08-06 | 13F | Rialto Wealth Management, LLC | 203 | 0,00 | 9 | 28,57 | ||||
| 2025-08-11 | 13F | Aptus Capital Advisors, LLC | 1 142 | 0,00 | 51 | 15,91 | ||||
| 2025-08-01 | 13F | Brookwood Investment Group LLC | 25 131 | 14,90 | 1 131 | 32,32 | ||||
| 2025-08-05 | 13F | Simplex Trading, Llc | 725 | −90,96 | 0 | |||||
| 2025-08-01 | 13F | Mizuho Markets Cayman LP | 9 918 | 446 | ||||||
| 2025-07-17 | 13F | Paradigm Financial Partners, Llc | 24 690 | 1 111 | ||||||
| 2025-08-07 | 13F | Guardian Partners Inc. | 154 004 | 785,08 | 6 916 | 943,14 | ||||
| 2025-07-16 | 13F | Register Financial Advisors LLC | 100 | 0,00 | 4 | 33,33 | ||||
| 2025-08-12 | 13F | Steward Partners Investment Advisory, Llc | 89 816 | −0,69 | 4 042 | 14,38 | ||||
| 2025-08-12 | 13F | CIBC Private Wealth Group, LLC | 36 | 2 | ||||||
| 2025-08-18 | 13F/A | Kestra Investment Management, LLC | 104 | 5 | ||||||
| 2025-08-19 | 13F | Delos Wealth Advisors, LLC | 56 | 3 | ||||||
| 2025-08-14 | 13F | Turim 21 Investimentos Ltda. | 1 206 | 0,00 | 54 | 14,89 | ||||
| 2025-08-29 | NP | HHCAX - Highland Long/Short Healthcare Fund Class A | Short | −30 370 | 343,68 | −1 367 | 411,61 | |||
| 2025-08-08 | 13F | Creative Planning | 33 015 | 5,66 | 1 486 | 21,72 | ||||
| 2025-08-14 | 13F | Royal Bank Of Canada | 305 445 | 87,21 | 13 744 | 115,59 | ||||
| 2025-07-16 | 13F | Legend Financial Advisors, Inc. | 206 983 | −1,25 | 9 314 | 13,74 | ||||
| 2025-07-31 | 13F | Fielder Capital Group LLC | 367 511 | −8,06 | 16 538 | 5,90 | ||||
| 2025-05-15 | 13F | Schonfeld Strategic Advisors LLC | 0 | −100,00 | 0 | |||||
| 2025-08-18 | 13F | Wolverine Trading, Llc | Call | 7 500 | −70,47 | 337 | −66,93 | |||
| 2025-07-14 | 13F | Caitlin John, LLC | 0 | −100,00 | 0 | |||||
| 2025-08-01 | 13F | Y-Intercept (Hong Kong) Ltd | 25 079 | 1 129 | ||||||
| 2025-08-14 | 13F | Fmr Llc | 642 | −56,21 | 29 | −50,88 | ||||
| 2025-05-15 | 13F | Elo Mutual Pension Insurance Co | 0 | −100,00 | 0 | −100,00 | ||||
| 2025-05-12 | 13F | Virtu Financial LLC | 0 | −100,00 | 0 | |||||
| 2025-05-15 | 13F | SIH Partners, LLLP | 0 | −100,00 | 0 | |||||
| 2025-07-14 | 13F | U.S. Capital Wealth Advisors, LLC | 15 990 | 8,11 | 720 | 24,61 | ||||
| 2025-07-29 | 13F | Private Trust Co Na | 48 | −7,69 | 2 | 0,00 | ||||
| 2025-08-12 | 13F | XTX Topco Ltd | 10 458 | 471 | ||||||
| 2025-07-21 | 13F | Mirae Asset Global Investments Co., Ltd. | 31 700 | −63,33 | 1 426 | −58,76 | ||||
| 2025-07-08 | 13F | Nbc Securities, Inc. | 709 | 43,52 | 0 | |||||
| 2025-08-14 | 13F | Riggs Asset Managment Co. Inc. | 51 | −92,84 | 2 | −92,59 | ||||
| 2025-08-15 | 13F | Morgan Stanley | 758 614 | −31,32 | 34 138 | −20,90 | ||||
| 2025-08-07 | 13F | Brio Consultants, LLC | 0 | −100,00 | 0 | −100,00 | ||||
| 2025-08-08 | 13F | Avantax Advisory Services, Inc. | 15 098 | −67,84 | 679 | −62,98 | ||||
| 2025-08-14 | 13F | Wealth High Governance Capital Ltda | 0 | −100,00 | 0 | |||||
| 2025-08-12 | 13F | J.w. Cole Advisors, Inc. | 9 315 | 419 | ||||||
| 2025-04-22 | 13F | Synergy Financial Management, LLC | 0 | −100,00 | 0 | |||||
| 2025-08-14 | 13F | Bnp Paribas Arbitrage, Sa | 73 821 | −58,59 | 3 322 | −52,32 | ||||
| 2025-08-13 | 13F | Johnson Financial Group, Inc. | 0 | −100,00 | 0 | |||||
| 2025-08-14 | 13F | Polymer Capital Management (HK) LTD | 62 300 | 2 804 | ||||||
| 2025-08-08 | 13F | Emerald Investment Partners, Llc | 51 | 2 | ||||||
| 2025-05-29 | NP | MMRFX - MassMutual Select T. Rowe Price Real Assets Fund Class I | 13 793 | −65,84 | 539 | −65,09 | ||||
| 2025-07-29 | 13F | CapWealth Advisors, LLC | 7 500 | 0,00 | 338 | 15,02 | ||||
| 2025-07-25 | 13F | Atria Wealth Solutions, Inc. | 7 195 | 0,00 | 324 | 14,95 | ||||
| 2025-08-18 | 13F | Tactive Advisors, LLC | 24 867 | 1 119 | ||||||
| 2025-07-16 | 13F | Evergreen Private Wealth LLC | 89 | 0,00 | 4 | 33,33 | ||||
| 2025-08-19 | 13F | Marex Group plc | 20 421 | 919 | ||||||
| 2025-08-14 | 13F | GWM Advisors LLC | 14 959 | −18,20 | 673 | −5,74 | ||||
| 2025-07-09 | 13F | Krilogy Financial LLC | 0 | −100,00 | 0 | −100,00 | ||||
| 2025-08-14 | 13F | Banco BTG Pactual S.A. | 16 785 | 11,64 | 755 | 28,62 | ||||
| 2025-08-14 | 13F | Banque Transatlantique SA | 0 | −100,00 | 0 | |||||
| 2025-07-07 | 13F | Thurston, Springer, Miller, Herd & Titak, Inc. | 407 | 20,77 | 18 | 38,46 | ||||
| 2025-08-13 | 13F | Jones Financial Companies Lllp | 15 594 | 18,97 | 700 | 33,59 | ||||
| 2025-08-12 | 13F | LPL Financial LLC | 327 746 | −3,77 | 14 749 | 10,84 | ||||
| 2025-05-05 | 13F | Lindbrook Capital, Llc | 35 | 0,00 | 1 | 0,00 | ||||
| 2025-08-04 | 13F | Quaker Wealth Management, LLC | 41 664 | 1 875 | ||||||
| 2025-08-14 | 13F | Federation des caisses Desjardins du Quebec | 655 | 52,33 | 29 | 81,25 | ||||
| 2025-08-14 | 13F | Susquehanna International Group, Llp | 24 275 | 44,80 | 1 092 | 66,72 | ||||
| 2025-08-12 | 13F | Global Retirement Partners, LLC | 2 677 | 40,45 | 120 | 66,67 | ||||
| 2025-08-12 | 13F | Concentrum Wealth Management | 6 607 | −15,37 | 297 | −2,62 | ||||
| 2025-08-14 | 13F | Susquehanna International Group, Llp | Call | 277 300 | −48,66 | 12 478 | −40,87 | |||
| 2025-08-14 | 13F | Susquehanna International Group, Llp | Put | 59 700 | −42,87 | 2 686 | −34,20 |