Grunnleggende statistikk
| Institusjonelle eiere | 114 total, 114 long only, 0 short only, 0 long/short - change of 8,57% MRQ |
| Gjennomsnittlig porteføljeallokering | 0.1651 % - change of −28,42% MRQ |
| Institusjonelle aksjer (Long) | 40 217 603 (ex 13D/G) - change of 0,77MM shares 1,96% MRQ |
| Institusjonell verdi (Long) | $ 540 147 USD ($1000) |
Institusjonelt eierskap og aksjonærer
Compañía Cervecerías Unidas S.A. - Depositary Receipt (Common Stock) (US:CCU) har 114 institusjonelle eiere og aksjonærer som har sendt inn 13D/G- eller 13F-skjemaer til Securities Exchange Commission (SEC). Disse institusjonene eier til sammen 40,217,603 aksjer. De største aksjonærene inkluderer First Eagle Investment Management, LLC, SGOVX - First Eagle Overseas Fund Class A, Discerene Group LP, Wellington Management Group Llp, HILAX - The Hartford International Value Fund Class A, FEBAX - First Eagle Global Income Builder Fund Class A, Bennbridge Ltd, Macquarie Group Ltd, Acadian Asset Management Llc, and BlackRock, Inc. .
Compañía Cervecerías Unidas S.A. - Depositary Receipt (Common Stock) (NYSE:CCU) institusjonell eierstruktur viser nåværende posisjoner i selskapet fordelt på institusjoner og fond, samt de siste endringene i posisjonsstørrelse. De største aksjonærene kan være individuelle investorer, verdipapirfond, hedgefond eller institusjoner. Schedule 13D indikerer at investoren eier (eller har eid) mer enn 5 % av selskapet og har til hensikt (eller hadde til hensikt) å aktivt forfølge en endring i forretningsstrategien. Schedule 13G indikerer en passiv investering på over 5 %.
The share price as of September 12, 2025 is 11,94 / share. Previously, on September 13, 2024, the share price was 10,51 / share. This represents an increase of 13,61% over that period.

Fondssentiment-score
Fondssentiment Score (også kjent som akkumulering av eierskap poengsum) viser hvilke aksjer som er mest kjøpt av fond. Den er resultatet av en sofistikert, kvantitativ flerfaktormodell som identifiserer selskaper med de høyeste nivåene av institusjonell akkumulering. Beregningsmodellen for poeng bruker en kombinasjon av den totale økningen i antall offentliggjorte eiere, endringer i porteføljeallokeringen til disse eierne og andre beregninger. Tallet går fra 0 til 100, der høyere tall indikerer en høyere grad av akkumulering i forhold til sammenlignbare selskaper, der 50 er gjennomsnittet.
Oppdateringsfrekvens: Daglig
Sjekk ut Ownership Explorer, som inneholder en liste over de høyest rangerte selskapene.
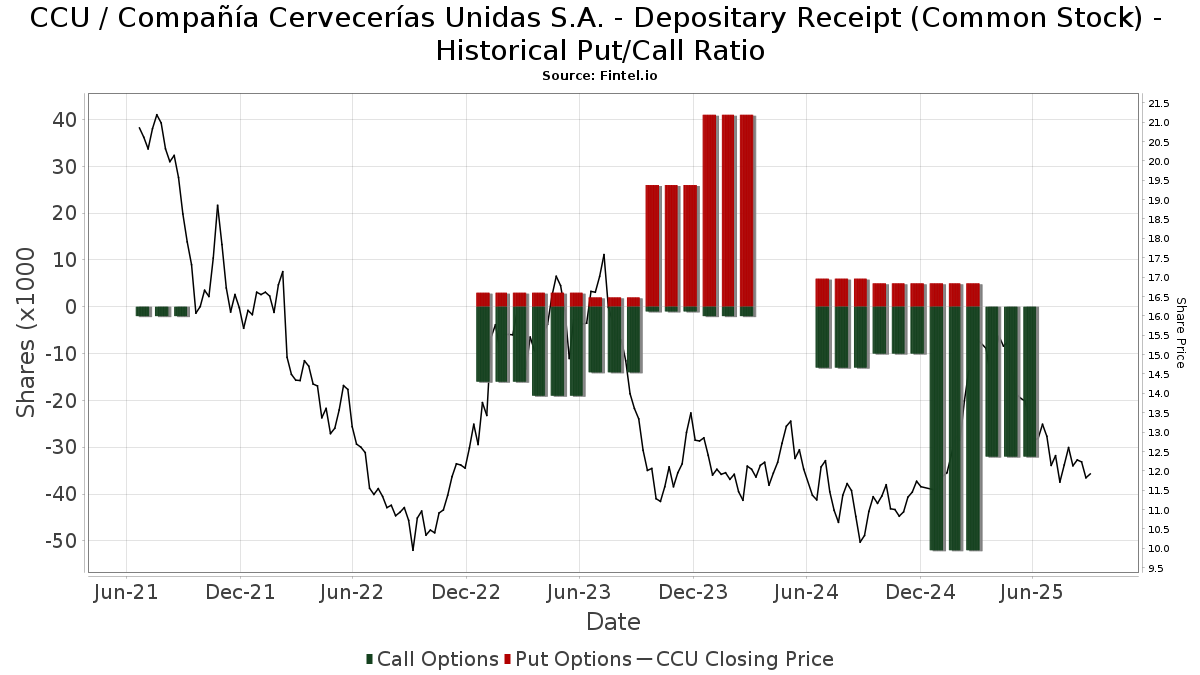
Institusjonell Put/Call-forhold
I tillegg til å rapportere standard aksje- og gjeldsemisjoner må institusjoner med mer enn 100 millioner kroner i forvaltningskapital også oppgi beholdningen av put- og callopsjoner. Siden put-opsjoner generelt indikerer et negativt sentiment, og call-opsjoner indikerer et positivt sentiment, kan vi få et inntrykk av det generelle institusjonelle sentimentet ved å plotte forholdet mellom put- og call-opsjoner. Diagrammet til høyre viser det historiske forholdet mellom put- og call-opsjoner for dette instrumentet.
Ved å bruke Put/Call-forholdet som en indikator på investorsentimentet kan man overvinne en av de viktigste svakhetene ved å bruke totalt institusjonelt eierskap, nemlig at en betydelig andel av forvaltningskapitalen investeres passivt for å følge indekser. Passivt forvaltede fond kjøper vanligvis ikke opsjoner, slik at indikatoren for put/call-forhold i større grad gjenspeiler stemningen i aktivt forvaltede fond.
13F- og NPORT-arkiveringer
Detaljer om 13F-arkiveringer er gratis. Detaljer om NP-arkiveringer krever et premium-medlemskap. Grønne rader indikerer nye posisjoner. Røde rader indikerer lukkede posisjoner. Klikk på lenke ikonet for å se hele transaksjonshistorikken.
Oppgrader
for å låse opp premiedata og eksportere til Excel. ![]() .
.
| Fildato | Kilde | Investor | Type | Gjennomsnittlig pris (estimert) |
Aksjer | Δ Aksjer (%) |
Rapportert verdi ($1000) | Verdi (%) | Portallokering (%) | |
|---|---|---|---|---|---|---|---|---|---|---|
| 2025-07-31 | 13F | MQS Management LLC | 17 266 | 223 | ||||||
| 2025-06-26 | NP | DFSE - Dimensional Emerging Markets Sustainability Core 1 ETF | 5 206 | 253,43 | 79 | 364,71 | ||||
| 2025-07-28 | NP | AVEM - Avantis Emerging Markets Equity ETF This fund is a listed as child fund of American Century Companies Inc and if that institution has disclosed ownership in this security, then these positions will not be double counted when calculating total shares and total value | 157 260 | 173,52 | 2 143 | 167,21 | ||||
| 2025-04-25 | 13F | Ameritas Advisory Services, LLC | 0 | −100,00 | 0 | |||||
| 2025-08-14 | 13F | Goldman Sachs Group Inc | 13 405 | −64,83 | 173 | −70,12 | ||||
| 2025-06-26 | NP | DEXC - Dimensional Emerging Markets ex China Core Equity ETF | 3 422 | 134,87 | 52 | 205,88 | ||||
| 2025-06-26 | NP | DFA INVESTMENT DIMENSIONS GROUP INC - World ex U.S. Core Equity Portfolio Institutional Class Shares | 5 319 | 0,00 | 81 | 25,00 | ||||
| 2025-06-26 | NP | DFAX - Dimensional World ex U.S. Core Equity 2 ETF | 19 543 | 0,00 | 297 | 25,32 | ||||
| 2025-08-14 | 13F | Fmr Llc | 138 | 0,00 | 2 | −50,00 | ||||
| 2025-08-14 | 13F | Federation des caisses Desjardins du Quebec | 19 108 | 0,00 | 247 | −14,83 | ||||
| 2025-07-08 | 13F | Parallel Advisors, LLC | 1 472 | −16,08 | 19 | −26,92 | ||||
| 2025-08-14 | 13F | Smartleaf Asset Management LLC | 0 | −100,00 | 0 | |||||
| 2025-08-12 | 13F | Rhumbline Advisers | 6 455 | −1,53 | 83 | −16,16 | ||||
| 2025-08-13 | 13F | Quadrant Capital Group Llc | 16 715 | −37,47 | 216 | −47,04 | ||||
| 2025-08-07 | 13F | Allworth Financial LP | 168 | 13,51 | 2 | 0,00 | ||||
| 2025-08-06 | 13F | Savant Capital, LLC | 12 778 | 165 | ||||||
| 2025-08-05 | 13F | Simplex Trading, Llc | 2 022 | 0 | ||||||
| 2025-06-27 | NP | FEBAX - First Eagle Global Income Builder Fund Class A | 1 327 830 | 0,00 | 20 210 | 25,37 | ||||
| 2025-07-25 | NP | DEMAX - Delaware Emerging Markets Fund Class A | 410 528 | 0,00 | 5 595 | −2,29 | ||||
| 2025-08-04 | 13F | Assetmark, Inc | 65 | 96,97 | 1 | |||||
| 2025-07-22 | 13F | Gsa Capital Partners Llp | 0 | −100,00 | 0 | |||||
| 2025-08-12 | 13F | Trexquant Investment LP | 0 | −100,00 | 0 | |||||
| 2025-07-29 | NP | WEUSX - Siit World Equity Ex-us Fund - Class A | 76 859 | 1 048 | ||||||
| 2025-08-13 | 13F | Jump Financial, LLC | 23 177 | −35,67 | 299 | −45,34 | ||||
| 2025-07-29 | NP | RBB FUND, INC. - Aquarius International Fund | 4 167 | 0,00 | 57 | −3,45 | ||||
| 2025-08-28 | NP | FEOVX - First Eagle Overseas Variable Fund | 165 749 | 0,00 | 2 141 | −15,01 | ||||
| 2025-08-14 | 13F | Bank Of America Corp /de/ | 282 777 | 8,67 | 3 653 | −7,64 | ||||
| 2025-08-19 | 13F | Advisory Services Network, LLC | 0 | −100,00 | 0 | |||||
| 2025-08-13 | 13F | Employees Retirement System of Texas | 5 694 | 0,00 | 0 | |||||
| 2025-08-12 | 13F | BlackRock, Inc. | 450 421 | −5,76 | 5 819 | −19,89 | ||||
| 2025-05-08 | 13F | XTX Topco Ltd | 0 | −100,00 | 0 | |||||
| 2025-07-07 | 13F | Investors Research Corp | 36 275 | 0,00 | 469 | −15,06 | ||||
| 2025-08-08 | 13F | SBI Securities Co., Ltd. | 19 | 0,00 | 0 | |||||
| 2025-06-26 | NP | DFCEX - Emerging Markets Core Equity Portfolio - Institutional Class This fund is a listed as child fund of Dimensional Fund Advisors Lp and if that institution has disclosed ownership in this security, then these positions will not be double counted when calculating total shares and total value | 75 722 | 0,00 | 1 152 | 25,35 | ||||
| 2025-07-18 | 13F | Ninety One UK Ltd | 312 746 | 0,00 | 4 041 | −15,00 | ||||
| 2025-08-29 | NP | PEIFX - PIMCO RAE Emerging Markets Fund Institutional Class | 47 816 | −50,19 | 311 | −43,53 | ||||
| 2025-08-14 | 13F | Jane Street Group, Llc | 25 796 | 101,59 | 333 | 71,65 | ||||
| 2025-07-29 | 13F | Stephens Inc /ar/ | 21 750 | 0,93 | 281 | −14,07 | ||||
| 2025-07-22 | 13F | Sage Investment Counsel LLC | 0 | −100,00 | 0 | |||||
| 2025-07-24 | 13F | Jfs Wealth Advisors, Llc | 45 | 0,00 | 1 | |||||
| 2025-09-04 | 13F/A | Advisor Group Holdings, Inc. | 840 | 1 687,23 | 11 | |||||
| 2025-07-14 | 13F | UMA Financial Services, Inc. | 82 | 22,39 | 1 | 0,00 | ||||
| 2025-07-31 | 13F | Fielder Capital Group LLC | 12 636 | 0,00 | 163 | −15,10 | ||||
| 2025-08-14 | 13F | Citadel Advisors Llc | Put | 0 | −100,00 | 0 | ||||
| 2025-08-14 | 13F | UBS Group AG | 70 654 | 54,23 | 913 | 31,03 | ||||
| 2025-08-14 | 13F | Vident Advisory, LLC | 43 220 | −3,31 | 558 | −17,82 | ||||
| 2025-08-14 | 13F | D. E. Shaw & Co., Inc. | 86 721 | −18,98 | 1 120 | −31,12 | ||||
| 2025-07-16 | 13F | Signaturefd, Llc | 1 631 | −19,30 | 21 | −30,00 | ||||
| 2025-06-26 | NP | DFEM - Dimensional Emerging Markets Core Equity 2 ETF | 18 761 | 48,37 | 286 | 86,27 | ||||
| 2025-08-14 | 13F | Point72 Asset Management, L.P. | 65 200 | 842 | ||||||
| 2025-08-14 | 13F | Susquehanna International Group, Llp | Call | 13 600 | −38,46 | 176 | −47,76 | |||
| 2025-08-27 | NP | OAIEX - Optimum International Fund Class A | 18 470 | 91,32 | 239 | 96,69 | ||||
| 2025-07-11 | 13F | Diversified Trust Co | 12 007 | 155 | ||||||
| 2025-08-15 | 13F | Tower Research Capital LLC (TRC) | 31 | −32,61 | 0 | |||||
| 2025-08-26 | NP | SBHEX - Segall Bryant & Hamill Emerging Markets Fund Retail Class | 2 600 | 34 | ||||||
| 2025-08-14 | 13F | Citadel Advisors Llc | Call | 19 000 | −37,91 | 245 | −47,31 | |||
| 2025-07-11 | 13F | Farther Finance Advisors, LLC | 50 | 0,00 | 1 | |||||
| 2025-05-01 | 13F | Genesis Investment Management, LLP | 0 | −100,00 | 0 | |||||
| 2025-08-12 | 13F | Jpmorgan Chase & Co | 296 | 122,56 | 4 | 50,00 | ||||
| 2025-05-14 | 13F | Catalyst Funds Management Pty Ltd | 0 | −100,00 | 0 | |||||
| 2025-08-29 | NP | SA FUNDS INVESTMENT TRUST - SA Emerging Markets Value Fund | 788 | 10 | ||||||
| 2025-08-06 | 13F | First Eagle Investment Management, LLC | 15 891 620 | −0,00 | 205 320 | −15,00 | ||||
| 2025-05-14 | 13F | Guggenheim Capital Llc | 0 | −100,00 | 0 | |||||
| 2025-08-13 | 13F | BLI - Banque de Luxembourg Investments | 435 000 | −13,86 | 5 606 | −27,42 | ||||
| 2025-07-10 | 13F | Banque de Luxembourg S.A. | 6 623 | 0,00 | 101 | 0,00 | ||||
| 2025-08-14 | 13F | Barometer Capital Management Inc. | 9 543 | 0,00 | 123 | −13,99 | ||||
| 2025-08-14 | 13F | Parvin Asset Management, LLC | 3 875 | 0,00 | 50 | −13,79 | ||||
| 2025-08-12 | 13F | Virtu Financial LLC | 13 034 | −18,58 | 0 | |||||
| 2025-05-15 | 13F | Two Sigma Advisers, Lp | 0 | −100,00 | 0 | |||||
| 2025-07-07 | 13F | Northwest & Ethical Investments L.P. | 0 | −100,00 | 0 | −100,00 | ||||
| 2025-08-14 | 13F | Bennbridge Ltd | 917 510 | −20,42 | 11 854 | −32,36 | ||||
| 2025-08-13 | 13F | Marshall Wace, Llp | 255 380 | 83,78 | 3 300 | 56,20 | ||||
| 2025-06-26 | NP | DAADX - Emerging Markets ex China Core Equity Portfolio Institutional Class | 5 028 | 0,00 | 77 | 24,59 | ||||
| 2025-08-13 | 13F | Arrowstreet Capital, Limited Partnership | 166 244 | 386,65 | 2 148 | 313,68 | ||||
| 2025-08-08 | 13F | Pnc Financial Services Group, Inc. | 78 | 44,44 | 1 | |||||
| 2025-08-29 | NP | MFEM - PIMCO RAFI Dynamic Multi-Factor Emerging Markets Equity ETF | 10 550 | 0,00 | 69 | −13,92 | ||||
| 2025-08-14 | 13F | State Street Corp | 162 060 | 44,62 | 2 094 | 22,90 | ||||
| 2025-08-14 | 13F | Cubist Systematic Strategies, LLC | 132 197 | 429,57 | 1 708 | 350,40 | ||||
| 2025-08-15 | 13F | Morgan Stanley | 126 667 | 3,86 | 1 637 | −11,71 | ||||
| 2025-07-25 | 13F | Cwm, Llc | 138 | 0 | ||||||
| 2025-08-12 | 13F | Dimensional Fund Advisors Lp | 171 396 | 11,07 | 2 214 | −5,59 | ||||
| 2025-08-13 | 13F | Renaissance Technologies Llc | 391 065 | −4,52 | 5 053 | −18,84 | ||||
| 2025-08-14 | 13F | Ieq Capital, Llc | 15 271 | 197 | ||||||
| 2025-08-12 | 13F | SRS Capital Advisors, Inc. | 90 | 1 | ||||||
| 2025-08-14 | 13F | Mariner, LLC | 66 408 | 8,11 | 858 | −8,15 | ||||
| 2025-06-26 | NP | HILAX - The Hartford International Value Fund Class A | 1 355 255 | 0,00 | 20 627 | 25,37 | ||||
| 2025-08-13 | 13F | Northern Trust Corp | 98 115 | −13,52 | 1 268 | −26,51 | ||||
| 2025-08-14 | 13F | BTG Pactual Asset Management US LLC | 14 656 | 189 | ||||||
| 2025-07-30 | 13F | Ethic Inc. | 12 255 | −2,61 | 158 | −18,65 | ||||
| 2025-08-12 | 13F | Proequities, Inc. | 0 | 0 | ||||||
| 2025-07-24 | 13F | Us Bancorp \de\ | 947 | 0,00 | 12 | −14,29 | ||||
| 2025-07-31 | 13F | R Squared Ltd | 29 605 | 49,45 | 382 | 26,91 | ||||
| 2025-08-11 | 13F | Principal Securities, Inc. | 85 | 214,81 | 1 | |||||
| 2025-08-14 | 13F | Royal Bank Of Canada | 124 778 | 237,85 | 1 612 | 187,34 | ||||
| 2025-08-14 | 13F | Raymond James Financial Inc | 1 212 | 16 | ||||||
| 2025-08-15 | 13F | WealthCollab, LLC | 202 | 0,00 | 3 | −33,33 | ||||
| 2025-08-14 | 13F | Two Sigma Investments, Lp | 66 555 | 29,78 | 860 | 10,27 | ||||
| 2025-08-07 | 13F | Acadian Asset Management Llc | 487 149 | 130,10 | 6 | 100,00 | ||||
| 2025-08-13 | 13F | Channing Global Advisors, Llc | 9 058 | −39,94 | 117 | −48,91 | ||||
| 2025-08-12 | 13F | O'shaughnessy Asset Management, Llc | 18 159 | 235 | ||||||
| 2025-08-13 | 13F | Natixis Advisors, L.p. | 15 549 | 0 | ||||||
| 2025-07-24 | 13F | Ronald Blue Trust, Inc. | 25 295 | 4,30 | 327 | −11,41 | ||||
| 2025-07-15 | 13F | Ballentine Partners, LLC | 13 372 | −1,19 | 173 | −16,10 | ||||
| 2025-08-21 | NP | MEMSX - Mercer Emerging Markets Equity Fund Class I | 86 587 | −2,70 | 1 119 | −17,31 | ||||
| 2025-08-06 | 13F | Stokes Family Office, LLC | 25 000 | 0,00 | 323 | −15,00 | ||||
| 2025-05-28 | NP | QCSTRX - Stock Account Class R1 | 105 958 | 20,03 | 803 | 57,76 | ||||
| 2025-06-27 | NP | SGOVX - First Eagle Overseas Fund Class A | 9 392 572 | 0,00 | 142 955 | 25,37 | ||||
| 2025-08-29 | NP | FRDM - Freedom 100 Emerging Markets ETF | 442 501 | 16,75 | 5 717 | −0,76 | ||||
| 2025-08-11 | 13F | Nomura Asset Management Co Ltd | 1 500 | 0,00 | 19 | −13,64 | ||||
| 2025-08-14 | 13F | Wellington Management Group Llp | 1 934 547 | −0,52 | 24 994 | −15,44 | ||||
| 2025-07-28 | NP | AVSE - Avantis Responsible Emerging Markets Equity ETF | 4 253 | 153,31 | 58 | 147,83 | ||||
| 2025-07-30 | NP | APIE - ActivePassive International Equity ETF | 46 854 | 1,04 | 639 | −1,24 | ||||
| 2025-08-25 | NP | EITEX - Parametric Tax-Managed Emerging Markets Fund Institutional Class | 23 700 | 0,00 | 306 | −15,00 | ||||
| 2025-05-05 | 13F | Lindbrook Capital, Llc | 1 014 | −3,43 | 15 | 36,36 | ||||
| 2025-07-21 | 13F | Qrg Capital Management, Inc. | 11 251 | 3,59 | 145 | −12,12 | ||||
| 2025-08-14 | 13F | Citadel Advisors Llc | 0 | −100,00 | 0 | |||||
| 2025-07-28 | NP | AVXC - Avantis Emerging Markets ex-China Equity ETF | 3 569 | 37,43 | 49 | 33,33 | ||||
| 2025-08-12 | 13F | Coldstream Capital Management Inc | 0 | −100,00 | 0 | |||||
| 2025-08-12 | 13F | American Century Companies Inc | 173 672 | 172,19 | 2 244 | 131,48 | ||||
| 2025-08-12 | 13F | MAI Capital Management | 1 336 | 17 | ||||||
| 2025-08-01 | 13F | Envestnet Asset Management Inc | 78 043 | 6,87 | 1 008 | −9,11 | ||||
| 2025-07-18 | 13F | Naples Global Advisors, Llc | 31 200 | 0,00 | 403 | −14,98 | ||||
| 2025-06-26 | NP | Dfa Investment Trust Co - The Emerging Markets Small Cap Series This fund is a listed as child fund of Dimensional Fund Advisors Lp and if that institution has disclosed ownership in this security, then these positions will not be double counted when calculating total shares and total value | 17 960 | 0,00 | 273 | 25,23 | ||||
| 2025-04-25 | 13F | KBC Group NV | 0 | −100,00 | 0 | |||||
| 2025-08-13 | 13F | Russell Investments Group, Ltd. | 12 703 | 164 | ||||||
| 2025-07-14 | 13F | GAMMA Investing LLC | 2 616 | 0,62 | 34 | −15,38 | ||||
| 2025-05-14 | 13F | Huntington National Bank | 0 | −100,00 | 0 | |||||
| 2025-08-14 | 13F | Wells Fargo & Company/mn | 34 688 | 41,90 | 448 | 20,75 | ||||
| 2025-08-14 | 13F | Aquatic Capital Management LLC | 28 837 | 161,54 | 373 | 122,75 | ||||
| 2025-08-14 | 13F | Macquarie Group Ltd | 559 389 | 3,41 | 7 227 | −12,10 | ||||
| 2025-08-13 | 13F | EverSource Wealth Advisors, LLC | 3 233 | 1 252,72 | 42 | 1 266,67 | ||||
| 2025-08-14 | 13F | Prelude Capital Management, Llc | 0 | −100,00 | 0 | |||||
| 2025-08-12 | 13F | Discerene Group LP | 2 517 157 | 0,00 | 32 522 | −15,00 |
Other Listings
| DE:CVU | € 10,60 |