Grunnleggende statistikk
| Institusjonelle eiere | 164 total, 164 long only, 0 short only, 0 long/short - change of −4,07% MRQ |
| Gjennomsnittlig porteføljeallokering | 0.1232 % - change of −8,22% MRQ |
| Institusjonelle aksjer (Long) | 32 658 930 (ex 13D/G) - change of −0,30MM shares −0,91% MRQ |
| Institusjonell verdi (Long) | $ 433 203 USD ($1000) |
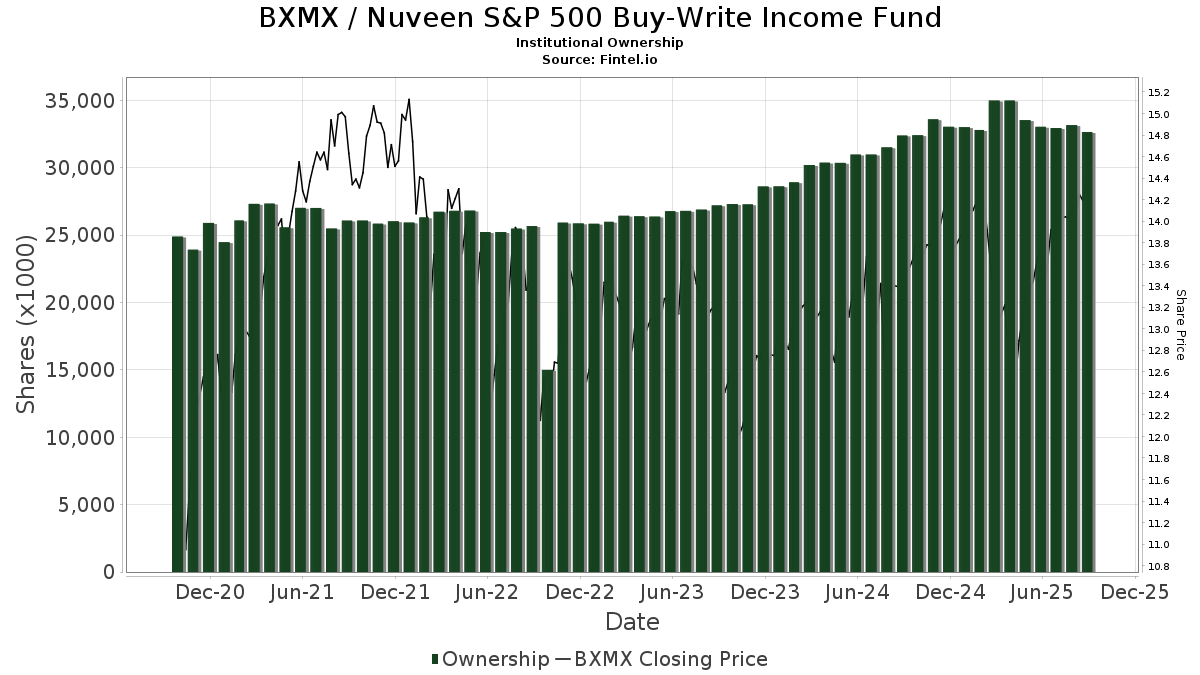
Institusjonelt eierskap og aksjonærer
Nuveen S&P 500 Buy-Write Income Fund (US:BXMX) har 164 institusjonelle eiere og aksjonærer som har sendt inn 13D/G- eller 13F-skjemaer til Securities Exchange Commission (SEC). Disse institusjonene eier til sammen 32,658,930 aksjer. De største aksjonærene inkluderer Morgan Stanley, Wells Fargo & Company/mn, LPL Financial LLC, Invesco Ltd., UBS Group AG, PCEF - Invesco CEF Income Composite ETF, Raymond James Financial Inc, Advisors Asset Management, Inc., Allspring Global Investments Holdings, LLC, and Bank Of America Corp /de/ .
Nuveen S&P 500 Buy-Write Income Fund (NYSE:BXMX) institusjonell eierstruktur viser nåværende posisjoner i selskapet fordelt på institusjoner og fond, samt de siste endringene i posisjonsstørrelse. De største aksjonærene kan være individuelle investorer, verdipapirfond, hedgefond eller institusjoner. Schedule 13D indikerer at investoren eier (eller har eid) mer enn 5 % av selskapet og har til hensikt (eller hadde til hensikt) å aktivt forfølge en endring i forretningsstrategien. Schedule 13G indikerer en passiv investering på over 5 %.
The share price as of September 9, 2025 is 14,34 / share. Previously, on September 10, 2024, the share price was 13,40 / share. This represents an increase of 7,01% over that period.
Fondssentiment-score
Fondssentiment Score (også kjent som akkumulering av eierskap poengsum) viser hvilke aksjer som er mest kjøpt av fond. Den er resultatet av en sofistikert, kvantitativ flerfaktormodell som identifiserer selskaper med de høyeste nivåene av institusjonell akkumulering. Beregningsmodellen for poeng bruker en kombinasjon av den totale økningen i antall offentliggjorte eiere, endringer i porteføljeallokeringen til disse eierne og andre beregninger. Tallet går fra 0 til 100, der høyere tall indikerer en høyere grad av akkumulering i forhold til sammenlignbare selskaper, der 50 er gjennomsnittet.
Oppdateringsfrekvens: Daglig
Sjekk ut Ownership Explorer, som inneholder en liste over de høyest rangerte selskapene.
Institusjonell Put/Call-forhold
I tillegg til å rapportere standard aksje- og gjeldsemisjoner må institusjoner med mer enn 100 millioner kroner i forvaltningskapital også oppgi beholdningen av put- og callopsjoner. Siden put-opsjoner generelt indikerer et negativt sentiment, og call-opsjoner indikerer et positivt sentiment, kan vi få et inntrykk av det generelle institusjonelle sentimentet ved å plotte forholdet mellom put- og call-opsjoner. Diagrammet til høyre viser det historiske forholdet mellom put- og call-opsjoner for dette instrumentet.
Ved å bruke Put/Call-forholdet som en indikator på investorsentimentet kan man overvinne en av de viktigste svakhetene ved å bruke totalt institusjonelt eierskap, nemlig at en betydelig andel av forvaltningskapitalen investeres passivt for å følge indekser. Passivt forvaltede fond kjøper vanligvis ikke opsjoner, slik at indikatoren for put/call-forhold i større grad gjenspeiler stemningen i aktivt forvaltede fond.
13F- og NPORT-arkiveringer
Detaljer om 13F-arkiveringer er gratis. Detaljer om NP-arkiveringer krever et premium-medlemskap. Grønne rader indikerer nye posisjoner. Røde rader indikerer lukkede posisjoner. Klikk på lenke ikonet for å se hele transaksjonshistorikken.
Oppgrader
for å låse opp premiedata og eksportere til Excel. ![]() .
.
| Fildato | Kilde | Investor | Type | Gjennomsnittlig pris (estimert) |
Aksjer | Δ Aksjer (%) |
Rapportert verdi ($1000) | Verdi (%) | Portallokering (%) | |
|---|---|---|---|---|---|---|---|---|---|---|
| 2025-07-15 | 13F | World Equity Group, Inc. | 26 750 | 102,65 | 371 | 114,45 | ||||
| 2025-07-10 | 13F | Oliver Lagore Vanvalin Investment Group | 9 597 | 0,00 | 126 | −6,72 | ||||
| 2025-08-14 | 13F | Hilltop Holdings Inc. | 39 598 | −11,90 | 550 | −6,79 | ||||
| 2025-08-18 | 13F | Hollencrest Capital Management | 8 609 | 0,00 | 119 | 6,25 | ||||
| 2025-07-16 | 13F | Signaturefd, Llc | 2 511 | 35 | ||||||
| 2025-08-14 | 13F | Polar Asset Management Partners Inc. | 156 696 | 2 175 | ||||||
| 2025-07-16 | 13F | Twelve Points Wealth Management LLC | 432 690 | 4,27 | 6 006 | 10,30 | ||||
| 2025-08-12 | 13F | Wealth Dimensions Group, Ltd. | 10 943 | −10,69 | 152 | −5,62 | ||||
| 2025-07-24 | 13F | IFP Advisors, Inc | 5 200 | −7,14 | 72 | −1,37 | ||||
| 2025-07-29 | 13F | International Assets Investment Management, Llc | 47 367 | 10,33 | 657 | 16,70 | ||||
| 2025-08-14 | 13F | GWM Advisors LLC | 87 831 | 102,31 | 1 219 | 114,24 | ||||
| 2025-08-11 | 13F | Delta Asset Management Llc/tn | 1 800 | 0,00 | 25 | 4,35 | ||||
| 2025-03-12 | 13F/A | Private Capital Management Llc | 0 | −100,00 | 0 | |||||
| 2025-08-12 | 13F | Advisors Asset Management, Inc. | 927 730 | 18,19 | 12 877 | 25,03 | ||||
| 2025-08-07 | 13F | BOK Financial Private Wealth, Inc. | 1 957 | 0,00 | 28 | 3,85 | ||||
| 2025-08-14 | 13F | Apriem Advisors | 17 968 | 0,00 | 249 | 5,96 | ||||
| 2025-07-17 | 13F | Janney Montgomery Scott LLC | 269 380 | 27,32 | 4 | 50,00 | ||||
| 2025-08-06 | 13F | Maltin Wealth Management, Inc. | 18 291 | 1,72 | 254 | 7,66 | ||||
| 2025-07-25 | 13F | Hazlett, Burt & Watson, Inc. | 7 594 | −21,89 | 0 | |||||
| 2025-07-23 | 13F | Joel Isaacson & Co., LLC | 0 | −100,00 | 0 | |||||
| 2025-07-24 | 13F | Costello Asset Management, INC | 100 | 0,00 | 1 | 0,00 | ||||
| 2025-08-14 | 13F | Mml Investors Services, Llc | 17 905 | 5,32 | 0 | |||||
| 2025-08-07 | 13F | Readystate Asset Management Lp | 0 | −100,00 | 0 | |||||
| 2025-08-08 | 13F | Cornerstone Advisors, LLC | 380 684 | −45,66 | 5 284 | −42,52 | ||||
| 2025-08-13 | 13F | StoneX Group Inc. | 26 437 | −20,26 | 373 | −16,03 | ||||
| 2025-07-25 | 13F | Cwm, Llc | 1 748 | 0,00 | 0 | |||||
| 2025-07-08 | 13F | Nbc Securities, Inc. | 28 864 | −0,71 | 0 | |||||
| 2025-07-17 | 13F | Venture Visionary Partners LLC | 52 681 | −3,03 | 731 | 2,67 | ||||
| 2025-08-14 | 13F | Wiley Bros.-aintree Capital, Llc | 87 808 | 67,66 | 1 219 | 78,59 | ||||
| 2025-07-29 | 13F | Hoese & Co LLP | 875 | −50,00 | 12 | −45,45 | ||||
| 2025-08-01 | 13F | Envestnet Asset Management Inc | 167 022 | −4,50 | 2 318 | 1,05 | ||||
| 2025-08-13 | 13F | Kayne Anderson Rudnick Investment Management Llc | 465 | 0,00 | 6 | 0,00 | ||||
| 2025-08-12 | 13F | Steward Partners Investment Advisory, Llc | 50 446 | 1,03 | 700 | 6,87 | ||||
| 2025-08-14 | 13F | Two Sigma Investments, Lp | 169 380 | 2 351 | ||||||
| 2025-08-13 | 13F | Global Endowment Management, LP | 0 | −100,00 | 0 | |||||
| 2025-05-08 | 13F | Plante Moran Financial Advisors, LLC | 0 | −100,00 | 0 | |||||
| 2025-04-29 | 13F | Pensionmark Financial Group, Llc | 0 | −100,00 | 0 | |||||
| 2025-08-12 | 13F | LPL Financial LLC | 1 629 051 | 0,85 | 22 611 | 6,69 | ||||
| 2025-08-12 | 13F | Proequities, Inc. | 0 | 0 | ||||||
| 2025-08-07 | 13F | Hennion & Walsh Asset Management, Inc. | 104 200 | 99,24 | 1 446 | 110,79 | ||||
| 2025-08-14 | 13F | Royal Bank Of Canada | 479 512 | −3,25 | 6 656 | 2,37 | ||||
| 2025-08-12 | 13F | Pathstone Holdings, LLC | 17 537 | 0,00 | 243 | 5,65 | ||||
| 2025-08-15 | 13F | Kestra Advisory Services, LLC | 74 671 | 11,09 | 1 036 | 17,59 | ||||
| 2025-08-04 | 13F | Carret Asset Management, Llc | 10 000 | 0,00 | 139 | 5,34 | ||||
| 2025-08-15 | 13F | Captrust Financial Advisors | 15 769 | 219 | ||||||
| 2025-08-13 | 13F | Invesco Ltd. | 1 507 507 | −0,41 | 20 924 | 5,36 | ||||
| 2025-07-15 | 13F | Bay Capital Advisors, LLC | 15 950 | 0,00 | 221 | 5,74 | ||||
| 2025-08-15 | 13F | Puff Wealth Management, Llc | 81 552 | 3,15 | 1 132 | 9,06 | ||||
| 2025-08-12 | 13F | Wood Tarver Financial Group, LLC | 21 | 0,00 | 0 | |||||
| 2025-07-25 | 13F | Northwest Capital Management Inc | 978 | 0,00 | 14 | 8,33 | ||||
| 2025-07-31 | 13F | Cambridge Investment Research Advisors, Inc. | 567 331 | 1,63 | 8 | 0,00 | ||||
| 2025-07-25 | 13F | Stephens Consulting, LLC | 0 | −100,00 | 0 | |||||
| 2025-05-12 | 13F | Independent Advisor Alliance | 0 | −100,00 | 0 | −100,00 | ||||
| 2025-08-07 | 13F | Kestra Private Wealth Services, Llc | 18 292 | 5,02 | 254 | 10,96 | ||||
| 2025-08-14 | 13F | Wells Fargo & Company/mn | 1 689 550 | 1,44 | 23 451 | 7,32 | ||||
| 2025-07-28 | 13F | BRYN MAWR TRUST Co | 504 | 0,00 | 7 | 0,00 | ||||
| 2025-03-11 | 13F/A | Elequin Capital Lp | 0 | −100,00 | 0 | |||||
| 2025-07-14 | 13F | Matrix Trust Co | 57 855 | 0,67 | 1 | |||||
| 2025-07-09 | 13F | Triumph Capital Management | 17 432 | 0,00 | 242 | 5,70 | ||||
| 2025-05-15 | 13F | Talon Private Wealth, LLC | 0 | −100,00 | 0 | −100,00 | ||||
| 2025-05-05 | 13F | Lindbrook Capital, Llc | 690 062 | 0,00 | 9 054 | −6,22 | ||||
| 2025-07-14 | 13F | Park Avenue Securities Llc | 122 039 | −4,13 | 2 | 0,00 | ||||
| 2025-08-11 | 13F | Blue Bell Private Wealth Management, Llc | 5 680 | 2,64 | 79 | 8,33 | ||||
| 2025-08-06 | 13F | Commonwealth Equity Services, Llc | 327 849 | −6,20 | 5 | 0,00 | ||||
| 2025-08-07 | 13F | Commerce Bank | 15 819 | 0,00 | 220 | 5,80 | ||||
| 2025-05-06 | 13F | MCF Advisors LLC | 0 | −100,00 | 0 | |||||
| 2025-08-05 | 13F | Bank of New York Mellon Corp | 12 762 | 8,09 | 177 | 14,94 | ||||
| 2025-08-14 | 13F | Susquehanna International Group, Llp | 0 | −100,00 | 0 | |||||
| 2025-07-21 | 13F | Ameritas Advisory Services, LLC | 3 090 | 43 | ||||||
| 2025-08-12 | 13F | Landscape Capital Management, L.l.c. | 0 | −100,00 | 0 | |||||
| 2025-05-08 | 13F | Private Advisory Group LLC | 0 | −100,00 | 0 | |||||
| 2025-08-11 | 13F | Rothschild Investment Llc | 693 | 0,00 | 10 | 0,00 | ||||
| 2025-08-14 | 13F | Atomi Financial Group, Inc. | 77 062 | −5,89 | 1 070 | −0,47 | ||||
| 2025-08-11 | 13F | Citigroup Inc | 2 650 | 0,00 | 37 | 5,88 | ||||
| 2025-08-27 | NP | RYDEX VARIABLE TRUST - Multi-Hedge Strategies Fund Variable Annuity | 230 | −19,30 | 3 | 0,00 | ||||
| 2025-07-15 | 13F | Focused Wealth Management, Inc | 333 887 | 1,57 | 4 634 | 7,47 | ||||
| 2025-08-05 | 13F | Key FInancial Inc | 37 | 0,00 | 1 | |||||
| 2025-07-24 | 13F | Leo Wealth, LLC | 34 991 | 0,00 | 486 | 5,66 | ||||
| 2025-08-14 | 13F | Mariner, LLC | 16 381 | 12,93 | 227 | 19,47 | ||||
| 2025-08-19 | 13F | Newbridge Financial Services Group, Inc. | 1 061 | 15 | ||||||
| 2025-04-15 | 13F | Fiduciary Financial Group, Llc | 0 | −100,00 | 0 | |||||
| 2025-07-28 | NP | PCEF - Invesco CEF Income Composite ETF This fund is a listed as child fund of Invesco Ltd. and if that institution has disclosed ownership in this security, then these positions will not be double counted when calculating total shares and total value | 1 465 087 | −0,51 | 19 735 | −3,24 | ||||
| 2025-08-13 | 13F | Rsm Us Wealth Management Llc | 17 671 | −0,82 | 250 | 5,04 | ||||
| 2025-05-06 | 13F | Venturi Wealth Management, LLC | 0 | −100,00 | 0 | |||||
| 2025-07-22 | 13F | DAVENPORT & Co LLC | 13 927 | 0,00 | 193 | 6,04 | ||||
| 2025-07-30 | 13F | D.a. Davidson & Co. | 48 594 | 0,70 | 674 | 6,48 | ||||
| 2025-08-14 | 13F | UBS Group AG | 1 488 300 | −4,04 | 20 658 | 1,52 | ||||
| 2025-08-04 | 13F | Spire Wealth Management | 37 364 | 10,23 | 519 | 16,67 | ||||
| 2025-08-08 | 13F | Avantax Advisory Services, Inc. | 22 147 | 18,73 | 307 | 25,82 | ||||
| 2025-08-05 | 13F | Prosperity Wealth Management, Inc. | 123 745 | 1,21 | 1 718 | 7,04 | ||||
| 2025-08-06 | 13F | Marco Investment Management Llc | 27 300 | 0,00 | 379 | 5,59 | ||||
| 2025-08-12 | 13F | Founders Financial Alliance, LLC | 12 908 | −0,20 | 179 | 5,92 | ||||
| 2025-08-14 | 13F | Kovitz Investment Group Partners, LLC | 105 731 | 39,30 | 1 468 | 47,54 | ||||
| 2025-08-14 | 13F | Bank Of America Corp /de/ | 823 947 | 2,94 | 11 436 | 8,90 | ||||
| 2025-08-12 | 13F | Armor Investment Advisors, LLC | 19 673 | −0,07 | 273 | 5,81 | ||||
| 2025-07-28 | 13F | Harbour Investments, Inc. | 1 825 | 25 | ||||||
| 2025-08-19 | 13F | National Asset Management, Inc. | 31 119 | −70,37 | 432 | −70,66 | ||||
| 2025-07-29 | 13F | Private Trust Co Na | 2 000 | −12,78 | 28 | −10,00 | ||||
| 2025-07-25 | 13F | Allspring Global Investments Holdings, LLC | 905 057 | 42,10 | 12 562 | 50,34 | ||||
| 2025-07-14 | 13F | Farmers & Merchants Investments Inc | 1 850 | 0,00 | 26 | 4,17 | ||||
| 2025-08-14 | 13F | NCP Inc. | 127 332 | 0,82 | 1 767 | 6,64 | ||||
| 2025-07-29 | 13F | Sims Investment Management, Llc | 60 100 | 0,00 | 834 | 5,84 | ||||
| 2025-08-14 | 13F | Glen Eagle Advisors, LLC | 15 970 | −21,96 | 222 | −17,54 | ||||
| 2025-08-14 | 13F | Cnh Partners Llc | 361 193 | −23,44 | 4 992 | −18,61 | ||||
| 2025-08-13 | 13F | Baird Financial Group, Inc. | 29 808 | −4,34 | 414 | 1,23 | ||||
| 2025-08-05 | 13F | Shaker Financial Services, LLC | 77 595 | −62,94 | 1 106 | −60,77 | ||||
| 2025-08-13 | 13F | Colonial Trust Co / SC | 254 | 0,00 | 3 | 0,00 | ||||
| 2025-08-04 | 13F | Horizon Wealth Management, LLC | 11 660 | 0,00 | 162 | 5,92 | ||||
| 2025-07-16 | 13F | St Germain D J Co Inc | 187 | 0,00 | 3 | 0,00 | ||||
| 2025-08-13 | 13F | Colonial Trust Advisors | 2 200 | 31 | ||||||
| 2025-08-27 | NP | RYMSX - Guggenheim Multi-Hedge Strategies Fund Class P | 137 | −37,44 | 2 | −50,00 | ||||
| 2025-08-11 | 13F | Annis Gardner Whiting Capital Advisors, LLC | 3 000 | 0,00 | 42 | 5,13 | ||||
| 2025-08-12 | 13F | CIBC Private Wealth Group, LLC | 33 | 0,00 | 0 | |||||
| 2025-08-18 | 13F | Arq Wealth Advisors, Llc | 0 | −100,00 | 0 | |||||
| 2025-08-05 | 13F | Sage Capital Management, LLC | 255 095 | 2,35 | 3 541 | 8,26 | ||||
| 2025-08-12 | 13F | Coldstream Capital Management Inc | 0 | −100,00 | 0 | |||||
| 2025-08-06 | 13F | SOUTH STATE Corp | 978 | 0,00 | 14 | 8,33 | ||||
| 2025-07-25 | 13F | Integrated Capital Management, Inc. | 23 069 | 2,70 | 320 | 8,84 | ||||
| 2025-08-11 | 13F | Nations Financial Group Inc, /ia/ /adv | 20 877 | −6,92 | 290 | −1,70 | ||||
| 2025-08-14 | 13F | Wealth Preservation Advisors, LLC | 7 655 | 0,00 | 106 | 6,00 | ||||
| 2025-08-05 | 13F | Huntington National Bank | 35 | 0,00 | ||||||
| 2025-07-15 | 13F | Financial Management Professionals, Inc. | 314 | 0,00 | 4 | 0,00 | ||||
| 2025-08-04 | 13F | Kovack Advisors, Inc. | 12 778 | −3,77 | 177 | 1,72 | ||||
| 2025-04-22 | 13F | Castleview Partners, Llc | 0 | −100,00 | 0 | |||||
| 2025-07-24 | 13F | Us Bancorp \de\ | 5 000 | 0,00 | 69 | 6,15 | ||||
| 2025-07-18 | 13F | Truist Financial Corp | 41 249 | −0,07 | 573 | 5,73 | ||||
| 2025-07-07 | 13F | Bangor Savings Bank | 1 057 | −45,99 | 15 | −44,00 | ||||
| 2025-08-13 | 13F | Summit Financial, LLC | 26 414 | 116,45 | 373 | 133,13 | ||||
| 2025-08-06 | 13F | Prospera Financial Services Inc | 100 783 | 1,49 | 1 399 | 7,37 | ||||
| 2025-07-08 | 13F | Apella Capital, LLC | 15 035 | 0,00 | 209 | 8,33 | ||||
| 2025-07-21 | 13F | Pflug Koory, LLC | 33 682 | 0,00 | 468 | 5,90 | ||||
| 2025-07-17 | 13F | Jackson, Grant Investment Advisers, Inc. | 31 103 | 1,49 | 432 | 7,21 | ||||
| 2025-08-14 | 13F | Ameriprise Financial Inc | 313 236 | −21,45 | 4 334 | −17,17 | ||||
| 2025-08-20 | NP | ADANX - AQR Diversified Arbitrage Fund Class N | 119 046 | −13,55 | 1 652 | −8,53 | ||||
| 2025-08-06 | 13F | Moors & Cabot, Inc. | 73 052 | −44,65 | 1 014 | −41,48 | ||||
| 2025-08-08 | 13F | Cetera Investment Advisers | 153 547 | 8,89 | 2 131 | 15,19 | ||||
| 2025-08-18 | 13F | Geneos Wealth Management Inc. | 9 252 | −1,76 | 128 | 4,07 | ||||
| 2025-07-08 | 13F | Arlington Trust Co LLC | 6 000 | 0,00 | 83 | 6,41 | ||||
| 2025-07-23 | 13F | Tyche Wealth Partners LLC | 25 640 | 0,07 | 356 | 5,65 | ||||
| 2025-08-14 | 13F | CoreFirst Bank & Trust | 930 | 13 | ||||||
| 2025-08-22 | NP | Cornerstone Total Return Fund Inc | 87 486 | −63,05 | 1 214 | −60,91 | ||||
| 2025-07-16 | 13F | Encompass Wealth Advisors, Llc | 14 207 | −37,20 | 197 | −33,45 | ||||
| 2025-04-23 | 13F | Continuum Advisory, LLC | 0 | −100,00 | 0 | |||||
| 2025-08-13 | 13F | Northwestern Mutual Wealth Management Co | 47 387 | 3,15 | 658 | 9,14 | ||||
| 2025-05-15 | 13F | Gwn Securities Inc. | 0 | −100,00 | 0 | |||||
| 2025-08-14 | 13F | Raymond James Financial Inc | 951 409 | −0,65 | 13 206 | 5,11 | ||||
| 2025-08-07 | 13F | Allworth Financial LP | 36 858 | 244,79 | 512 | 278,52 | ||||
| 2025-08-11 | 13F | HighTower Advisors, LLC | 37 334 | −13,43 | 518 | −8,32 | ||||
| 2025-07-07 | 13F | Centurion Wealth Management LLC | 12 318 | 0,00 | 171 | −1,16 | ||||
| 2025-07-10 | 13F | Global Financial Private Client, LLC | 0 | −100,00 | 0 | |||||
| 2025-07-29 | 13F | Commons Capital, Llc | 15 127 | 1,34 | 210 | 7,18 | ||||
| 2025-07-24 | 13F | Eastern Bank | 2 199 | 0,00 | 31 | 7,14 | ||||
| 2025-08-11 | 13F | Alteri Wealth LLC | 47 955 | 10,48 | 666 | 16,87 | ||||
| 2025-06-04 | 13F | Pvg Asset Management Corp | 0 | −100,00 | 0 | |||||
| 2025-07-01 | 13F | Harbor Investment Advisory, Llc | 2 468 | 0,00 | 34 | 6,25 | ||||
| 2025-07-25 | 13F | Atria Wealth Solutions, Inc. | 14 914 | −69,25 | 211 | −67,34 | ||||
| 2025-07-21 | 13F | Patriot Financial Group Insurance Agency, LLC | 27 630 | 0,93 | 384 | 6,69 | ||||
| 2025-08-08 | 13F | Pnc Financial Services Group, Inc. | 32 256 | 29,21 | 448 | 36,70 | ||||
| 2025-05-14 | 13F | ICONIQ Capital, LLC | 0 | −100,00 | 0 | |||||
| 2025-07-16 | 13F | Investment Partners Asset Management, Inc. | 37 219 | −0,24 | 517 | 5,52 | ||||
| 2025-08-08 | 13F | Fortis Group Advisors, LLC | 250 | 0,00 | 3 | 0,00 | ||||
| 2025-08-14 | 13F/A | Rockefeller Capital Management L.P. | 34 524 | 1,75 | 479 | 7,64 | ||||
| 2025-04-25 | 13F | Smallwood Wealth Investment Management, LLC | 4 027 | 53 | ||||||
| 2025-08-13 | 13F | MONECO Advisors, LLC | 257 967 | −2,18 | 3 581 | 3,50 | ||||
| 2025-08-12 | 13F | Bokf, Na | 0 | −100,00 | 0 | |||||
| 2025-08-12 | 13F | Richmond Investment Services, LLC | 114 171 | 95,73 | 1 585 | 107,06 | ||||
| 2025-05-08 | 13F | Essential Planning, LLC. | 0 | −100,00 | 0 | |||||
| 2025-05-07 | 13F | Sheaff Brock Investment Advisors, LLC | 13 188 | −0,08 | 173 | −5,98 | ||||
| 2025-09-04 | 13F/A | Advisor Group Holdings, Inc. | 380 959 | 3,05 | 5 288 | 9,03 | ||||
| 2025-08-14 | 13F | Quantedge Capital Pte Ltd | 0 | −100,00 | 0 | |||||
| 2025-07-18 | 13F | TPG Advisors LLC | 138 713 | −0,49 | 1 925 | 5,31 | ||||
| 2025-08-05 | 13F | Palogic Value Management, L.P. | 21 371 | −2,29 | 297 | 3,50 | ||||
| 2025-05-06 | 13F | Atria Investments Llc | 0 | −100,00 | 0 | |||||
| 2025-07-15 | 13F | Shulman DeMeo Asset Management LLC | 96 095 | −0,12 | 1 334 | 5,63 | ||||
| 2025-07-11 | 13F | Pinnacle Bancorp, Inc. | 2 895 | 40 | ||||||
| 2025-08-08 | 13F | Creative Planning | 0 | −100,00 | 0 | |||||
| 2025-08-11 | 13F | WPG Advisers, LLC | 683 | −35,63 | 9 | −30,77 | ||||
| 2025-08-13 | 13F | Green Harvest Asset Management LLC | 15 760 | 0,00 | 219 | 5,83 | ||||
| 2025-08-08 | 13F | Islay Capital Management, Llc | 76 317 | −4,91 | 1 059 | 0,67 | ||||
| 2025-08-14 | 13F | Comerica Bank | 92 866 | 3,05 | 1 289 | 8,97 | ||||
| 2025-08-14 | 13F | CoreCap Advisors, LLC | 20 656 | 55,19 | 287 | 64,37 | ||||
| 2025-06-12 | 13F/A | Deutsche Bank Ag\ | 0 | −100,00 | 0 | |||||
| 2025-08-14 | 13F | Great Valley Advisor Group, Inc. | 0 | −100,00 | 0 | |||||
| 2025-08-14 | 13F | Wetherby Asset Management Inc | 26 302 | 109,85 | 365 | 108,57 | ||||
| 2025-04-16 | 13F | Fortitude Family Office, LLC | 0 | −100,00 | 0 | |||||
| 2025-08-12 | 13F | Jpmorgan Chase & Co | 2 528 | 4,08 | 35 | 12,90 | ||||
| 2025-08-13 | 13F | Guggenheim Capital Llc | 723 627 | 8,17 | 10 044 | 14,44 | ||||
| 2025-05-02 | 13F | Legacy Capital Wealth Partners, LLC | 0 | −100,00 | 0 | −100,00 | ||||
| 2025-08-14 | 13F | Stifel Financial Corp | 302 608 | 7,54 | 4 200 | 13,79 | ||||
| 2025-07-30 | 13F | FNY Investment Advisers, LLC | 5 000 | 0,00 | 0 | |||||
| 2025-08-14 | 13F | Jane Street Group, Llc | 0 | −100,00 | 0 | |||||
| 2025-08-15 | 13F | Morgan Stanley | 11 835 003 | 2,03 | 164 270 | 7,94 | ||||
| 2025-08-04 | 13F | Wolverine Asset Management Llc | 0 | −100,00 | 0 | |||||
| 2025-07-16 | 13F | Instrumental Wealth, Llc | 25 251 | 5,92 | 353 | 15,41 | ||||
| 2025-08-14 | 13F | Colony Group, LLC | 30 143 | 21,39 | 418 | 28,62 | ||||
| 2025-07-30 | 13F | Patten Group, Inc. | 58 215 | −0,73 | 808 | 5,07 | ||||
| 2025-07-31 | 13F | Blake Schutter Theil Wealth Advisors, LLC | 68 604 | 0,24 | 952 | 6,13 | ||||
| 2025-08-07 | 13F | Clarity Wealth Advisors, LLC | 10 091 | −17,10 | 140 | −11,95 | ||||
| 2025-07-11 | 13F | Farther Finance Advisors, LLC | 3 600 | 380,00 | 50 | 444,44 | ||||
| 2025-07-23 | 13F | Ameliora Wealth Management Ltd. | 200 | 0,00 | 3 | 0,00 | ||||
| 2025-08-22 | NP | Cornerstone Strategic Value Fund Inc | 293 198 | −36,79 | 4 070 | −33,13 |