Grunnleggende statistikk
| Institusjonelle eiere | 134 total, 134 long only, 0 short only, 0 long/short - change of 4,65% MRQ |
| Gjennomsnittlig porteføljeallokering | 0.1246 % - change of 5,87% MRQ |
| Institusjonelle aksjer (Long) | 7 030 847 (ex 13D/G) - change of 0,21MM shares 3,10% MRQ |
| Institusjonell verdi (Long) | $ 249 064 USD ($1000) |
Institusjonelt eierskap og aksjonærer
BlackRock Science and Technology Trust (US:BST) har 134 institusjonelle eiere og aksjonærer som har sendt inn 13D/G- eller 13F-skjemaer til Securities Exchange Commission (SEC). Disse institusjonene eier til sammen 7,030,847 aksjer. De største aksjonærene inkluderer Morgan Stanley, Raymond James Financial Inc, Ameriprise Financial Inc, Invesco Ltd., PCEF - Invesco CEF Income Composite ETF, Karpus Management, Inc., Royal Bank Of Canada, 1607 Capital Partners, LLC, LPL Financial LLC, and Wedbush Securities Inc .
BlackRock Science and Technology Trust (NYSE:BST) institusjonell eierstruktur viser nåværende posisjoner i selskapet fordelt på institusjoner og fond, samt de siste endringene i posisjonsstørrelse. De største aksjonærene kan være individuelle investorer, verdipapirfond, hedgefond eller institusjoner. Schedule 13D indikerer at investoren eier (eller har eid) mer enn 5 % av selskapet og har til hensikt (eller hadde til hensikt) å aktivt forfølge en endring i forretningsstrategien. Schedule 13G indikerer en passiv investering på over 5 %.
The share price as of September 10, 2025 is 40,41 / share. Previously, on September 11, 2024, the share price was 34,13 / share. This represents an increase of 18,40% over that period.

Fondssentiment-score
Fondssentiment Score (også kjent som akkumulering av eierskap poengsum) viser hvilke aksjer som er mest kjøpt av fond. Den er resultatet av en sofistikert, kvantitativ flerfaktormodell som identifiserer selskaper med de høyeste nivåene av institusjonell akkumulering. Beregningsmodellen for poeng bruker en kombinasjon av den totale økningen i antall offentliggjorte eiere, endringer i porteføljeallokeringen til disse eierne og andre beregninger. Tallet går fra 0 til 100, der høyere tall indikerer en høyere grad av akkumulering i forhold til sammenlignbare selskaper, der 50 er gjennomsnittet.
Oppdateringsfrekvens: Daglig
Sjekk ut Ownership Explorer, som inneholder en liste over de høyest rangerte selskapene.
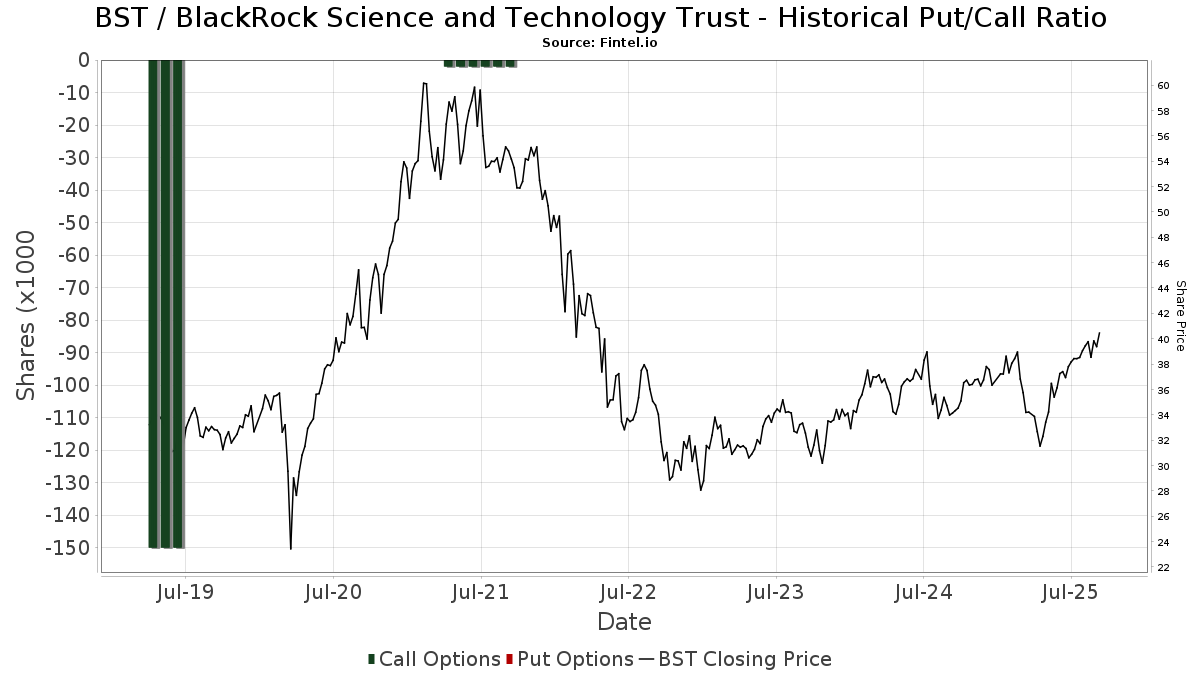
Institusjonell Put/Call-forhold
I tillegg til å rapportere standard aksje- og gjeldsemisjoner må institusjoner med mer enn 100 millioner kroner i forvaltningskapital også oppgi beholdningen av put- og callopsjoner. Siden put-opsjoner generelt indikerer et negativt sentiment, og call-opsjoner indikerer et positivt sentiment, kan vi få et inntrykk av det generelle institusjonelle sentimentet ved å plotte forholdet mellom put- og call-opsjoner. Diagrammet til høyre viser det historiske forholdet mellom put- og call-opsjoner for dette instrumentet.
Ved å bruke Put/Call-forholdet som en indikator på investorsentimentet kan man overvinne en av de viktigste svakhetene ved å bruke totalt institusjonelt eierskap, nemlig at en betydelig andel av forvaltningskapitalen investeres passivt for å følge indekser. Passivt forvaltede fond kjøper vanligvis ikke opsjoner, slik at indikatoren for put/call-forhold i større grad gjenspeiler stemningen i aktivt forvaltede fond.
13F- og NPORT-arkiveringer
Detaljer om 13F-arkiveringer er gratis. Detaljer om NP-arkiveringer krever et premium-medlemskap. Grønne rader indikerer nye posisjoner. Røde rader indikerer lukkede posisjoner. Klikk på lenke ikonet for å se hele transaksjonshistorikken.
Oppgrader
for å låse opp premiedata og eksportere til Excel. ![]() .
.
| Fildato | Kilde | Investor | Type | Gjennomsnittlig pris (estimert) |
Aksjer | Δ Aksjer (%) |
Rapportert verdi ($1000) | Verdi (%) | Portallokering (%) | |
|---|---|---|---|---|---|---|---|---|---|---|
| 2025-07-08 | 13F | Parallel Advisors, LLC | 721 | 8,26 | 28 | 28,57 | ||||
| 2025-09-04 | 13F/A | Advisor Group Holdings, Inc. | 148 258 | 9,57 | 5 659 | 26,77 | ||||
| 2025-07-10 | 13F | Focus Financial Network, Inc. | 15 773 | 9,37 | 602 | 26,74 | ||||
| 2025-08-05 | 13F | Westside Investment Management, Inc. | 700 | 0,00 | 27 | 13,04 | ||||
| 2025-08-04 | 13F | Creative Financial Designs Inc /adv | 313 | 0,00 | 12 | 10,00 | ||||
| 2025-08-14 | 13F | Federation des caisses Desjardins du Quebec | 970 | 0,00 | 37 | 15,63 | ||||
| 2025-08-14 | 13F | Stifel Financial Corp | 59 465 | 8,80 | 2 270 | 25,85 | ||||
| 2025-07-18 | 13F | Consolidated Portfolio Review Corp | 6 901 | −1,16 | 263 | 14,35 | ||||
| 2025-08-13 | 13F | Capital Analysts, Inc. | 660 | 0,00 | 0 | |||||
| 2025-08-14 | 13F | Goldman Sachs Group Inc | 8 347 | 35,79 | 319 | 57,43 | ||||
| 2025-08-14 | 13F | Royal Bank Of Canada | 296 112 | −0,24 | 11 303 | 15,44 | ||||
| 2025-05-13 | 13F | NINE MASTS CAPITAL Ltd | 0 | −100,00 | 0 | |||||
| 2025-08-12 | 13F | LPL Financial LLC | 260 467 | 4,24 | 9 942 | 20,61 | ||||
| 2025-08-08 | 13F | Larson Financial Group LLC | 1 115 | 0,00 | 43 | 16,67 | ||||
| 2025-08-14 | 13F | Comerica Bank | 2 330 | 8,47 | 89 | 25,71 | ||||
| 2025-08-08 | 13F | Calamos Advisors LLC | 8 586 | 1,11 | 328 | 16,79 | ||||
| 2025-07-25 | 13F | Cwm, Llc | 3 336 | −2,54 | 0 | |||||
| 2025-08-05 | 13F | EPG Wealth Management LLC | 0 | −100,00 | 0 | |||||
| 2025-08-14 | 13F | Hilltop Holdings Inc. | 14 988 | 5,39 | 572 | 21,96 | ||||
| 2025-05-15 | 13F | Parvin Asset Management, LLC | 0 | −100,00 | 0 | |||||
| 2025-08-12 | 13F | Jpmorgan Chase & Co | 3 859 | 36,55 | 147 | 58,06 | ||||
| 2025-07-22 | 13F | Kessler Investment Group, LLC | 7 | 0,00 | 0 | |||||
| 2025-08-08 | 13F | Cetera Investment Advisers | 49 871 | 3,68 | 1 904 | 19,99 | ||||
| 2025-08-04 | 13F | Spire Wealth Management | 180 | −79,82 | 7 | −79,31 | ||||
| 2025-08-12 | 13F | Global Retirement Partners, LLC | 1 096 | 0,00 | 42 | 2,50 | ||||
| 2025-07-11 | 13F | Farther Finance Advisors, LLC | 9 | 0,00 | 0 | |||||
| 2025-07-24 | 13F | JNBA Financial Advisors | 359 | 0,00 | 14 | 18,18 | ||||
| 2025-08-07 | 13F | Mosaic Financial Group, Llc | 0 | −100,00 | 0 | |||||
| 2025-08-04 | 13F | Arkadios Wealth Advisors | 7 297 | −10,40 | 279 | 3,73 | ||||
| 2025-07-10 | 13F | Stolper Co | 18 390 | 4,78 | 1 | |||||
| 2025-08-27 | NP | RYMSX - Guggenheim Multi-Hedge Strategies Fund Class P | 13 | −91,28 | 0 | −100,00 | ||||
| 2025-07-07 | 13F | Investors Research Corp | 250 | 10 | ||||||
| 2025-07-31 | 13F | Cambridge Investment Research Advisors, Inc. | 46 043 | −28,85 | 2 | −50,00 | ||||
| 2025-07-16 | 13F | Perigon Wealth Management, LLC | 6 826 | −11,42 | 261 | 2,36 | ||||
| 2025-07-17 | 13F | Janney Montgomery Scott LLC | 148 438 | 0,41 | 6 | 25,00 | ||||
| 2025-08-14 | 13F | Ameriprise Financial Inc | 434 074 | −2,22 | 16 576 | 13,19 | ||||
| 2025-08-14 | 13F | Great Valley Advisor Group, Inc. | 9 980 | 0,00 | 381 | 15,50 | ||||
| 2025-05-12 | 13F | Fmr Llc | 0 | −100,00 | 0 | |||||
| 2025-08-14 | 13F | UBS Group AG | 123 252 | 7,50 | 4 705 | 24,38 | ||||
| 2025-08-27 | NP | RYDEX VARIABLE TRUST - Multi-Hedge Strategies Fund Variable Annuity | 22 | −78,85 | 1 | −100,00 | ||||
| 2025-07-28 | 13F | BRYN MAWR TRUST Co | 2 150 | 0,00 | 82 | 17,14 | ||||
| 2025-08-12 | 13F | J.w. Cole Advisors, Inc. | 32 451 | 13,47 | 1 239 | 31,28 | ||||
| 2025-08-15 | 13F | Kestra Advisory Services, LLC | 21 646 | 3,90 | 826 | 20,23 | ||||
| 2025-05-16 | 13F | Arete Wealth Advisors, LLC | 0 | −100,00 | 0 | |||||
| 2025-07-18 | 13F | TruNorth Capital Management, LLC | 100 | 2,04 | 4 | 0,00 | ||||
| 2025-08-06 | 13F | Prospera Financial Services Inc | 14 685 | 0,44 | 561 | 16,18 | ||||
| 2025-08-14 | 13F | Balyasny Asset Management Llc | 37 096 | 1 416 | ||||||
| 2025-07-08 | 13F | Next Level Private LLC | 9 521 | 1,31 | 363 | 17,10 | ||||
| 2025-08-01 | 13F | Boyd Watterson Asset Management Llc/oh | 96 | 0,00 | 4 | 0,00 | ||||
| 2025-07-31 | 13F | Oppenheimer & Co Inc | 44 407 | 3,72 | 1 695 | 20,04 | ||||
| 2025-08-14 | 13F/A | Rockefeller Capital Management L.P. | 10 133 | 0,66 | 387 | 16,27 | ||||
| 2025-07-08 | 13F | Nbc Securities, Inc. | 16 431 | −0,02 | 1 | |||||
| 2025-08-05 | 13F | Huntington National Bank | 80 | 15,94 | ||||||
| 2025-07-18 | 13F | Truist Financial Corp | 32 373 | 8,09 | 1 236 | 25,00 | ||||
| 2025-08-19 | 13F | National Asset Management, Inc. | 9 834 | 15,68 | 375 | 20,97 | ||||
| 2025-08-06 | 13F | Wedbush Securities Inc | 220 815 | −8,97 | 8 | 0,00 | ||||
| 2025-08-04 | 13F | Bay Colony Advisory Group, Inc d/b/a Bay Colony Advisors | 8 221 | 2,57 | 314 | 16,79 | ||||
| 2025-08-14 | 13F | Jane Street Group, Llc | 10 777 | −48,48 | 411 | −40,43 | ||||
| 2025-08-14 | 13F | Polar Asset Management Partners Inc. | 14 730 | 1,47 | 562 | 17,57 | ||||
| 2025-07-14 | 13F | AdvisorNet Financial, Inc | 1 363 | 83,69 | 52 | 116,67 | ||||
| 2025-08-05 | 13F | Claro Advisors LLC | 8 594 | 1,17 | 328 | 17,14 | ||||
| 2025-08-12 | 13F | NFP Retirement, Inc. | 58 527 | −1,91 | 2 234 | 13,47 | ||||
| 2025-07-25 | 13F | Atria Wealth Solutions, Inc. | 12 482 | 477 | ||||||
| 2025-07-14 | 13F | Armstrong Advisory Group, Inc | 352 | 13 | ||||||
| 2025-07-18 | 13F | Trust Co Of Vermont | 1 500 | 0,00 | 57 | 16,33 | ||||
| 2025-08-01 | 13F | Envestnet Asset Management Inc | 27 410 | 2,53 | 1 046 | 18,73 | ||||
| 2025-07-29 | 13F | International Assets Investment Management, Llc | 13 652 | 2,32 | 521 | 18,41 | ||||
| 2025-08-07 | 13F | Readystate Asset Management Lp | 8 971 | 342 | ||||||
| 2025-08-13 | 13F | Northwestern Mutual Wealth Management Co | 7 210 | 11,80 | 275 | 29,72 | ||||
| 2025-07-25 | NP | FCEF - First Trust CEF Income Opportunity ETF This fund is a listed as child fund of First Trust Advisors Lp and if that institution has disclosed ownership in this security, then these positions will not be double counted when calculating total shares and total value | 35 204 | 10,38 | 1 284 | 10,32 | ||||
| 2025-07-14 | 13F | UMA Financial Services, Inc. | 307 | 0,00 | 12 | 10,00 | ||||
| 2025-08-08 | 13F | Kingsview Wealth Management, LLC | 24 453 | 0,00 | 933 | 15,76 | ||||
| 2025-08-12 | 13F | Walled Lake Planning & Wealth Management, Llc | 8 591 | 2,10 | 328 | 18,05 | ||||
| 2025-08-12 | 13F | Virtu Financial LLC | 0 | −100,00 | 0 | |||||
| 2025-07-21 | 13F | Future Financial Wealth Managment LLC | 14 000 | 0,00 | 534 | 15,84 | ||||
| 2025-07-09 | 13F | Mirador Capital Partners LP | 7 597 | 0,73 | 290 | 16,53 | ||||
| 2025-08-13 | 13F | First Trust Advisors Lp | 70 663 | −0,80 | 2 697 | 14,81 | ||||
| 2025-07-23 | 13F | Abel Hall, LLC | 13 000 | 496 | ||||||
| 2025-07-29 | 13F | Stephens Inc /ar/ | 16 485 | 3,13 | 629 | 19,35 | ||||
| 2025-08-19 | 13F | Newbridge Financial Services Group, Inc. | 68 399 | 2 611 | ||||||
| 2025-04-29 | 13F | Hm Payson & Co | 600 | 0,00 | 20 | −9,52 | ||||
| 2025-08-08 | 13F | Capital Investment Advisory Services, LLC | 6 447 | 6,00 | 246 | 23,00 | ||||
| 2025-06-27 | NP | Calamos ETF Trust - Calamos CEF Income & Arbitrage ETF | 7 812 | −34,79 | 261 | −42,38 | ||||
| 2025-08-14 | 13F | Monetary Management Group Inc | 445 | 0,00 | 17 | 14,29 | ||||
| 2025-08-13 | 13F | Level Four Advisory Services, Llc | 5 776 | −17,69 | 220 | −4,76 | ||||
| 2025-08-12 | 13F | Steward Partners Investment Advisory, Llc | 169 148 | −0,34 | 6 456 | 15,31 | ||||
| 2025-07-31 | 13F | Anchor Capital Management Group Inc | 18 000 | 0,00 | 687 | 15,85 | ||||
| 2025-08-13 | 13F | Invesco Ltd. | 432 215 | −12,41 | 16 498 | 1,34 | ||||
| 2025-07-16 | 13F | ORG Partners LLC | 1 033 | −26,42 | 39 | −17,02 | ||||
| 2025-07-28 | 13F | SFG Wealth Management, LLC. | 20 552 | 0,00 | 784 | 15,63 | ||||
| 2025-07-28 | 13F | Mission Hills Financial Advisory, LLC | 13 402 | 512 | ||||||
| 2025-07-24 | 13F | Aurora Private Wealth, Inc. | 8 808 | 1,46 | 0 | |||||
| 2025-08-14 | 13F | MGB Wealth Management, LLC | 0 | −100,00 | 0 | |||||
| 2025-09-09 | 13F | NWF Advisory Services Inc. | 76 735 | 2,31 | 2 929 | 18,35 | ||||
| 2025-08-12 | 13F | MAI Capital Management | 1 162 | 0,17 | 44 | 15,79 | ||||
| 2025-06-26 | NP | ATCAX - Anchor Risk Managed Credit Strategies Fund Advisor Class Shares | 18 000 | 0,00 | 656 | 0,00 | ||||
| 2025-07-25 | 13F | Apollon Wealth Management, LLC | 17 980 | 20,24 | 686 | 39,15 | ||||
| 2025-08-06 | 13F | New Millennium Group LLC | 1 | 0 | ||||||
| 2025-08-14 | 13F | Karpus Management, Inc. | 322 983 | 7,39 | 12 328 | 24,25 | ||||
| 2025-07-15 | 13F | Wealth Effects Llc | 14 685 | −14,42 | 561 | −1,06 | ||||
| 2025-08-14 | 13F | Raymond James Financial Inc | 1 045 902 | 2,38 | 39 922 | 18,46 | ||||
| 2025-08-14 | 13F | Herold Advisors, Inc. | 6 233 | 1,65 | 238 | 17,33 | ||||
| 2025-07-24 | 13F | Ronald Blue Trust, Inc. | 100 | 4 | ||||||
| 2025-08-14 | 13F | 1607 Capital Partners, LLC | 284 950 | −8,54 | 10 877 | 5,82 | ||||
| 2025-07-24 | 13F | Jfs Wealth Advisors, Llc | 383 | 0,00 | 15 | 16,67 | ||||
| 2025-08-07 | 13F | Vista Investment Partners Ii, Llc | 6 762 | 0,43 | 258 | 16,22 | ||||
| 2025-05-16 | 13F | Coordinated Financial Services, Inc./CO | 0 | −100,00 | 0 | |||||
| 2025-08-11 | 13F | Principal Securities, Inc. | 2 074 | 12,90 | 79 | 17,91 | ||||
| 2025-08-14 | 13F | Sunbelt Securities, Inc. | 11 435 | 97,16 | 418 | 118,85 | ||||
| 2025-08-07 | 13F | Allworth Financial LP | 7 | 16,67 | 0 | |||||
| 2025-08-08 | 13F | Pnc Financial Services Group, Inc. | 7 840 | −33,50 | 299 | −22,94 | ||||
| 2025-08-05 | 13F | Shaker Financial Services, LLC | 36 014 | 313,15 | 1 375 | 378,75 | ||||
| 2025-08-11 | 13F | Tidemark, LLC | 42 | 0,00 | 2 | 0,00 | ||||
| 2025-08-22 | NP | Cornerstone Strategic Value Fund Inc | 59 383 | 5,85 | 2 267 | 22,49 | ||||
| 2025-08-05 | 13F | Scarborough Advisors, LLC | 259 | 10 | ||||||
| 2025-08-11 | 13F | Elequin Capital Lp | 13 024 | 2 059,87 | 497 | 2 515,79 | ||||
| 2025-08-04 | 13F | Pensionmark Financial Group, Llc | 5 367 | 205 | ||||||
| 2025-07-28 | NP | PCEF - Invesco CEF Income Composite ETF This fund is a listed as child fund of Invesco Ltd. and if that institution has disclosed ownership in this security, then these positions will not be double counted when calculating total shares and total value | 418 145 | −5,67 | 15 246 | −5,70 | ||||
| 2025-07-09 | 13F | David J Yvars Group | 28 045 | 0,57 | 1 071 | 16,03 | ||||
| 2025-08-14 | 13F | GWM Advisors LLC | 820 | 1,61 | 31 | 19,23 | ||||
| 2025-08-12 | 13F | Proequities, Inc. | 0 | 0 | ||||||
| 2025-08-06 | 13F | Commonwealth Equity Services, Llc | 39 897 | −1,40 | 2 | 0,00 | ||||
| 2025-08-13 | 13F | EverSource Wealth Advisors, LLC | 710 | 0,00 | 27 | 17,39 | ||||
| 2025-08-12 | 13F | BlackRock, Inc. | 0 | −100,00 | 0 | |||||
| 2025-08-12 | 13F | Park Square Financial Group, LLC | 44 | 0,00 | 2 | 0,00 | ||||
| 2025-05-06 | 13F | Venturi Wealth Management, LLC | 0 | −100,00 | 0 | |||||
| 2025-08-04 | 13F | Wolverine Asset Management Llc | 13 153 | 502 | ||||||
| 2025-08-13 | 13F | Smith, Moore & Co. | 15 173 | 0,33 | 579 | 16,27 | ||||
| 2025-08-14 | 13F | Wells Fargo & Company/mn | 67 218 | 242,04 | 2 566 | 295,83 | ||||
| 2025-04-21 | 13F | Nelson, Van Denburg & Campbell Wealth Management Group, LLC | 0 | −100,00 | 0 | |||||
| 2025-08-13 | 13F | Keystone Financial Group | 6 734 | 0,00 | 257 | 15,77 | ||||
| 2025-08-04 | 13F | Daymark Wealth Partners, Llc | 5 975 | 228 | ||||||
| 2025-08-14 | 13F | Atomi Financial Group, Inc. | 11 765 | −9,33 | 449 | 4,91 | ||||
| 2025-08-22 | NP | Cornerstone Total Return Fund Inc | 28 142 | 0,00 | 1 074 | 15,73 | ||||
| 2025-08-08 | 13F | Cornerstone Advisors, LLC | 87 525 | 3,90 | 3 341 | 20,19 | ||||
| 2025-08-08 | 13F | Symphony Financial Services, Inc. | 6 311 | −0,71 | 241 | 14,83 | ||||
| 2025-07-01 | 13F | Harbor Investment Advisory, Llc | 3 163 | −9,40 | 121 | 4,35 | ||||
| 2025-07-30 | 13F | D.a. Davidson & Co. | 15 340 | 23,35 | 586 | 42,68 | ||||
| 2025-07-24 | 13F | Us Bancorp \de\ | 0 | −100,00 | 0 | |||||
| 2025-08-14 | 13F | Wealth Preservation Advisors, LLC | 0 | −100,00 | 0 | |||||
| 2025-07-28 | 13F | Mutual Advisors, LLC | 14 245 | 5,40 | 555 | 22,84 | ||||
| 2025-08-14 | 13F | Colony Group, LLC | 0 | −100,00 | 0 | |||||
| 2025-08-14 | 13F | Ambassador Advisors, LLC | 8 673 | 0,91 | 331 | 16,96 | ||||
| 2025-08-15 | 13F | Morgan Stanley | 1 281 194 | −1,47 | 48 903 | 14,00 | ||||
| 2025-08-14 | 13F | Bank Of America Corp /de/ | 192 302 | 1,32 | 7 340 | 17,23 | ||||
| 2025-07-28 | 13F | Harbour Investments, Inc. | 1 455 | 0,00 | 56 | 14,58 | ||||
| 2025-08-11 | 13F | HighTower Advisors, LLC | 35 413 | 1,49 | 1 352 | 17,38 | ||||
| 2025-08-12 | 13F | Boreal Capital Management LLC | 600 | 23 | ||||||
| 2025-08-14 | 13F | IHT Wealth Management, LLC | 0 | −100,00 | 0 | |||||
| 2025-08-15 | 13F | Captrust Financial Advisors | 5 856 | 224 | ||||||
| 2025-05-14 | 13F | Van Hulzen Asset Management, LLC | 0 | −100,00 | 0 | −100,00 | ||||
| 2025-08-14 | 13F | Mercer Global Advisors Inc /adv | 7 449 | 12,74 | 284 | 30,88 | ||||
| 2025-08-14 | 13F | Wiley Bros.-aintree Capital, Llc | 10 056 | 0,26 | 384 | 14,33 |