Grunnleggende statistikk
| Institusjonelle eiere | 117 total, 117 long only, 0 short only, 0 long/short - change of 11,43% MRQ |
| Gjennomsnittlig porteføljeallokering | 0.1730 % - change of −16,22% MRQ |
| Institusjonelle aksjer (Long) | 10 594 764 (ex 13D/G) - change of 0,49MM shares 4,80% MRQ |
| Institusjonell verdi (Long) | $ 221 789 USD ($1000) |
Institusjonelt eierskap og aksjonærer
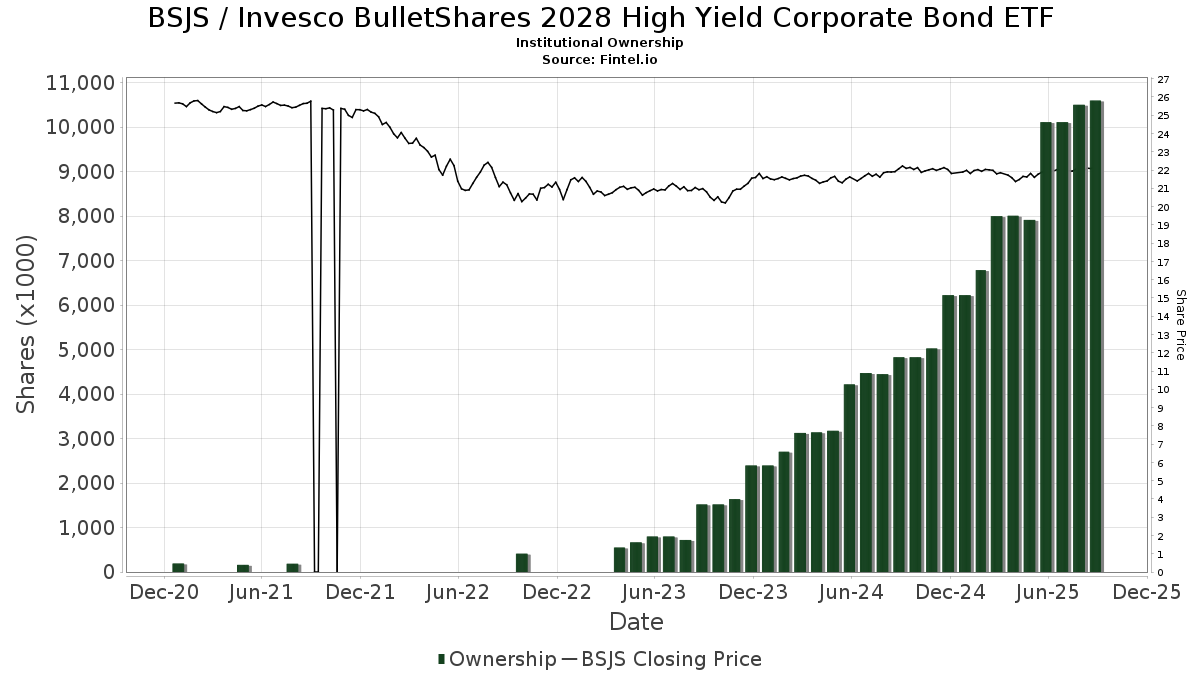
Invesco BulletShares 2028 High Yield Corporate Bond ETF (US:BSJS) har 117 institusjonelle eiere og aksjonærer som har sendt inn 13D/G- eller 13F-skjemaer til Securities Exchange Commission (SEC). Disse institusjonene eier til sammen 10,594,764 aksjer. De største aksjonærene inkluderer LPL Financial LLC, Wells Fargo & Company/mn, Morgan Stanley, Envestnet Asset Management Inc, Cetera Investment Advisers, UBS Group AG, SFE Investment Counsel, Equitable Holdings, Inc., Mercer Global Advisors Inc /adv, and Steward Partners Investment Advisory, Llc .
Invesco BulletShares 2028 High Yield Corporate Bond ETF (NasdaqGM:BSJS) institusjonell eierstruktur viser nåværende posisjoner i selskapet fordelt på institusjoner og fond, samt de siste endringene i posisjonsstørrelse. De største aksjonærene kan være individuelle investorer, verdipapirfond, hedgefond eller institusjoner. Schedule 13D indikerer at investoren eier (eller har eid) mer enn 5 % av selskapet og har til hensikt (eller hadde til hensikt) å aktivt forfølge en endring i forretningsstrategien. Schedule 13G indikerer en passiv investering på over 5 %.
The share price as of September 9, 2025 is 22,14 / share. Previously, on September 10, 2024, the share price was 22,02 / share. This represents an increase of 0,54% over that period.
Fondssentiment-score
Fondssentiment Score (også kjent som akkumulering av eierskap poengsum) viser hvilke aksjer som er mest kjøpt av fond. Den er resultatet av en sofistikert, kvantitativ flerfaktormodell som identifiserer selskaper med de høyeste nivåene av institusjonell akkumulering. Beregningsmodellen for poeng bruker en kombinasjon av den totale økningen i antall offentliggjorte eiere, endringer i porteføljeallokeringen til disse eierne og andre beregninger. Tallet går fra 0 til 100, der høyere tall indikerer en høyere grad av akkumulering i forhold til sammenlignbare selskaper, der 50 er gjennomsnittet.
Oppdateringsfrekvens: Daglig
Sjekk ut Ownership Explorer, som inneholder en liste over de høyest rangerte selskapene.
Institusjonell Put/Call-forhold
I tillegg til å rapportere standard aksje- og gjeldsemisjoner må institusjoner med mer enn 100 millioner kroner i forvaltningskapital også oppgi beholdningen av put- og callopsjoner. Siden put-opsjoner generelt indikerer et negativt sentiment, og call-opsjoner indikerer et positivt sentiment, kan vi få et inntrykk av det generelle institusjonelle sentimentet ved å plotte forholdet mellom put- og call-opsjoner. Diagrammet til høyre viser det historiske forholdet mellom put- og call-opsjoner for dette instrumentet.
Ved å bruke Put/Call-forholdet som en indikator på investorsentimentet kan man overvinne en av de viktigste svakhetene ved å bruke totalt institusjonelt eierskap, nemlig at en betydelig andel av forvaltningskapitalen investeres passivt for å følge indekser. Passivt forvaltede fond kjøper vanligvis ikke opsjoner, slik at indikatoren for put/call-forhold i større grad gjenspeiler stemningen i aktivt forvaltede fond.
13F- og NPORT-arkiveringer
Detaljer om 13F-arkiveringer er gratis. Detaljer om NP-arkiveringer krever et premium-medlemskap. Grønne rader indikerer nye posisjoner. Røde rader indikerer lukkede posisjoner. Klikk på lenke ikonet for å se hele transaksjonshistorikken.
Oppgrader
for å låse opp premiedata og eksportere til Excel. ![]() .
.
| Fildato | Kilde | Investor | Type | Gjennomsnittlig pris (estimert) |
Aksjer | Δ Aksjer (%) |
Rapportert verdi ($1000) | Verdi (%) | Portallokering (%) | |
|---|---|---|---|---|---|---|---|---|---|---|
| 2025-08-01 | 13F | Envestnet Asset Management Inc | 485 597 | 4,84 | 10 707 | 6,82 | ||||
| 2025-04-17 | 13F | Rebalance, Llc | 0 | −100,00 | 0 | |||||
| 2025-08-05 | 13F | Pacific Wealth Strategies Group, Inc. | 31 328 | 172,42 | 687 | 177,02 | ||||
| 2025-04-21 | 13F | Nelson, Van Denburg & Campbell Wealth Management Group, LLC | 0 | −100,00 | 0 | |||||
| 2025-08-12 | 13F | Proequities, Inc. | 0 | 0 | ||||||
| 2025-07-29 | 13F | Tradewinds Capital Management, LLC | 1 215 | 1,76 | 27 | 4,00 | ||||
| 2025-07-28 | 13F | Harbour Investments, Inc. | 48 227 | 2,12 | 1 063 | 4,11 | ||||
| 2025-07-22 | 13F | Net Worth Advisory Group | 17 403 | 21,52 | 384 | 23,95 | ||||
| 2025-07-24 | 13F | IFP Advisors, Inc | 0 | −100,00 | 0 | |||||
| 2025-08-14 | 13F | Arete Wealth Advisors, LLC | 13 923 | 0,00 | 0 | |||||
| 2025-04-22 | 13F | Tassel Capital Management, Inc. | 0 | −100,00 | 0 | |||||
| 2025-09-09 | 13F | Cambridge Financial Group, LLC | 18 942 | 418 | ||||||
| 2025-08-13 | 13F | VestGen Advisors, LLC | 20 337 | 35,48 | 448 | 37,96 | ||||
| 2025-07-25 | 13F | We Are One Seven, LLC | 9 228 | 203 | ||||||
| 2025-08-14 | 13F | Royal Bank Of Canada | 197 775 | 3,89 | 4 361 | 5,88 | ||||
| 2025-08-18 | 13F | Geneos Wealth Management Inc. | 9 751 | 3,32 | 215 | 5,39 | ||||
| 2025-08-19 | 13F | Anchor Investment Management, LLC | 1 425 | 235,29 | 31 | 244,44 | ||||
| 2025-08-12 | 13F | BlackRock, Inc. | 0 | −100,00 | 0 | |||||
| 2025-08-14 | 13F | Integrated Wealth Concepts LLC | 32 804 | 6,52 | 723 | 8,56 | ||||
| 2025-08-08 | 13F | Cetera Investment Advisers | 423 448 | −10,59 | 9 337 | −8,89 | ||||
| 2025-08-12 | 13F | Fca Corp /tx | 49 014 | 1,90 | 1 081 | 3,85 | ||||
| 2025-08-11 | 13F | Aptus Capital Advisors, LLC | 450 | 0,00 | 10 | 0,00 | ||||
| 2025-08-07 | 13F | Private Advisory Group LLC | 22 960 | −2,71 | 506 | −0,78 | ||||
| 2025-07-29 | 13F | BXM Wealth LLC | 10 025 | 221 | ||||||
| 2025-07-11 | 13F | Farther Finance Advisors, LLC | 8 423 | 186 | ||||||
| 2025-09-04 | 13F/A | Advisor Group Holdings, Inc. | 173 216 | 45,01 | 3 820 | 47,79 | ||||
| 2025-07-31 | 13F | Glass Jacobson Investment Advisors llc | 21 559 | 89,30 | 475 | 93,09 | ||||
| 2025-07-09 | 13F | Sarver Vrooman Wealth Advisors | 1 328 | 0,00 | 29 | 3,57 | ||||
| 2025-08-08 | 13F | Foundations Investment Advisors, LLC | 27 282 | 143,52 | 602 | 148,35 | ||||
| 2025-07-22 | 13F | Siligmueller & Norvid Wealth Advisors LLC | 22 520 | −5,74 | 495 | −4,26 | ||||
| 2025-08-06 | 13F | Valtinson Bruner Financial Planning LLC | 19 471 | 0,65 | 429 | 2,63 | ||||
| 2025-08-14 | 13F | Wells Fargo & Company/mn | 747 270 | 0,25 | 16 477 | 2,15 | ||||
| 2025-08-14 | 13F | TCG Advisory Services, LLC | 299 313 | 9,51 | 6 600 | 11,58 | ||||
| 2025-08-14 | 13F | Jane Street Group, Llc | 27 714 | −42,91 | 611 | −41,81 | ||||
| 2025-08-15 | 13F | WFA of San Diego, LLC | 2 294 | 51 | ||||||
| 2025-07-30 | 13F | Brookstone Capital Management | 27 104 | −5,29 | 598 | −3,55 | ||||
| 2025-07-31 | 13F | Oppenheimer & Co Inc | 12 006 | −2,78 | 265 | −1,12 | ||||
| 2025-05-12 | 13F | Fmr Llc | 0 | −100,00 | 0 | |||||
| 2025-08-01 | 13F | Advisory Alpha, LLC | 265 313 | 18,99 | 5 850 | 21,24 | ||||
| 2025-08-12 | 13F | Horizon Financial Services, Llc | 1 582 | −8,87 | 35 | −8,11 | ||||
| 2025-07-10 | 13F | Wealth Enhancement Advisory Services, Llc | 38 571 | −19,98 | 850 | −18,50 | ||||
| 2025-08-12 | 13F | Jpmorgan Chase & Co | 169 | −99,29 | 4 | −99,42 | ||||
| 2025-08-14 | 13F | Susquehanna International Group, Llp | 25 348 | 559 | ||||||
| 2025-08-12 | 13F | J.w. Cole Advisors, Inc. | 11 412 | 0,98 | 252 | 2,87 | ||||
| 2025-07-11 | 13F | AA Financial Advisors, LLC | 15 797 | 348 | ||||||
| 2025-08-07 | 13F | Hennion & Walsh Asset Management, Inc. | 72 463 | 3,98 | 1 598 | 5,90 | ||||
| 2025-08-12 | 13F | Steward Partners Investment Advisory, Llc | 307 039 | −5,26 | 6 770 | −3,46 | ||||
| 2025-07-31 | 13F | Topsail Wealth Management, LLC | 16 060 | 21,76 | 354 | 24,21 | ||||
| 2025-08-08 | 13F | IMA Wealth, Inc. | 32 491 | 0,75 | 716 | 2,73 | ||||
| 2025-07-22 | 13F | 4Thought Financial Group Inc. | 20 899 | −3,25 | 461 | −1,50 | ||||
| 2025-08-13 | 13F | Vermillion & White Wealth Management Group, LLC | 21 269 | −27,28 | 469 | −25,95 | ||||
| 2025-07-29 | 13F | Kraft, Davis & Associates, LLC | 24 925 | 7,57 | 547 | 10,30 | ||||
| 2025-07-24 | 13F | Leo Wealth, LLC | 217 208 | 4 789 | ||||||
| 2025-08-13 | 13F | Capital Analysts, Inc. | 14 703 | 1,15 | 0 | |||||
| 2025-08-15 | 13F | Morgan Stanley | 506 340 | −15,96 | 11 165 | −14,37 | ||||
| 2025-05-12 | 13F | Independent Advisor Alliance | 0 | −100,00 | 0 | |||||
| 2025-08-01 | 13F | MorganRosel Wealth Management, LLC | 5 911 | 0,00 | 130 | 2,36 | ||||
| 2025-08-06 | 13F | Prospera Financial Services Inc | 130 790 | 2,41 | 2 884 | 4,34 | ||||
| 2025-08-06 | 13F | Commonwealth Equity Services, Llc | 95 458 | 24,76 | 2 | 100,00 | ||||
| 2025-07-21 | 13F | Empirical Financial Services, LLC d.b.a. Empirical Wealth Management | 33 891 | 2,64 | 747 | 4,62 | ||||
| 2025-08-14 | 13F | Comerica Bank | 15 260 | −2,40 | 336 | −0,59 | ||||
| 2025-08-07 | 13F | SFE Investment Counsel | 355 613 | 2,05 | 7 841 | 3,99 | ||||
| 2025-07-11 | 13F | Meriwether Wealth & Planning, LLC | 23 005 | 3,93 | 507 | 5,85 | ||||
| 2025-08-05 | 13F | Key FInancial Inc | 18 835 | 41,88 | 415 | 44,60 | ||||
| 2025-07-14 | 13F | Sound Stewardship, LLC | 53 005 | 11,47 | 1 169 | 13,51 | ||||
| 2025-07-31 | 13F | Cambridge Investment Research Advisors, Inc. | 83 117 | 4,18 | 2 | 0,00 | ||||
| 2025-08-18 | 13F | Tyler-Stone Wealth Management | 38 707 | 3,65 | 853 | 5,57 | ||||
| 2025-04-17 | 13F | Missouri Trust & Investment Co | 0 | −100,00 | 0 | |||||
| 2025-04-25 | 13F | Albion Financial Group /ut | 0 | −100,00 | 0 | |||||
| 2025-07-08 | 13F | S.E.E.D. Planning Group LLC | 74 566 | 3,15 | 1 644 | 5,12 | ||||
| 2025-07-24 | 13F | Vantage Point Financial LLC | 46 375 | −1,98 | 1 023 | −0,10 | ||||
| 2025-08-15 | 13F | Captrust Financial Advisors | 259 885 | 6,03 | 5 730 | 8,03 | ||||
| 2025-07-14 | 13F | GAMMA Investing LLC | 4 311 | −92,30 | 95 | −92,15 | ||||
| 2025-08-05 | 13F | Summit Investment Advisory Services, LLC | 112 928 | 2 490 | ||||||
| 2025-08-14 | 13F | UBS Group AG | 391 338 | −15,19 | 8 629 | −13,57 | ||||
| 2025-08-01 | 13F | GPM Growth Investors, Inc. | 210 775 | 11,94 | 4 648 | 14,06 | ||||
| 2025-07-25 | 13F | Cwm, Llc | 0 | −100,00 | 0 | |||||
| 2025-08-01 | 13F | Koss-Olinger Consulting, LLC | 15 643 | −7,43 | 345 | −6,01 | ||||
| 2025-08-04 | 13F | IFG Advisory, LLC | 16 307 | 20,79 | 360 | 22,95 | ||||
| 2025-07-29 | 13F | Alaska Permanent Capital Management | 6 933 | 152 | ||||||
| 2025-08-11 | 13F | Principal Securities, Inc. | 2 926 | 58,76 | 65 | 64,10 | ||||
| 2025-08-14 | 13F | Old Mission Capital Llc | 0 | −100,00 | 0 | |||||
| 2025-08-14 | 13F | Mercer Global Advisors Inc /adv | 341 181 | −2,78 | 7 523 | −0,93 | ||||
| 2025-08-14 | 13F | GWM Advisors LLC | 61 387 | 0,15 | 1 354 | 2,04 | ||||
| 2025-07-23 | 13F | Ironwood Financial, llc | 88 704 | 0,00 | 1 920 | 0,00 | ||||
| 2025-08-04 | 13F | AlphaStar Capital Management, LLC | 16 836 | 1,21 | 371 | 3,34 | ||||
| 2025-07-08 | 13F | Ballew Advisors, Inc | 25 316 | 0,00 | 558 | 4,10 | ||||
| 2025-08-13 | 13F | Brown Advisory Inc | 29 062 | 0,00 | 641 | 1,91 | ||||
| 2025-07-14 | 13F | AdvisorNet Financial, Inc | 28 | 0,00 | 1 | |||||
| 2025-07-29 | 13F | APCM Wealth Management for Individuals | 9 114 | 201 | ||||||
| 2025-08-12 | 13F | SRS Capital Advisors, Inc. | 471 | 10 | ||||||
| 2025-08-13 | 13F | Jones Financial Companies Lllp | 138 195 | 23,01 | 3 035 | 24,70 | ||||
| 2025-08-14 | 13F | Atomi Financial Group, Inc. | 43 273 | 13,51 | 954 | 15,78 | ||||
| 2025-08-07 | 13F | Allworth Financial LP | 300 | 7 | ||||||
| 2025-07-21 | 13F | Ashton Thomas Securities, Llc | 57 764 | 0,38 | 1 274 | 2,25 | ||||
| 2025-08-12 | 13F | Kaye Capital Management | 0 | −100,00 | 0 | |||||
| 2025-08-14 | 13F | Ameriprise Financial Inc | 209 104 | 5,52 | 4 611 | 7,66 | ||||
| 2025-07-18 | 13F | Consolidated Portfolio Review Corp | 42 491 | 8,19 | 937 | 10,25 | ||||
| 2025-08-05 | 13F | Bank Of Montreal /can/ | 0 | −100,00 | 0 | |||||
| 2025-08-14 | 13F | Stifel Financial Corp | 83 155 | 15,18 | 1 834 | 17,35 | ||||
| 2025-07-11 | 13F | Quad-Cities Investment Group, LLC | 9 161 | 202 | ||||||
| 2025-08-14 | 13F | Bank Of America Corp /de/ | 91 342 | 34,77 | 2 014 | 37,38 | ||||
| 2025-07-29 | 13F | Stephens Inc /ar/ | 16 006 | −18,49 | 353 | −16,98 | ||||
| 2025-08-06 | 13F | Summit Investment Advisors, Inc. | 121 173 | 10,19 | 2 662 | 11,99 | ||||
| 2025-08-11 | 13F | Oder Investment Management, LLC | 29 059 | 5,54 | 641 | 7,56 | ||||
| 2025-08-19 | 13F | Asset Dedication, LLC | 4 350 | 96 | ||||||
| 2025-08-11 | 13F | Cornerstone Planning Group LLC | 93 | 2 | ||||||
| 2025-08-14 | 13F | Mml Investors Services, Llc | 124 541 | 18,26 | 3 | 0,00 | ||||
| 2025-08-11 | 13F | Private Advisor Group, LLC | 21 742 | 6,55 | 479 | 8,62 | ||||
| 2025-07-31 | 13F | Strait & Sound Wealth Management LLC | 65 231 | 33,61 | 1 438 | 36,17 | ||||
| 2025-07-31 | 13F | Turning Point Benefit Group, Inc. | 33 075 | 64,45 | 729 | 72,75 | ||||
| 2025-08-08 | 13F | Larson Financial Group LLC | 7 866 | 1,69 | 173 | 3,59 | ||||
| 2025-08-11 | 13F | Shufro Rose & Co Llc | 10 000 | 0,00 | 216 | 0,00 | ||||
| 2025-07-31 | 13F | Carnegie Capital Asset Management, LLC | 14 350 | 316 | ||||||
| 2025-08-06 | 13F | Altrius Capital Management Inc | 30 679 | 50,57 | 676 | 53,64 | ||||
| 2025-07-07 | 13F | Horizons Wealth Management | 3 069 | 0,00 | 68 | 1,52 | ||||
| 2025-07-21 | 13F | Segment Wealth Management, LLC | 52 060 | −1,42 | 1 148 | 0,44 | ||||
| 2025-08-14 | 13F | Raymond James Financial Inc | 156 154 | −47,81 | 3 443 | −46,82 | ||||
| 2025-07-17 | 13F | Wolff Wiese Magana Llc | 1 025 | 48,12 | 23 | 57,14 | ||||
| 2025-05-07 | 13F | Vista Private Wealth Partners. LLC | 0 | −100,00 | 0 | |||||
| 2025-08-11 | 13F | Howard Wealth Management, Llc | 97 735 | −0,53 | 2 155 | 1,36 | ||||
| 2025-08-13 | 13F | Invesco Ltd. | 124 113 | 29,12 | 2 737 | 31,54 | ||||
| 2025-07-15 | 13F | Legacy Financial Group LLC | 27 076 | 6,28 | 597 | 8,35 | ||||
| 2025-08-12 | 13F | LPL Financial LLC | 1 382 592 | 21,46 | 30 486 | 23,76 | ||||
| 2025-04-10 | 13F | Retireful, LLC | 0 | −100,00 | 0 | |||||
| 2025-08-15 | 13F | Equitable Holdings, Inc. | 343 562 | −4,26 | 7 576 | −2,45 | ||||
| 2025-07-29 | 13F | Latitude Advisors, LLC | 10 760 | 237 | ||||||
| 2025-07-18 | 13F | Ledgewood Wealth Advisors, LLC | 17 332 | 0,57 | 382 | 2,69 | ||||
| 2025-08-13 | 13F | MONECO Advisors, LLC | 25 499 | −26,02 | 562 | −24,56 | ||||
| 2025-05-15 | 13F | Ancora Advisors, LLC | 0 | −100,00 | 0 | −100,00 | ||||
| 2025-08-14 | 13F | Guardian Wealth Advisors, Llc / Nc | 450 | 0,00 | 10 | 0,00 | ||||
| 2025-07-25 | 13F | Astoria Portfolio Advisors LLC. | 57 742 | 1,26 | 1 268 | 3,59 | ||||
| 2025-08-06 | 13F | Financial Advisory Corp /ut/ /adv | 199 085 | −1,14 | 4 | 0,00 | ||||
| 2025-07-29 | 13F | Private Trust Co Na | 941 | 159,23 | 21 | 185,71 |