Grunnleggende statistikk
| Institusjonelle eiere | 151 total, 147 long only, 0 short only, 4 long/short - change of −6,21% MRQ |
| Gjennomsnittlig porteføljeallokering | 0.5884 % - change of 21,79% MRQ |
| Institusjonelle aksjer (Long) | 33 678 508 (ex 13D/G) - change of −1,21MM shares −3,46% MRQ |
| Institusjonell verdi (Long) | $ 481 507 USD ($1000) |
Institusjonelt eierskap og aksjonærer
Bain Capital Specialty Finance, Inc. (US:BCSF) har 151 institusjonelle eiere og aksjonærer som har sendt inn 13D/G- eller 13F-skjemaer til Securities Exchange Commission (SEC). Disse institusjonene eier til sammen 33,678,508 aksjer. De største aksjonærene inkluderer Bain Capital Credit, LP, Bank Of America Corp /de/, UBS Group AG, Morgan Stanley, Cresset Asset Management, LLC, Van Eck Associates Corp, Melia Wealth LLC, BIZD - VanEck Vectors BDC Income ETF, Dimension Capital Management Llc, and Muzinich & Co., Inc. .
Bain Capital Specialty Finance, Inc. (NYSE:BCSF) institusjonell eierstruktur viser nåværende posisjoner i selskapet fordelt på institusjoner og fond, samt de siste endringene i posisjonsstørrelse. De største aksjonærene kan være individuelle investorer, verdipapirfond, hedgefond eller institusjoner. Schedule 13D indikerer at investoren eier (eller har eid) mer enn 5 % av selskapet og har til hensikt (eller hadde til hensikt) å aktivt forfølge en endring i forretningsstrategien. Schedule 13G indikerer en passiv investering på over 5 %.
The share price as of September 10, 2025 is 15,48 / share. Previously, on September 11, 2024, the share price was 16,62 / share. This represents a decline of 6,86% over that period.

Fondssentiment-score
Fondssentiment Score (også kjent som akkumulering av eierskap poengsum) viser hvilke aksjer som er mest kjøpt av fond. Den er resultatet av en sofistikert, kvantitativ flerfaktormodell som identifiserer selskaper med de høyeste nivåene av institusjonell akkumulering. Beregningsmodellen for poeng bruker en kombinasjon av den totale økningen i antall offentliggjorte eiere, endringer i porteføljeallokeringen til disse eierne og andre beregninger. Tallet går fra 0 til 100, der høyere tall indikerer en høyere grad av akkumulering i forhold til sammenlignbare selskaper, der 50 er gjennomsnittet.
Oppdateringsfrekvens: Daglig
Sjekk ut Ownership Explorer, som inneholder en liste over de høyest rangerte selskapene.
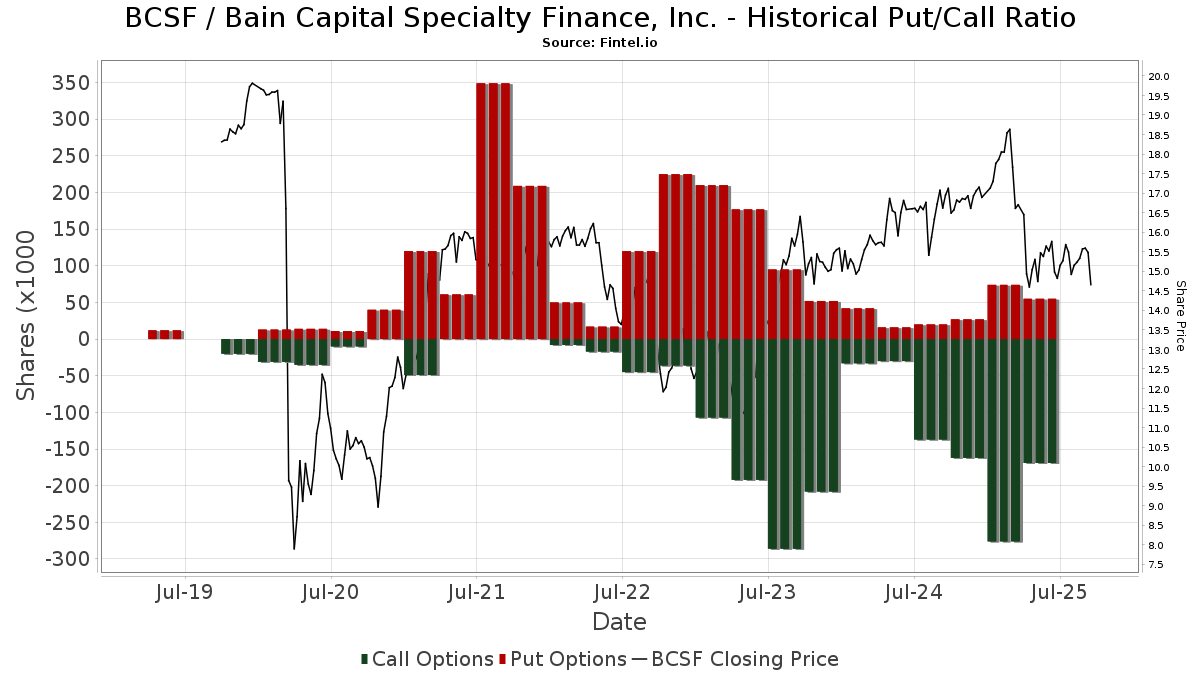
Institusjonell Put/Call-forhold
I tillegg til å rapportere standard aksje- og gjeldsemisjoner må institusjoner med mer enn 100 millioner kroner i forvaltningskapital også oppgi beholdningen av put- og callopsjoner. Siden put-opsjoner generelt indikerer et negativt sentiment, og call-opsjoner indikerer et positivt sentiment, kan vi få et inntrykk av det generelle institusjonelle sentimentet ved å plotte forholdet mellom put- og call-opsjoner. Diagrammet til høyre viser det historiske forholdet mellom put- og call-opsjoner for dette instrumentet.
Ved å bruke Put/Call-forholdet som en indikator på investorsentimentet kan man overvinne en av de viktigste svakhetene ved å bruke totalt institusjonelt eierskap, nemlig at en betydelig andel av forvaltningskapitalen investeres passivt for å følge indekser. Passivt forvaltede fond kjøper vanligvis ikke opsjoner, slik at indikatoren for put/call-forhold i større grad gjenspeiler stemningen i aktivt forvaltede fond.
13F- og NPORT-arkiveringer
Detaljer om 13F-arkiveringer er gratis. Detaljer om NP-arkiveringer krever et premium-medlemskap. Grønne rader indikerer nye posisjoner. Røde rader indikerer lukkede posisjoner. Klikk på lenke ikonet for å se hele transaksjonshistorikken.
Oppgrader
for å låse opp premiedata og eksportere til Excel. ![]() .
.
| Fildato | Kilde | Investor | Type | Gjennomsnittlig pris (estimert) |
Aksjer | Δ Aksjer (%) |
Rapportert verdi ($1000) | Verdi (%) | Portallokering (%) | |
|---|---|---|---|---|---|---|---|---|---|---|
| 2025-08-14 | 13F | Van Eck Associates Corp | 1 124 640 | 7,71 | 17 | −5,88 | ||||
| 2025-07-10 | 13F | Oliver Lagore Vanvalin Investment Group | 166 | 5,06 | 3 | 0,00 | ||||
| 2025-08-14 | 13F | Two Sigma Investments, Lp | 119 394 | −56,94 | 1 796 | −61,00 | ||||
| 2025-07-17 | 13F | Janney Montgomery Scott LLC | 84 060 | 8,87 | 1 | 0,00 | ||||
| 2025-08-14 | 13F | Boston Private Wealth Llc | 0 | −100,00 | 0 | −100,00 | ||||
| 2025-07-14 | 13F | AdvisorNet Financial, Inc | 500 | 0,00 | 8 | −12,50 | ||||
| 2025-07-16 | 13F | Eagle Global Advisors Llc | 19 910 | 0,00 | 299 | −9,39 | ||||
| 2025-07-31 | 13F | Cambridge Investment Research Advisors, Inc. | 54 527 | −0,04 | 1 | |||||
| 2025-08-12 | 13F | Trexquant Investment LP | 33 945 | −43,86 | 511 | −49,15 | ||||
| 2025-07-15 | 13F | Norden Group Llc | 24 259 | 9,20 | 365 | −1,09 | ||||
| 2025-08-12 | 13F | MAI Capital Management | 5 181 | 0,00 | 78 | −10,47 | ||||
| 2025-08-06 | 13F | First Horizon Advisors, Inc. | 0 | −100,00 | 0 | |||||
| 2025-07-29 | 13F | International Assets Investment Management, Llc | 31 839 | 0,00 | 479 | −9,47 | ||||
| 2025-08-14 | 13F | Qube Research & Technologies Ltd | 173 102 | 65,26 | 2 603 | 49,77 | ||||
| 2025-05-12 | 13F | Connor, Clark & Lunn Investment Management Ltd. | 0 | −100,00 | 0 | |||||
| 2025-08-14 | 13F | Tudor Investment Corp Et Al | 0 | −100,00 | 0 | |||||
| 2025-08-13 | 13F | Invesco Ltd. | 84 111 | 12,01 | 1 265 | 1,52 | ||||
| 2025-07-14 | 13F | Gries Financial Llc | 207 443 | −3,45 | 3 120 | −12,54 | ||||
| 2025-08-15 | 13F | Great West Life Assurance Co /can/ | 51 245 | 1,43 | 1 | |||||
| 2025-08-14 | 13F | Aquatic Capital Management LLC | 9 587 | −81,05 | 144 | −82,84 | ||||
| 2025-07-28 | 13F | Harbour Investments, Inc. | 0 | −100,00 | 0 | |||||
| 2025-07-18 | 13F | Rogco, Lp | 340 | 0,00 | 5 | 0,00 | ||||
| 2025-08-08 | 13F | Starr Indemnity & Liability Co | 0 | −100,00 | 0 | |||||
| 2025-08-14 | 13F | Citadel Advisors Llc | Call | 32 300 | −72,74 | 486 | −75,34 | |||
| 2025-08-14 | 13F | Citadel Advisors Llc | Put | 27 400 | −8,05 | 412 | −16,60 | |||
| 2025-07-24 | 13F | Us Bancorp \de\ | 0 | −100,00 | 0 | |||||
| 2025-09-10 | NP | Putnam ETF Trust - Putnam BDC ETF - | 453 844 | 10,18 | 6 808 | 8,01 | ||||
| 2025-08-14 | 13F | Citadel Advisors Llc | 46 225 | −76,68 | 695 | −78,88 | ||||
| 2025-08-04 | 13F | Muzinich & Co., Inc. | 553 802 | 52,97 | 8 329 | 38,61 | ||||
| 2025-08-14 | 13F | Mariner, LLC | 169 657 | 1,25 | 2 552 | −8,30 | ||||
| 2025-09-04 | 13F/A | Advisor Group Holdings, Inc. | 42 763 | −4,39 | 643 | −13,34 | ||||
| 2025-07-28 | 13F | Melia Wealth LLC | 990 732 | 6,31 | 14 901 | −3,68 | ||||
| 2025-08-19 | 13F | National Asset Management, Inc. | 20 067 | 302 | ||||||
| 2025-08-11 | 13F | HighTower Advisors, LLC | 71 167 | 0,21 | 1 070 | −9,17 | ||||
| 2025-07-15 | 13F | Graypoint LLC | 112 253 | 2,39 | 1 688 | −7,20 | ||||
| 2025-08-13 | 13F | PharVision Advisers, LLC | 13 839 | −26,89 | 208 | −33,76 | ||||
| 2025-08-06 | 13F | Texas Yale Capital Corp. | 146 832 | −8,66 | 2 208 | −17,24 | ||||
| 2025-08-08 | 13F | Creative Planning | 10 565 | 3,83 | 159 | −5,95 | ||||
| 2025-08-14 | 13F | Group One Trading, L.p. | Call | 17 700 | 55,26 | 266 | 40,74 | |||
| 2025-07-25 | 13F | Cwm, Llc | 383 | 19,69 | 0 | |||||
| 2025-08-14 | 13F | Group One Trading, L.p. | Put | 7 900 | −31,30 | 119 | −37,89 | |||
| 2025-08-14 | 13F | Verition Fund Management LLC | 0 | −100,00 | 0 | |||||
| 2025-08-13 | 13F | Lansforsakringar Fondforvaltning AB (publ) | 0 | −100,00 | 0 | |||||
| 2025-08-14 | 13F | Hrt Financial Lp | 97 681 | 114,58 | 1 | |||||
| 2025-08-12 | 13F | Jpmorgan Chase & Co | 172 508 | −34,24 | 2 595 | −40,42 | ||||
| 2025-08-13 | 13F | Mackenzie Financial Corp | 0 | −100,00 | 0 | |||||
| 2025-08-13 | 13F | Townsquare Capital Llc | 0 | −100,00 | 0 | |||||
| 2025-08-01 | 13F | Y-Intercept (Hong Kong) Ltd | 52 743 | 793 | ||||||
| 2025-08-14 | 13F | Jane Street Group, Llc | 18 645 | 280 | ||||||
| 2025-08-11 | 13F | United Advisor Group, LLC | 75 169 | −2,69 | 1 131 | −11,86 | ||||
| 2025-04-28 | 13F | Strategic Financial Concepts, LLC | 0 | −100,00 | 0 | −100,00 | ||||
| 2025-06-30 | NP | PSP - Invesco Global Listed Private Equity ETF This fund is a listed as child fund of Invesco Ltd. and if that institution has disclosed ownership in this security, then these positions will not be double counted when calculating total shares and total value | 34 659 | −21,60 | 530 | −34,00 | ||||
| 2025-07-22 | 13F | Mascoma Wealth Management LLC | 0 | −100,00 | 0 | |||||
| 2025-08-06 | 13F | Ethos Financial Group, LLC | 35 077 | 0,00 | 528 | −9,45 | ||||
| 2025-07-14 | 13F | GAMMA Investing LLC | 54 | 0,00 | 1 | |||||
| 2025-08-12 | 13F | Heritage Trust Co | 91 150 | 1 371 | ||||||
| 2025-07-31 | 13F | Sumitomo Mitsui Trust Holdings, Inc. | 446 968 | 27,98 | 6 722 | 15,96 | ||||
| 2025-08-14 | 13F | Wells Fargo & Company/mn | 135 826 | −61,88 | 2 043 | −65,47 | ||||
| 2025-08-12 | 13F | Virtu Financial LLC | 18 487 | 17,07 | 0 | |||||
| 2025-08-11 | 13F | Nomura Asset Management Co Ltd | 0 | −100,00 | 0 | |||||
| 2025-08-15 | 13F | Tower Research Capital LLC (TRC) | 81 | −92,20 | 1 | −94,12 | ||||
| 2025-08-12 | 13F | Advisors Asset Management, Inc. | 244 664 | −3,89 | 3 680 | −12,92 | ||||
| 2025-05-15 | 13F | Cura Wealth Advisors, Llc | 0 | −100,00 | 0 | |||||
| 2025-05-12 | 13F | Simplex Trading, Llc | 0 | −100,00 | 0 | |||||
| 2025-08-14 | 13F | PDT Partners, LLC | 13 556 | −76,45 | 204 | −78,74 | ||||
| 2025-08-14 | 13F | Quarry LP | 4 570 | −24,12 | 69 | −31,31 | ||||
| 2025-08-13 | 13F | Jones Financial Companies Lllp | 500 | 0,00 | 7 | −12,50 | ||||
| 2025-07-14 | 13F | U.S. Capital Wealth Advisors, LLC | 12 300 | 185 | ||||||
| 2025-04-24 | 13F | Mirae Asset Global Investments Co., Ltd. | 0 | −100,00 | 0 | |||||
| 2025-07-23 | 13F | Columbus Macro, LLC | 0 | −100,00 | 0 | |||||
| 2025-07-25 | NP | First Trust Specialty Finance & Financial Opportunities Fund This fund is a listed as child fund of First Trust Advisors Lp and if that institution has disclosed ownership in this security, then these positions will not be double counted when calculating total shares and total value | 100 000 | 0,00 | 1 572 | −17,57 | ||||
| 2025-08-15 | 13F | CI Private Wealth, LLC | 15 419 | −39,32 | 232 | −45,13 | ||||
| 2025-08-13 | 13F | Marshall Wace, Llp | 65 181 | 980 | ||||||
| 2025-08-15 | 13F | Kestra Advisory Services, LLC | 119 311 | 1,62 | 1 794 | −7,95 | ||||
| 2025-08-07 | 13F | Allworth Financial LP | 163 010 | −33,48 | 2 452 | −35,21 | ||||
| 2025-08-14 | 13F | Comerica Bank | 19 149 | 5,45 | 288 | −4,32 | ||||
| 2025-08-14 | 13F | Diversify Advisory Services, LLC | 23 143 | 5,44 | 351 | 3,24 | ||||
| 2025-05-15 | 13F | Talon Private Wealth, LLC | 0 | −100,00 | 0 | −100,00 | ||||
| 2025-07-25 | 13F | Concurrent Investment Advisors, LLC | 13 370 | −22,94 | 201 | −29,97 | ||||
| 2025-08-06 | 13F | Commonwealth Equity Services, Llc | 102 594 | 0,79 | 2 | 0,00 | ||||
| 2025-07-11 | 13F | Seacrest Wealth Management, Llc | 30 940 | 90,40 | 465 | 72,86 | ||||
| 2025-07-31 | 13F | MQS Management LLC | 19 171 | 81,29 | 288 | 64,57 | ||||
| 2025-08-15 | 13F | WFA of San Diego, LLC | 100 | 0,00 | 2 | 0,00 | ||||
| 2025-08-11 | 13F | Anfield Capital Management, LLC | 7 995 | 0,00 | 120 | −9,09 | ||||
| 2025-08-13 | 13F | ExodusPoint Capital Management, LP | 0 | −100,00 | 0 | |||||
| 2025-08-14 | 13F | Bain Capital Credit, LP | 11 822 433 | 0,00 | 177 809 | −9,40 | ||||
| 2025-08-14 | 13F | Federation des caisses Desjardins du Quebec | 75 | −86,96 | 1 | −88,89 | ||||
| 2025-08-14 | 13F | Ameriprise Financial Inc | 178 463 | 15,70 | 2 639 | 2,97 | ||||
| 2025-04-21 | 13F | Beacon Capital Management, LLC | 0 | −100,00 | 0 | |||||
| 2025-08-14 | 13F | BI Asset Management Fondsmaeglerselskab A/S | 43 977 | 2,99 | 1 | |||||
| 2025-08-14 | 13F | Lazard Asset Management Llc | 0 | −100,00 | 0 | |||||
| 2025-08-14 | 13F | Colony Group, LLC | 17 231 | 0,00 | 259 | −9,44 | ||||
| 2025-08-14 | 13F | Two Sigma Advisers, Lp | 413 700 | −15,88 | 6 222 | −23,78 | ||||
| 2025-05-14 | 13F | Northwestern Mutual Wealth Management Co | 0 | −100,00 | 0 | −100,00 | ||||
| 2025-08-13 | 13F | Lido Advisors, LLC | 55 524 | −4,97 | 835 | −13,83 | ||||
| 2025-08-08 | 13F | CFO4Life Group, LLC | 30 908 | 2,78 | 465 | −7,01 | ||||
| 2025-08-15 | 13F | Resources Management Corp /ct/ /adv | 0 | −100,00 | 0 | |||||
| 2025-08-25 | 13F/A | Neuberger Berman Group LLC | 128 823 | 10,83 | 1 937 | 0,41 | ||||
| 2025-08-14 | 13F/A | Rockefeller Capital Management L.P. | 366 542 | 12,96 | 5 513 | 2,34 | ||||
| 2025-08-18 | 13F | Wolverine Trading, Llc | Call | 17 700 | −1,12 | 264 | −11,71 | |||
| 2025-07-16 | 13F | Formidable Asset Management, LLC | 29 447 | 0,00 | 489 | 0,00 | ||||
| 2025-08-01 | 13F | Envestnet Asset Management Inc | 0 | −100,00 | 0 | |||||
| 2025-07-18 | 13F | First Pacific Financial | 0 | −100,00 | 0 | |||||
| 2025-08-07 | 13F | Hennion & Walsh Asset Management, Inc. | 433 062 | −4,82 | 6 513 | −13,77 | ||||
| 2025-08-12 | 13F | Steward Partners Investment Advisory, Llc | 3 604 | 52,52 | 54 | 38,46 | ||||
| 2025-08-13 | 13F | Centiva Capital, LP | 0 | −100,00 | 0 | |||||
| 2025-08-18 | 13F/A | National Bank Of Canada /fi/ | 134 | 2 | ||||||
| 2025-08-14 | 13F | Mml Investors Services, Llc | 26 417 | 14,13 | 0 | |||||
| 2025-08-04 | 13F | Canton Hathaway, LLC | 27 375 | 4,58 | 0 | |||||
| 2025-08-14 | 13F | Financial Network Wealth Advisors LLC | 556 | 0,00 | 8 | −11,11 | ||||
| 2025-08-14 | 13F | Dimension Capital Management Llc | 610 523 | 12,57 | 9 182 | 2,00 | ||||
| 2025-08-12 | 13F | SRS Capital Advisors, Inc. | 5 000 | 75 | ||||||
| 2025-05-08 | 13F | XTX Topco Ltd | 0 | −100,00 | 0 | |||||
| 2025-08-14 | 13F | Advisor OS, LLC | 21 026 | 2,78 | 316 | −6,78 | ||||
| 2025-08-05 | 13F | Seelaus Asset Management LLC | 13 300 | 0,00 | 200 | −9,09 | ||||
| 2025-04-21 | 13F | Nelson, Van Denburg & Campbell Wealth Management Group, LLC | 0 | −100,00 | 0 | |||||
| 2025-07-23 | 13F | Hager Investment Management Services, Llc | 164 142 | 6,81 | 2 469 | −3,22 | ||||
| 2025-08-08 | 13F | Cetera Investment Advisers | 0 | −100,00 | 0 | |||||
| 2025-06-27 | NP | LBO - WHITEWOLF Publicly Listed Private Equity ETF | 6 870 | 14,27 | 105 | −3,67 | ||||
| 2025-08-14 | 13F | Cubist Systematic Strategies, LLC | 16 405 | −86,55 | 247 | −87,85 | ||||
| 2025-08-13 | 13F | Mount Yale Investment Advisors, LLC | 63 673 | −0,67 | 958 | −10,06 | ||||
| 2025-08-19 | 13F | Advisory Services Network, LLC | 13 435 | 10,28 | 202 | −0,50 | ||||
| 2025-08-14 | 13F | Ares Management Llc | 68 595 | 0,00 | 1 032 | −9,40 | ||||
| 2025-08-07 | 13F | Campbell & CO Investment Adviser LLC | 65 559 | 22,60 | 986 | 11,16 | ||||
| 2025-07-15 | 13F | Foster Victor Wealth Advisors, LLC | 22 000 | 0,00 | 336 | 7,03 | ||||
| 2025-07-30 | 13F | Onyx Bridge Wealth Group LLC | 23 482 | −28,65 | 353 | −35,35 | ||||
| 2025-05-14 | 13F | Van Hulzen Asset Management, LLC | 0 | −100,00 | 0 | −100,00 | ||||
| 2025-08-14 | 13F | Bnp Paribas Arbitrage, Sa | 900 | 14 | ||||||
| 2025-08-21 | NP | BIZD - VanEck Vectors BDC Income ETF | 837 686 | 1,48 | 12 599 | −8,06 | ||||
| 2025-08-13 | 13F | Garner Asset Management Corp | 76 515 | 162,60 | 1 151 | 138,10 | ||||
| 2025-08-14 | 13F | KKM Financial LLC | 19 428 | 15,45 | 292 | 4,66 | ||||
| 2025-07-01 | 13F | Confluence Investment Management Llc | 120 930 | 0,40 | 1 819 | −9,05 | ||||
| 2025-08-12 | 13F | Dynamic Technology Lab Private Ltd | 32 526 | −3,05 | 489 | −12,21 | ||||
| 2025-08-11 | 13F | Mill Creek Capital Advisors, LLC | 12 092 | 0,00 | 182 | −9,50 | ||||
| 2025-08-15 | 13F | WealthCollab, LLC | 0 | −100,00 | 0 | |||||
| 2025-08-07 | 13F | Acadian Asset Management Llc | 1 587 | −11,14 | 0 | |||||
| 2025-05-13 | 13F | GKV Capital Management Co., Inc. | 0 | −100,00 | 0 | |||||
| 2025-08-05 | 13F | GPS Wealth Strategies Group, LLC | 2 682 | 38,82 | 40 | 25,00 | ||||
| 2025-08-08 | 13F | SG Americas Securities, LLC | 19 048 | 0 | ||||||
| 2025-08-13 | 13F | Cresset Asset Management, LLC | 1 201 483 | −8,53 | 18 070 | −17,12 | ||||
| 2025-08-14 | 13F | Raymond James Financial Inc | 94 791 | 8,78 | 1 426 | −1,45 | ||||
| 2025-08-11 | 13F | Citigroup Inc | 12 723 | 286,83 | 191 | 253,70 | ||||
| 2025-07-16 | 13F | Register Financial Advisors LLC | 8 404 | 1,20 | 126 | −8,03 | ||||
| 2025-08-12 | 13F | One Charles Private Wealth Services, LLC | 11 552 | 3,00 | 174 | −6,99 | ||||
| 2025-07-21 | 13F | Catalina Capital Group, LLC | 19 306 | 290 | ||||||
| 2025-08-12 | 13F | Bokf, Na | 9 750 | 0,00 | 147 | −9,32 | ||||
| 2025-07-24 | 13F | Ronald Blue Trust, Inc. | 9 422 | 3,00 | 142 | −6,62 | ||||
| 2025-08-13 | 13F | Jump Financial, LLC | 60 622 | 402,63 | 912 | 355,50 | ||||
| 2025-08-14 | 13F | Bank Of America Corp /de/ | 4 393 528 | −0,39 | 66 079 | −9,75 | ||||
| 2025-07-10 | 13F | Wealth Enhancement Advisory Services, Llc | 0 | −100,00 | 0 | |||||
| 2025-08-01 | 13F | First National Trust Co | 121 720 | 0,00 | 1 831 | −9,41 | ||||
| 2025-07-28 | 13F | Mutual Advisors, LLC | 14 890 | −5,53 | 228 | −6,97 | ||||
| 2025-05-14 | 13F | Virtus ETF Advisers LLC | 0 | −100,00 | 0 | |||||
| 2025-08-14 | 13F | State Street Corp | 61 814 | 257,76 | 930 | 224,83 | ||||
| 2025-07-29 | 13F | Harbor Asset Planning, Inc. | 622 | 9 | ||||||
| 2025-05-15 | 13F | Keel Point, LLC | 0 | −100,00 | 0 | |||||
| 2025-08-14 | 13F | Susquehanna International Group, Llp | 11 854 | 178 | ||||||
| 2025-08-14 | 13F | Susquehanna International Group, Llp | Put | 17 600 | −33,33 | 265 | −39,73 | |||
| 2025-08-14 | 13F | UBS Group AG | 1 449 926 | 17,75 | 21 807 | 6,68 | ||||
| 2025-08-12 | 13F | Proequities, Inc. | Put | 0 | 0 | |||||
| 2025-08-14 | 13F | Susquehanna International Group, Llp | Call | 84 200 | −8,68 | 1 266 | −17,25 | |||
| 2025-07-16 | 13F | Beaumont Financial Advisors, LLC | 62 291 | 0,30 | 937 | −9,13 | ||||
| 2025-08-12 | 13F | Proequities, Inc. | Call | 0 | 0 | |||||
| 2025-08-12 | 13F | Proequities, Inc. | 0 | 0 | ||||||
| 2025-07-31 | 13F | Caitong International Asset Management Co., Ltd | 180 | 3 | ||||||
| 2025-08-12 | 13F | BlackRock, Inc. | 302 162 | 28,23 | 4 545 | 16,19 | ||||
| 2025-08-12 | 13F | Pathstone Holdings, LLC | 179 111 | 0,00 | 2 694 | −9,42 | ||||
| 2025-08-12 | 13F | LPL Financial LLC | 27 642 | 1,87 | 416 | −7,78 | ||||
| 2025-08-01 | 13F | Transcend Wealth Collective, Llc | 23 280 | 350 | ||||||
| 2025-05-14 | 13F | CIBC Private Wealth Group, LLC | 0 | −100,00 | 0 | |||||
| 2025-08-14 | 13F | Millennium Management Llc | 140 608 | −29,89 | 2 115 | −36,50 | ||||
| 2025-08-13 | 13F | Northern Trust Corp | 129 721 | 666,26 | 1 951 | 594,31 | ||||
| 2025-08-13 | 13F | Quantbot Technologies LP | 8 061 | 121 | ||||||
| 2025-06-25 | NP | VPC - Virtus Private Credit Strategy ETF | 44 467 | −12,69 | 680 | −26,49 | ||||
| 2025-08-13 | 13F | Virtus Investment Advisers, Inc. | 51 043 | 4,86 | 768 | −5,07 | ||||
| 2025-05-13 | 13F | Global Endowment Management, LP | 0 | −100,00 | 0 | |||||
| 2025-07-30 | 13F | Denali Advisors Llc | 35 359 | −2,55 | 532 | −11,79 | ||||
| 2025-08-14 | 13F | Wiley Bros.-aintree Capital, Llc | 35 379 | 8,95 | 532 | −1,85 | ||||
| 2025-08-05 | 13F | Simplex Trading, Llc | Put | 2 100 | −70,00 | 0 | ||||
| 2025-05-28 | NP | LUSIX - Lazard US Systematic Small Cap Equity Portfolio Institutional Shares | 5 616 | −12,00 | 93 | −16,22 | ||||
| 2025-08-12 | 13F | Legal & General Group Plc | 424 915 | −1,33 | 6 382 | −10,75 | ||||
| 2025-07-24 | 13F | Blair William & Co/il | 10 339 | 0,00 | 155 | −9,36 | ||||
| 2025-08-12 | 13F | Kimelman & Baird, LLC | 800 | 0,00 | 12 | −7,69 | ||||
| 2025-08-12 | 13F | Franklin Resources Inc | 448 139 | 23,84 | 6 740 | 12,22 | ||||
| 2025-07-29 | NP | SVYAX - SIIT U.S. Managed Volatility Fund - Class A | 13 021 | 205 | ||||||
| 2025-07-11 | 13F | Farther Finance Advisors, LLC | 14 560 | 13,26 | 219 | 1,87 | ||||
| 2025-07-16 | 13F | Prairiewood Capital, LLC | 14 267 | −3,67 | 215 | −12,65 | ||||
| 2025-08-05 | 13F | Simplex Trading, Llc | Call | 17 900 | −50,69 | 0 | ||||
| 2025-08-11 | 13F | Perennial Investment Advisors, LLC | 12 500 | 0,00 | 188 | −9,18 | ||||
| 2025-07-22 | 13F | Dougherty Wealth Advisers LLC | 50 | 0,00 | 1 | |||||
| 2025-05-05 | 13F | Transce3nd, LLC | 0 | −100,00 | 0 | |||||
| 2025-08-14 | 13F | Royal Bank Of Canada | 141 045 | 0,17 | 2 121 | −9,24 | ||||
| 2025-07-09 | 13F | Triumph Capital Management | 54 126 | 3,37 | 814 | −6,33 | ||||
| 2025-07-10 | 13F | Redhawk Wealth Advisors, Inc. | 91 521 | −3,41 | 1 376 | −12,47 | ||||
| 2025-08-15 | 13F | Morgan Stanley | 1 326 221 | 4,33 | 19 946 | −5,48 | ||||
| 2025-07-16 | 13F | Meridian Investment Counsel Inc. | 18 101 | −5,24 | 272 | −14,20 | ||||
| 2025-08-12 | 13F | Global Retirement Partners, LLC | 2 500 | 0,00 | 38 | −13,95 | ||||
| 2025-08-13 | 13F | Barclays Plc | 0 | −100,00 | 0 | |||||
| 2025-08-13 | 13F | Employees Retirement System of Texas | 14 064 | 0,00 | 0 | |||||
| 2025-07-18 | 13F | Cooper Financial Group | 13 597 | 14,44 | 205 | 3,55 | ||||
| 2025-08-12 | 13F | Magnetar Financial LLC | 0 | −100,00 | 0 | |||||
| 2025-08-14 | 13F | Balyasny Asset Management Llc | 0 | −100,00 | 0 |