Grunnleggende statistikk
| Institusjonelle eiere | 109 total, 98 long only, 1 short only, 10 long/short - change of 1,72% MRQ |
| Gjennomsnittlig porteføljeallokering | 0.4589 % - change of −46,01% MRQ |
| Institusjonelle aksjer (Long) | 2 092 571 (ex 13D/G) - change of 0,15MM shares 9,98% MRQ |
| Institusjonell verdi (Long) | $ 221 248 USD ($1000) |
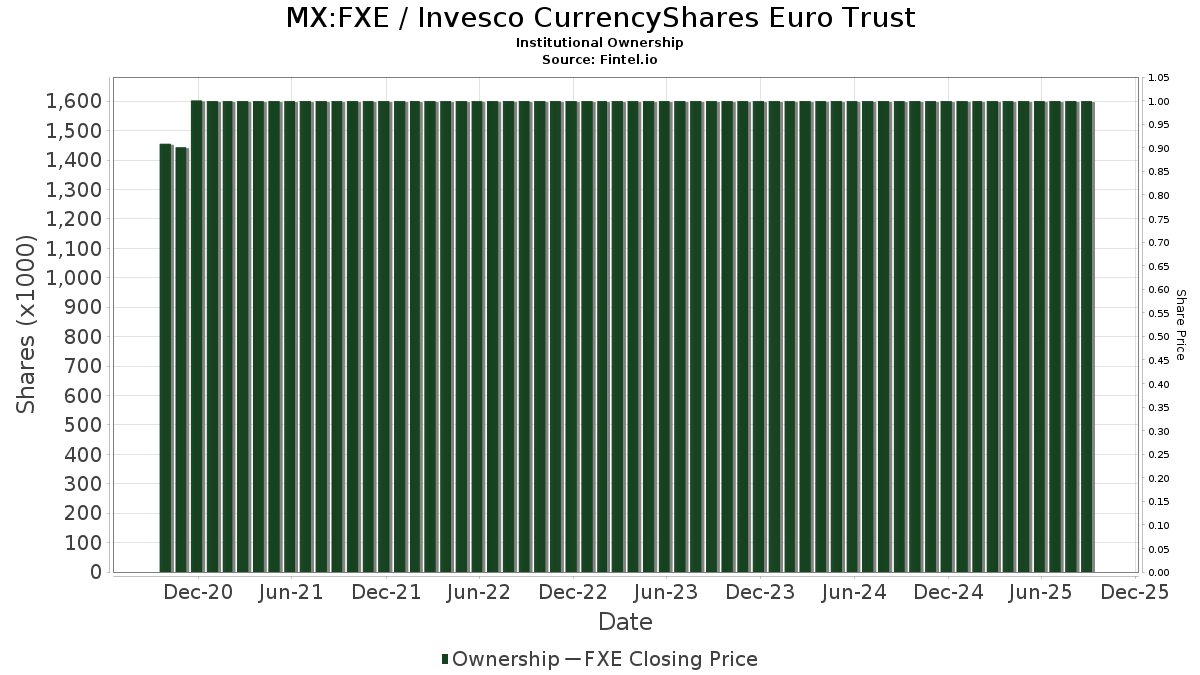
Institusjonelt eierskap og aksjonærer
Invesco CurrencyShares Euro Trust (MX:FXE) har 109 institusjonelle eiere og aksjonærer som har sendt inn 13D/G- eller 13F-skjemaer til Securities Exchange Commission (SEC). Disse institusjonene eier til sammen 2,092,571 aksjer. De største aksjonærene inkluderer Morgan Stanley, Citadel Advisors Llc, Susquehanna International Group, Llp, Bnp Paribas Arbitrage, Sa, Raymond James Financial Inc, Citadel Advisors Llc, Citadel Advisors Llc, Goldman Sachs Group Inc, Wells Fargo & Company/mn, and Oppenheimer & Co Inc .
Invesco CurrencyShares Euro Trust (BMV:FXE) institusjonell eierstruktur viser nåværende posisjoner i selskapet fordelt på institusjoner og fond, samt de siste endringene i posisjonsstørrelse. De største aksjonærene kan være individuelle investorer, verdipapirfond, hedgefond eller institusjoner. Schedule 13D indikerer at investoren eier (eller har eid) mer enn 5 % av selskapet og har til hensikt (eller hadde til hensikt) å aktivt forfølge en endring i forretningsstrategien. Schedule 13G indikerer en passiv investering på over 5 %.
Fondssentiment-score
Fondssentiment Score (også kjent som akkumulering av eierskap poengsum) viser hvilke aksjer som er mest kjøpt av fond. Den er resultatet av en sofistikert, kvantitativ flerfaktormodell som identifiserer selskaper med de høyeste nivåene av institusjonell akkumulering. Beregningsmodellen for poeng bruker en kombinasjon av den totale økningen i antall offentliggjorte eiere, endringer i porteføljeallokeringen til disse eierne og andre beregninger. Tallet går fra 0 til 100, der høyere tall indikerer en høyere grad av akkumulering i forhold til sammenlignbare selskaper, der 50 er gjennomsnittet.
Oppdateringsfrekvens: Daglig
Sjekk ut Ownership Explorer, som inneholder en liste over de høyest rangerte selskapene.
13F- og NPORT-arkiveringer
Detaljer om 13F-arkiveringer er gratis. Detaljer om NP-arkiveringer krever et premium-medlemskap. Grønne rader indikerer nye posisjoner. Røde rader indikerer lukkede posisjoner. Klikk på lenke ikonet for å se hele transaksjonshistorikken.
Oppgrader
for å låse opp premiedata og eksportere til Excel. ![]() .
.
| Fildato | Kilde | Investor | Type | Gjennomsnittlig pris (estimert) |
Aksjer | Δ Aksjer (%) |
Rapportert verdi ($1000) | Verdi (%) | Portallokering (%) | |
|---|---|---|---|---|---|---|---|---|---|---|
| 2025-08-14 | 13F | BTG Pactual Asset Management US LLC | 0 | −100,00 | 0 | −100,00 | ||||
| 2025-07-30 | NP | QVOY - Q3 All-Season Active Rotation ETF | 20 697 | −14,92 | 2 170 | −9,62 | ||||
| 2025-07-07 | 13F | Roxbury Financial LLC | 143 | 16 | ||||||
| 2025-08-08 | 13F | Tortoise Investment Management, LLC | 925 | 101 | ||||||
| 2025-08-12 | 13F | Virtu Financial LLC | 0 | −100,00 | 0 | |||||
| 2025-09-04 | 13F/A | Advisor Group Holdings, Inc. | 586 | 16,04 | 64 | 26,00 | ||||
| 2025-08-12 | 13F | Jpmorgan Chase & Co | 2 409 | 262 | ||||||
| 2025-08-08 | 13F | Ironwood Investment Counsel, LLC | 3 330 | 362 | ||||||
| 2025-08-14 | 13F | Mml Investors Services, Llc | 5 270 | 1 | ||||||
| 2025-08-14 | 13F | Susquehanna International Group, Llp | 0 | −100,00 | 0 | |||||
| 2025-08-06 | 13F | Prospera Financial Services Inc | 2 525 | 0,00 | 275 | 8,73 | ||||
| 2025-08-14 | 13F | Federation des caisses Desjardins du Quebec | 1 223 | 70,81 | 133 | 87,32 | ||||
| 2025-08-26 | NP | LCR - Leuthold Core ETF | 8 820 | −7,14 | 960 | 1,16 | ||||
| 2025-08-14 | 13F | UBS Group AG | 24 932 | 170,15 | 2 712 | 194,46 | ||||
| 2025-09-09 | 13F | NWF Advisory Services Inc. | 17 193 | 1 870 | ||||||
| 2025-08-08 | 13F | Bailard, Inc. | 1 916 | 208 | ||||||
| 2025-08-27 | 13F/A | Squarepoint Ops LLC | Call | 5 900 | 0,00 | 642 | 8,83 | |||
| 2025-08-14 | 13F | Warren Averett Asset Management, LLC | 18 166 | 1 976 | ||||||
| 2025-08-07 | 13F | Verus Capital Partners, Llc | 6 607 | 719 | ||||||
| 2025-08-14 | 13F | Royal Bank Of Canada | 3 995 | −63,21 | 435 | −59,91 | ||||
| 2025-04-18 | 13F | Insigneo Advisory Services, Llc | 0 | −100,00 | 0 | |||||
| 2025-08-14 | 13F | Fmr Llc | 46 | 0,00 | 5 | 25,00 | ||||
| 2025-08-08 | 13F | Gts Securities Llc | 20 478 | 163,45 | 2 228 | 186,98 | ||||
| 2025-08-13 | 13F | Renaissance Technologies Llc | 47 800 | 5 200 | ||||||
| 2025-07-08 | 13F | Baker Ellis Asset Management LLC | 3 000 | 326 | ||||||
| 2025-08-13 | 13F | GeoWealth Management, LLC | 200 | 22 | ||||||
| 2025-08-15 | 13F | CI Private Wealth, LLC | 17 361 | 1 889 | ||||||
| 2025-05-05 | 13F | Ping Capital Management, Inc. | 0 | −100,00 | 0 | |||||
| 2025-07-11 | 13F | Farther Finance Advisors, LLC | 276 | 30 | ||||||
| 2025-08-04 | 13F | Flagship Harbor Advisors, Llc | 6 490 | 706 | ||||||
| 2025-08-13 | 13F | Mount Yale Investment Advisors, LLC | 42 | 5 | ||||||
| 2025-07-17 | 13F | Catalytic Wealth RIA, LLC | 5 994 | 652 | ||||||
| 2025-07-25 | 13F | Lodestar Private Asset Management Llc | 2 362 | 257 | ||||||
| 2025-08-14 | 13F | Ameriprise Financial Inc | 2 488 | 271 | ||||||
| 2025-08-12 | 13F | Clear Street Markets Llc | Put | 25 000 | 150,00 | 2 720 | 172,17 | |||
| 2025-08-15 | 13F | Morgan Stanley | 808 204 | 390,66 | 87 925 | 434,33 | ||||
| 2025-07-10 | 13F | Wealth Enhancement Advisory Services, Llc | 3 214 | 349 | ||||||
| 2025-08-14 | 13F | Stifel Financial Corp | 3 082 | 0,00 | 335 | 9,12 | ||||
| 2025-08-05 | 13F | Bank Of Montreal /can/ | 5 194 | 565 | ||||||
| 2025-07-30 | 13F | Klingenstein Fields & Co Lp | 8 113 | 883 | ||||||
| 2025-08-06 | 13F | Nvwm, Llc | 1 201 | 131 | ||||||
| 2025-05-20 | 13F | Belpointe Asset Management LLC | 0 | −100,00 | 0 | −100,00 | ||||
| 2025-08-12 | 13F | LPL Financial LLC | 32 721 | 253,55 | 3 560 | 285,17 | ||||
| 2025-07-16 | 13F | Augustine Asset Management Inc | 10 881 | 173,87 | 1 184 | 198,74 | ||||
| 2025-08-05 | 13F | Key FInancial Inc | 1 060 | 0,00 | 115 | 9,52 | ||||
| 2025-08-13 | 13F | EverSource Wealth Advisors, LLC | 1 004 | 0,30 | 109 | 9,00 | ||||
| 2025-07-31 | 13F | Oppenheimer & Co Inc | 50 261 | 5 468 | ||||||
| 2025-07-23 | 13F | Nbt Bank N A /ny | 200 | 22 | ||||||
| 2025-08-08 | 13F | Creative Planning | 3 841 | 418 | ||||||
| 2025-04-14 | 13F | Upper Left Wealth Management, LLC | 0 | −100,00 | 0 | |||||
| 2025-05-14 | 13F | Walleye Trading LLC | Call | 0 | −100,00 | 0 | ||||
| 2025-07-03 | 13F | Garde Capital, Inc. | 1 135 | 0,00 | 123 | 8,85 | ||||
| 2025-08-14 | 13F | Raymond James Financial Inc | 93 269 | 37,34 | 10 147 | 49,56 | ||||
| 2025-08-26 | 13F | Nautilus Advisors LLC | 10 587 | 11,95 | 1 152 | 21,93 | ||||
| 2025-05-05 | 13F | Berkeley Capital Partners, LLC | 0 | −100,00 | 0 | |||||
| 2025-08-14 | 13F | Goldman Sachs Group Inc | 75 009 | 0,00 | 8 160 | 8,90 | ||||
| 2025-07-22 | 13F | Yoder Wealth Management, Inc. | 4 200 | 457 | ||||||
| 2025-07-30 | 13F | Exencial Wealth Advisors, Llc | 5 356 | 0,00 | 583 | 8,79 | ||||
| 2025-08-14 | 13F | Transamerica Financial Advisors, Inc. | 4 | 0,00 | 0 | |||||
| 2025-08-06 | 13F | Legacy Bridge, LLC | 450 | 49 | ||||||
| 2025-08-08 | 13F | Hartland & Co., LLC | 114 | 0,00 | 12 | 9,09 | ||||
| 2025-08-12 | 13F | Choate Investment Advisors | 5 523 | 601 | ||||||
| 2025-08-12 | 13F | Waterloo Capital, L.P. | 2 296 | 250 | ||||||
| 2025-08-14 | 13F | Group One Trading, L.p. | Put | 300 | −57,14 | 33 | −53,62 | |||
| 2025-08-14 | 13F | Bnp Paribas Arbitrage, Sa | 100 000 | 10 879 | ||||||
| 2025-08-14 | 13F | Group One Trading, L.p. | 1 656 | 180 | ||||||
| 2025-07-28 | 13F | Mutual Advisors, LLC | 6 445 | 20,22 | 699 | 24,20 | ||||
| 2025-08-13 | 13F | Rsm Us Wealth Management Llc | 2 266 | 247 | ||||||
| 2025-07-28 | 13F | Copia Wealth Management | 0 | −100,00 | 0 | |||||
| 2025-05-14 | 13F | Flow Traders U.s. Llc | 0 | −100,00 | 0 | |||||
| 2025-08-14 | 13F | BTG Pactual Asset Management US LLC | Put | 29 900 | 730,56 | 3 253 | 805,85 | |||
| 2025-08-14 | 13F | BTG Pactual Asset Management US LLC | Call | 29 900 | 730,56 | 3 253 | 805,85 | |||
| 2025-08-04 | 13F | Haven Private, LLC | 7 758 | 844 | ||||||
| 2025-07-08 | 13F | Parallel Advisors, LLC | 1 040 | 113 | ||||||
| 2025-07-09 | 13F | Dynamic Advisor Solutions LLC | 0 | −100,00 | 0 | |||||
| 2025-07-22 | 13F | IMC-Chicago, LLC | 12 369 | 1 346 | ||||||
| 2025-07-22 | 13F | IMC-Chicago, LLC | Put | 30 200 | 120,44 | 3 285 | 140,13 | |||
| 2025-04-14 | 13F | Greenspring Advisors, LLC | 4 468 | 446 | ||||||
| 2025-07-22 | 13F | IMC-Chicago, LLC | Call | 26 000 | 48,57 | 2 829 | 61,78 | |||
| 2025-08-14 | 13F | Susquehanna International Group, Llp | Call | 131 400 | 591,58 | 14 295 | 653,16 | |||
| 2025-07-03 | 13F | Fiduciary Financial Group, Llc | 3 408 | −2,07 | 371 | 2,78 | ||||
| 2025-07-16 | 13F | Perigon Wealth Management, LLC | 28 668 | 53,61 | 953 | −48,93 | ||||
| 2025-08-11 | 13F | Citigroup Inc | 5 000 | 544 | ||||||
| 2025-07-23 | 13F | Joel Isaacson & Co., LLC | 2 978 | 0,00 | 324 | 8,75 | ||||
| 2025-07-31 | 13F | Cambridge Investment Research Advisors, Inc. | 5 322 | 1 | ||||||
| 2025-08-13 | 13F | Leuthold Group, Llc | 44 735 | 6,75 | 4 867 | 16,24 | ||||
| 2025-08-07 | 13F | Efficient Advisors, LLC | 3 998 | 435 | ||||||
| 2025-07-18 | 13F | Pure Financial Advisors, Inc. | 4 259 | 463 | ||||||
| 2025-08-01 | 13F | Ashton Thomas Private Wealth, LLC | 15 398 | −6,10 | 1 675 | 2,26 | ||||
| 2025-08-14 | 13F | Millennium Management Llc | Put | 3 900 | −58,51 | 424 | −54,85 | |||
| 2025-08-14 | 13F | Millennium Management Llc | Call | 3 900 | −58,51 | 424 | −54,85 | |||
| 2025-08-05 | 13F | Dunhill Financial, LLC | 439 | 48 | ||||||
| 2025-05-21 | 13F/A | Geneos Wealth Management Inc. | 250 | 25 | ||||||
| 2025-08-01 | 13F | Envestnet Asset Management Inc | 6 817 | −4,05 | 742 | 4,51 | ||||
| 2025-08-06 | 13F | Pekin Hardy Strauss, Inc. | 4 500 | 490 | ||||||
| 2025-08-13 | 13F | Hsbc Holdings Plc | 10 709 | 0,00 | 1 165 | 8,98 | ||||
| 2025-08-18 | 13F | Wolverine Trading, Llc | Put | 12 200 | 8,93 | 1 319 | 17,78 | |||
| 2025-08-26 | NP | ASYLX - AB Select US Long/Short Portfolio Advisor Class | 0 | −100,00 | 0 | −100,00 | ||||
| 2025-08-18 | 13F | Wolverine Trading, Llc | 8 564 | 21,13 | 926 | 31,02 | ||||
| 2025-08-14 | 13F | Parallax Volatility Advisers, L.P. | 5 180 | 0,00 | 564 | 8,90 | ||||
| 2025-08-18 | 13F | Wolverine Trading, Llc | Call | 28 100 | 116,15 | 3 038 | 133,80 | |||
| 2025-08-14 | 13F | Comerica Bank | 1 602 | −13,41 | 174 | −5,43 | ||||
| 2025-08-12 | 13F | Coldstream Capital Management Inc | 0 | −100,00 | 0 | |||||
| 2025-08-19 | 13F | Advisory Services Network, LLC | 45 543 | 4 796 | ||||||
| 2025-08-15 | 13F | Captrust Financial Advisors | 21 281 | 30,40 | 2 315 | 42,02 | ||||
| 2025-08-11 | 13F | TD Waterhouse Canada Inc. | 1 720 | 187 | ||||||
| 2025-08-28 | NP | HSTRX - Hussman Strategic Total Return Fund | 7 500 | 0,00 | 816 | 8,81 | ||||
| 2025-08-13 | 13F | Basso Capital Management, L.p. | 7 880 | 857 | ||||||
| 2025-08-14 | 13F | Investment House Llc | 7 133 | 776 | ||||||
| 2025-08-14 | 13F | Two Sigma Securities, Llc | 1 917 | 209 | ||||||
| 2025-08-14 | 13F | CIBC World Markets Inc. | 26 955 | 2 932 | ||||||
| 2025-07-15 | 13F | North Star Investment Management Corp. | 1 383 | 20,47 | 150 | 31,58 | ||||
| 2025-08-05 | 13F | Hussman Strategic Advisors, Inc. | 7 500 | 0,00 | 816 | 8,81 | ||||
| 2025-08-05 | 13F | Sage Capital Management, LLC | 1 939 | 211 | ||||||
| 2025-08-05 | 13F | Simplex Trading, Llc | Put | 10 800 | −61,01 | 1 | −50,00 | |||
| 2025-08-05 | 13F | Simplex Trading, Llc | 4 964 | −52,40 | 1 | −100,00 | ||||
| 2025-08-05 | 13F | Simplex Trading, Llc | Call | 29 600 | 171,56 | 3 | 200,00 | |||
| 2025-08-13 | 13F | Marshall Wace, Llp | Put | 7 100 | 787,50 | 772 | 877,22 | |||
| 2025-08-13 | 13F | Marshall Wace, Llp | Call | 2 400 | −67,57 | 261 | −64,68 | |||
| 2025-08-06 | 13F | Commonwealth Equity Services, Llc | 20 258 | 15,22 | 2 | 100,00 | ||||
| 2025-08-14 | 13F | Bank Of America Corp /de/ | 18 727 | 115,65 | 2 037 | 134,95 | ||||
| 2025-07-25 | 13F | Almanack Investment Partners, LLC. | 4 725 | 514 | ||||||
| 2025-08-13 | 13F | Marshall Wace, Llp | 5 700 | 620 | ||||||
| 2025-08-12 | 13F | Proequities, Inc. | Put | 0 | 0 | |||||
| 2025-08-12 | 13F | Proequities, Inc. | Call | 0 | 0 | |||||
| 2025-08-12 | 13F | Proequities, Inc. | 0 | 0 | ||||||
| 2025-08-14 | 13F | Colony Group, LLC | 25 483 | 134,84 | 2 772 | 155,72 | ||||
| 2025-08-14 | 13F | Wells Fargo & Company/mn | 56 623 | 302,27 | 6 160 | 338,05 | ||||
| 2025-08-12 | 13F | Clearwater Capital Advisors, LLC | 0 | −100,00 | 0 | |||||
| 2025-08-11 | 13F | HighTower Advisors, LLC | 7 217 | 785 | ||||||
| 2025-08-15 | 13F | Tower Research Capital LLC (TRC) | 8 | 1 | ||||||
| 2025-08-08 | 13F | Cetera Investment Advisers | 7 664 | 834 | ||||||
| 2025-08-01 | 13F | Brookwood Investment Group LLC | 7 183 | 781 | ||||||
| 2025-08-14 | 13F | Citadel Advisors Llc | Put | 291 100 | 1 602,34 | 31 669 | 1 754,10 | |||
| 2025-07-16 | 13F | Kathmere Capital Management, LLC | 11 109 | 0,00 | 1 209 | 8,93 | ||||
| 2025-08-14 | 13F | Susquehanna International Group, Llp | Put | 30 500 | −11,34 | 3 318 | −3,43 | |||
| 2025-07-21 | 13F | J. Safra Sarasin Holding AG | 35 514 | −8,95 | 3 864 | −0,85 | ||||
| 2025-08-14 | 13F | Citadel Advisors Llc | Call | 81 300 | −2,98 | 8 845 | 5,65 | |||
| 2025-08-14 | 13F | Citadel Advisors Llc | 82 755 | 869,82 | 9 003 | 956,57 | ||||
| 2025-08-14 | 13F | Jane Street Group, Llc | Call | 17 300 | −24,78 | 1 882 | −18,07 | |||
| 2025-08-14 | 13F | Jane Street Group, Llc | 30 658 | −48,58 | 3 335 | −44,01 | ||||
| 2025-08-14 | 13F | Jane Street Group, Llc | Put | 19 100 | 2 078 | |||||
| 2025-08-19 | 13F | National Asset Management, Inc. | 3 210 | 349 | ||||||
| 2025-04-21 | 13F | GFS Advisors, LLC | 0 | −100,00 | 0 | −100,00 |