Grunnleggende statistikk
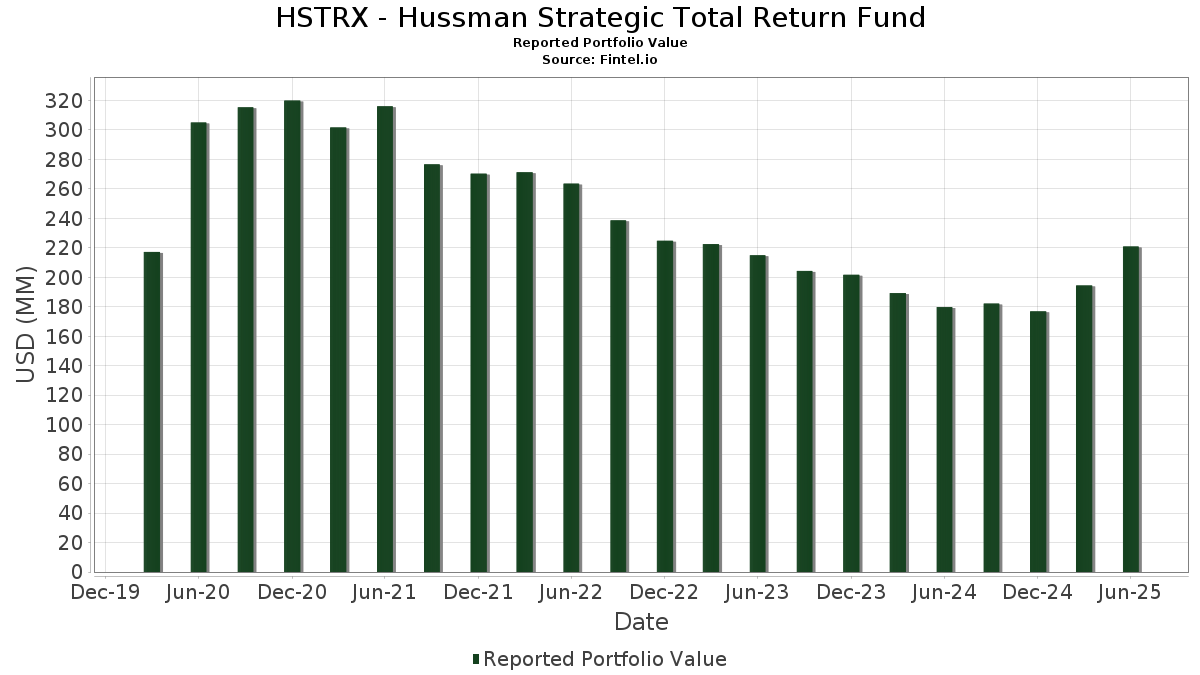
| Porteføljeverdi | $ 220 927 850 |
| Nåværende posisjoner | 50 |
Siste beholdninger, prestasjoner, forvaltet kapital (fra 13F, 13D)
HSTRX - Hussman Strategic Total Return Fund har oppgitt 50 totale beholdninger i sine siste SEC-arkiveringer. Siste porteføljeverdi er beregnet til 220 927 850 USD. Faktisk forvaltet kapital (AUM) er denne verdien pluss kontanter (som ikke er oppgitt). HSTRX - Hussman Strategic Total Return Funds største beholdninger er United States Treasury Inflation Indexed Bonds (US:US912810PZ57) , Invesco Treasury Portfolio, Institutional Class (US:US8252524066) , United States Treasury Inflation Indexed Bonds (US:US912828Z377) , Agnico Eagle Mines Limited (US:AEM) , and Newmont Corporation (US:NEM) . HSTRX - Hussman Strategic Total Return Funds nye posisjoner inkluderer United States Treasury Inflation Indexed Bonds (US:US912810PZ57) , United States Treasury Inflation Indexed Bonds (US:US912828Z377) , United States Treasury Note/Bond (US:US9128286X38) , United States Treasury Note/Bond (US:US9128282A70) , and .
De største økningene dette kvartalet
Vi bruker endringen i porteføljeallokeringen fordi dette er det mest meningsfulle målet. Endringer kan skyldes handler eller endringer i aksjekursene.
| Verdipapirer | Aksjer (MM) |
Verdi (MM$) |
Portefølje % | ΔPortefølje % |
|---|---|---|---|---|
| 77,43 | 34,9904 | 16,1965 | ||
| 24,89 | 11,2504 | 11,2504 | ||
| 0,09 | 10,70 | 4,8372 | 2,1254 | |
| 0,07 | 1,99 | 0,9002 | 0,8166 | |
| 0,02 | 3,73 | 1,6878 | 0,7931 | |
| 0,34 | 1,23 | 0,5547 | 0,2576 | |
| 0,18 | 10,49 | 4,7392 | 0,2104 | |
| 0,18 | 1,08 | 0,4873 | 0,0526 | |
| 0,00 | 0,16 | 0,0726 | 0,0228 | |
| 0,01 | 0,01 | 0,0024 | 0,0024 |
De største reduksjonene dette kvartalet
Vi bruker endringen i porteføljeallokeringen fordi dette er det mest meningsfulle målet. Endringer kan skyldes handler eller endringer i aksjekurser.
| Verdipapirer | Aksjer (MM) |
Verdi (MM$) |
Portefølje % | ΔPortefølje % |
|---|---|---|---|---|
| 14,48 | 14,48 | 6,5440 | −1,5478 | |
| 0,03 | 1,37 | 0,6178 | −1,1232 | |
| 15,55 | 7,0266 | −1,0276 | ||
| 11,77 | 5,3190 | −0,7354 | ||
| 9,83 | 4,4418 | −0,6577 | ||
| 9,73 | 4,3986 | −0,6409 | ||
| 4,81 | 2,1744 | −0,4061 | ||
| 5,19 | 2,3433 | −0,3441 | ||
| 0,12 | 1,88 | 0,8476 | −0,3352 | |
| 0,04 | 1,28 | 0,5776 | −0,2974 |
13F- og Fondsarkiveringer
Dette skjemaet ble sendt inn den 2025-08-28 for rapporteringsperioden 2025-06-30. Klikk på lenkeikonet for å se hele transaksjonshistorikken.
Oppgradere for å låse opp premiedata og eksportere til Excel![]() .
.
| Verdipapirer | Type | Gjennomsnittlig aksjekurs | Aksjer (MM) |
ΔAksjer (%) |
ΔAksjer (%) |
Verdi ($MM) |
Portefølje (%) |
ΔPortefølje (%) |
|
|---|---|---|---|---|---|---|---|---|---|
| U.S. Treasury Notes 4.625%, Due 02/15/2035 / DBT (US91282CMM00) | 77,43 | 114,69 | 34,9904 | 16,1965 | |||||
| U.S. Treasury Note 4.750%, Due 02/15/2045 / DBT (US912810UJ50) | 24,89 | 11,2504 | 11,2504 | ||||||
| US912810PZ57 / United States Treasury Inflation Indexed Bonds | 15,55 | 0,60 | 7,0266 | −1,0276 | |||||
| US8252524066 / Invesco Treasury Portfolio, Institutional Class | 14,48 | −6,74 | 14,48 | −6,74 | 6,5440 | −1,5478 | |||
| US912828Z377 / United States Treasury Inflation Indexed Bonds | 11,77 | 1,31 | 5,3190 | −0,7354 | |||||
| AEM / Agnico Eagle Mines Limited | 0,09 | 87,50 | 10,70 | 105,71 | 4,8372 | 2,1254 | |||
| NEM / Newmont Corporation | 0,18 | 0,00 | 10,49 | 20,67 | 4,7392 | 0,2104 | |||
| B / Barrick Mining Corporation | 0,48 | 6,67 | 9,99 | 14,23 | 4,5163 | −0,0425 | |||
| US9128286X38 / United States Treasury Note/Bond | 9,83 | 0,44 | 4,4418 | −0,6577 | |||||
| US9128282A70 / United States Treasury Note/Bond | 9,73 | 0,65 | 4,3986 | −0,6409 | |||||
| U.S. Treasury Inflation-Protected Notes 1.75%, Due 01/15/2034 / DBT (US91282CJY84) | 5,19 | 0,56 | 2,3433 | −0,3441 | |||||
| U.S. Treasury Inflation-Protected Notes 2.125%, Due 02/15/2054 / DBT (US912810TY47) | 4,81 | −2,83 | 2,1744 | −0,4061 | |||||
| RGLD / Royal Gold, Inc. | 0,02 | 100,00 | 3,73 | 117,60 | 1,6878 | 0,7931 | |||
| AGI / Alamos Gold Inc. | 0,07 | 1 150,00 | 1,99 | 1 145,00 | 0,9002 | 0,8166 | |||
| KGC / Kinross Gold Corporation | 0,12 | −33,33 | 1,88 | −17,36 | 0,8476 | −0,3352 | |||
| AU / AngloGold Ashanti plc | 0,03 | −66,67 | 1,37 | −59,07 | 0,6178 | −1,1232 | |||
| PAAS / Pan American Silver Corp. | 0,04 | −30,77 | 1,28 | −23,84 | 0,5776 | −0,2974 | |||
| BTG / B2Gold Corp. | 0,34 | 70,00 | 1,23 | 115,26 | 0,5547 | 0,2576 | |||
| HL / Hecla Mining Company | 0,18 | 20,00 | 1,08 | 29,26 | 0,4873 | 0,0526 | |||
| FXE / Invesco CurrencyShares Euro Trust | 0,01 | 0,00 | 0,82 | 8,81 | 0,3687 | −0,0217 | |||
| FXY / Invesco CurrencyShares Japanese Yen Trust | 0,01 | 0,00 | 0,80 | 4,04 | 0,3612 | −0,0394 | |||
| FXB / Invesco CurrencyShares British Pound Sterling Trust | 0,01 | 0,00 | 0,66 | 6,11 | 0,2986 | −0,0255 | |||
| NRG / NRG Energy, Inc. | 0,00 | 0,00 | 0,16 | 68,42 | 0,0726 | 0,0228 | |||
| ED / Consolidated Edison, Inc. | 0,00 | 0,00 | 0,10 | −9,09 | 0,0454 | −0,0123 | |||
| PNW / Pinnacle West Capital Corporation | 0,00 | 0,00 | 0,09 | −6,32 | 0,0404 | −0,0092 | |||
| ETR / Entergy Corporation | 0,00 | 0,00 | 0,08 | −2,35 | 0,0376 | −0,0070 | |||
| OTTR / Otter Tail Corporation | 0,00 | 0,00 | 0,08 | −3,75 | 0,0348 | −0,0070 | |||
| ALE / ALLETE, Inc. | 0,00 | 0,00 | 0,06 | −1,54 | 0,0290 | −0,0053 | |||
| DUK / Duke Energy Corporation | 0,00 | 0,00 | 0,06 | −1,67 | 0,0267 | −0,0051 | |||
| DTM / DT Midstream, Inc. | 0,00 | 0,00 | 0,05 | 12,50 | 0,0248 | −0,0003 | |||
| NWE / NorthWestern Energy Group, Inc. | 0,00 | 0,00 | 0,05 | −10,53 | 0,0232 | −0,0070 | |||
| SO / The Southern Company | 0,00 | 0,00 | 0,05 | 0,00 | 0,0207 | −0,0032 | |||
| CRC / California Resources Corporation | 0,00 | 0,00 | 0,05 | 4,65 | 0,0206 | −0,0023 | |||
| EXC / Exelon Corporation | 0,00 | 0,00 | 0,04 | −6,52 | 0,0196 | −0,0044 | |||
| PEG / Public Service Enterprise Group Incorporated | 0,00 | 0,00 | 0,04 | 2,44 | 0,0190 | −0,0024 | |||
| POR / Portland General Electric Company | 0,00 | 0,00 | 0,04 | −9,09 | 0,0184 | −0,0049 | |||
| FE / FirstEnergy Corp. | 0,00 | 0,00 | 0,04 | 0,00 | 0,0182 | −0,0029 | |||
| AVA / Avista Corporation | 0,00 | 0,00 | 0,04 | −9,76 | 0,0172 | −0,0047 | |||
| PPL / PPL Corporation | 0,00 | 0,00 | 0,03 | −8,33 | 0,0153 | −0,0035 | |||
| D / Dominion Energy, Inc. | 0,00 | 0,00 | 0,03 | 0,00 | 0,0128 | −0,0018 | |||
| BKH / Black Hills Corporation | 0,00 | 0,00 | 0,03 | −6,67 | 0,0127 | −0,0031 | |||
| EIX / Edison International | 0,00 | 0,00 | 0,03 | −13,79 | 0,0117 | −0,0037 | |||
| VTLE / Vital Energy, Inc. | 0,00 | 0,00 | 0,02 | −23,81 | 0,0073 | −0,0038 | |||
| DTE / DTE Energy Company | 0,00 | 0,00 | 0,01 | 0,00 | 0,0060 | −0,0012 | |||
| HE / Hawaiian Electric Industries, Inc. | 0,00 | 0,00 | 0,01 | 0,00 | 0,0048 | −0,0009 | |||
| AES / The AES Corporation | 0,00 | 0,00 | 0,01 | −16,67 | 0,0048 | −0,0017 | |||
| AEP / American Electric Power Company, Inc. | 0,00 | 0,00 | 0,01 | 0,00 | 0,0047 | −0,0010 | |||
| GWRS / Global Water Resources, Inc. | 0,00 | 0,00 | 0,01 | 0,00 | 0,0046 | −0,0008 | |||
| AEE / Ameren Corporation | 0,00 | 0,00 | 0,01 | −10,00 | 0,0043 | −0,0009 | |||
| Nabors Industries Ltd. $166.6667 - Warrants / DE (N/A) | 0,01 | 0,01 | 0,0024 | 0,0024 |