WRAP - Wrap Technologies, Inc. Aksjer - aksjekurs, institusjonelt eierskap, aksjonærer (NasdaqCM).

Wrap Technologies, Inc.
US ˙ NasdaqCM ˙ US98212N1072

Grunnleggende statistikk
Institusjonelle eiere 71 total, 69 long only, 0 short only, 2 long/short - change of 5,97% MRQ
Gjennomsnittlig porteføljeallokering 0.0031 % - change of 4,78% MRQ
Utestående aksjer shares (source: Capital IQ)
Institusjonelle aksjer (Long) 4 930 373 - 9,70% (ex 13D/G) - change of 0,14MM shares 2,82% MRQ
Institusjonell verdi (Long) $ 7 537 USD ($1000)
Institusjonelt eierskap og aksjonærer

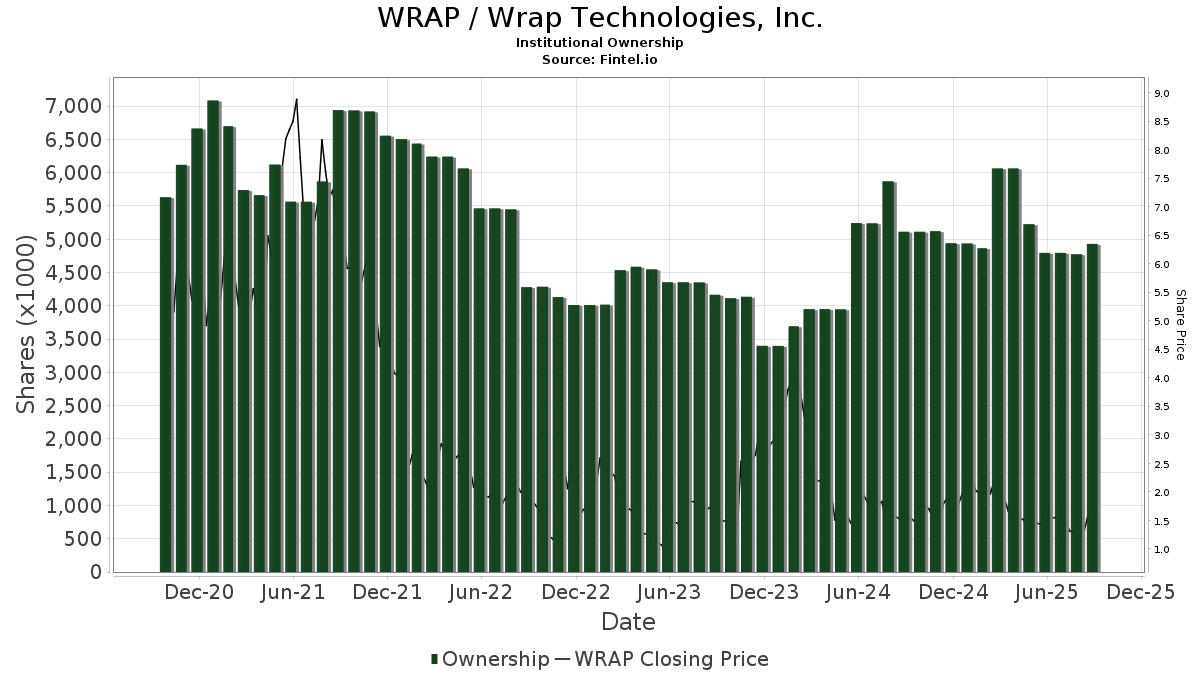
Wrap Technologies, Inc. (US:WRAP) har 71 institusjonelle eiere og aksjonærer som har sendt inn 13D/G- eller 13F-skjemaer til Securities Exchange Commission (SEC). Disse institusjonene eier til sammen 4,930,373 aksjer. De største aksjonærene inkluderer Vanguard Group Inc, VTSMX - Vanguard Total Stock Market Index Fund Investor Shares, Raymond James Financial Inc, BlackRock, Inc., VEXMX - Vanguard Extended Market Index Fund Investor Shares, Geode Capital Management, Llc, FSMAX - Fidelity Extended Market Index Fund, State Street Corp, LPL Financial LLC, and Caption Management, LLC .

Wrap Technologies, Inc. (NasdaqCM:WRAP) institusjonell eierstruktur viser nåværende posisjoner i selskapet fordelt på institusjoner og fond, samt de siste endringene i posisjonsstørrelse. De største aksjonærene kan være individuelle investorer, verdipapirfond, hedgefond eller institusjoner. Schedule 13D indikerer at investoren eier (eller har eid) mer enn 5 % av selskapet og har til hensikt (eller hadde til hensikt) å aktivt forfølge en endring i forretningsstrategien. Schedule 13G indikerer en passiv investering på over 5 %.

The share price as of September 12, 2025 is 2,05 / share. Previously, on September 13, 2024, the share price was 1,46 / share. This represents an increase of 40,41% over that period.

WRAP / Wrap Technologies, Inc. Institutional Ownership
Fondssentiment-score

Fondssentiment Score (også kjent som akkumulering av eierskap poengsum) viser hvilke aksjer som er mest kjøpt av fond. Den er resultatet av en sofistikert, kvantitativ flerfaktormodell som identifiserer selskaper med de høyeste nivåene av institusjonell akkumulering. Beregningsmodellen for poeng bruker en kombinasjon av den totale økningen i antall offentliggjorte eiere, endringer i porteføljeallokeringen til disse eierne og andre beregninger. Tallet går fra 0 til 100, der høyere tall indikerer en høyere grad av akkumulering i forhold til sammenlignbare selskaper, der 50 er gjennomsnittet.

Oppdateringsfrekvens: Daglig

Sjekk ut Ownership Explorer, som inneholder en liste over de høyest rangerte selskapene.

Institusjonell Put/Call-forhold

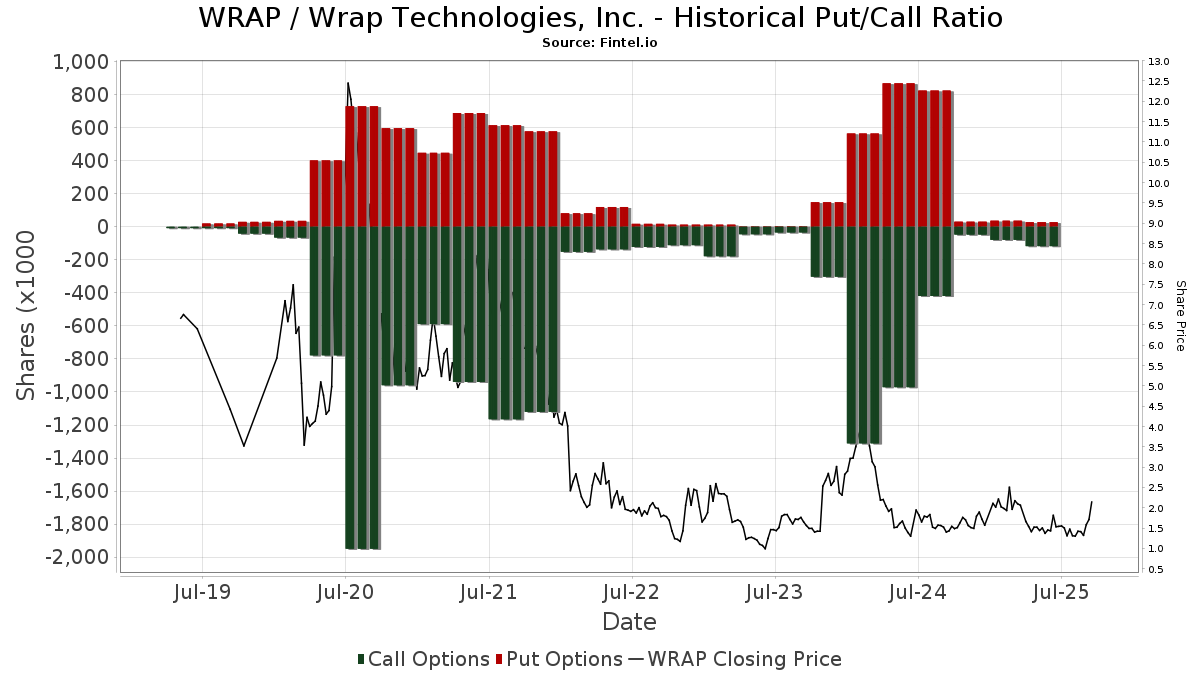
I tillegg til å rapportere standard aksje- og gjeldsemisjoner må institusjoner med mer enn 100 millioner kroner i forvaltningskapital også oppgi beholdningen av put- og callopsjoner. Siden put-opsjoner generelt indikerer et negativt sentiment, og call-opsjoner indikerer et positivt sentiment, kan vi få et inntrykk av det generelle institusjonelle sentimentet ved å plotte forholdet mellom put- og call-opsjoner. Diagrammet til høyre viser det historiske forholdet mellom put- og call-opsjoner for dette instrumentet.

Ved å bruke Put/Call-forholdet som en indikator på investorsentimentet kan man overvinne en av de viktigste svakhetene ved å bruke totalt institusjonelt eierskap, nemlig at en betydelig andel av forvaltningskapitalen investeres passivt for å følge indekser. Passivt forvaltede fond kjøper vanligvis ikke opsjoner, slik at indikatoren for put/call-forhold i større grad gjenspeiler stemningen i aktivt forvaltede fond.

WRAP / Wrap Technologies, Inc. Historical Put/Call Ratio
13D/G-arkiveringer

Vi presenterer 13D/G-arkiveringene separat fra 13F-arkiveringene fordi de behandles forskjellig av SEC. 13D/G-arkiveringene kan sendes inn av grupper av investorer (med én leder), mens 13D/G-arkiveringene ikke kan sendes inn. Dette fører til situasjoner der en investor kan sende inn en 13D/G-rapport med én verdi for alle aksjene (som representerer alle aksjene som eies av investorgruppen), men deretter sende inn en 13F-melding med en annen verdi for alle aksjene (som kun representerer deres eget eierskap). Dette betyr at aksjeeierskap i 13D/G-arkiveringene og 13F-arkiveringene ofte ikke er direkte sammenlignbare, og vi presenterer dem derfor separat.

Merk: Fra og med 16. mai 2021 viser vi ikke lenger eiere som ikke har sendt inn en 13D/G i løpet av det siste året. Tidligere viste vi hele historikken for 13D/G-arkiveringer. Generelt må enheter som er pålagt å sende inn 13D/G-arkiveringer, sende inn minst én gang i året før de sender inn en avsluttende rapport. Det hender imidlertid at fond trekker seg ut av posisjoner uten å sende inn en avsluttende innlevering (dvs. at de avvikler), slik at visning av hele historikken av og til fører til forvirring om det nåværende eierskapet. For å unngå forvirring viser vi nå bare "nåværende" eiere, det vil si eiere som har sendt inn informasjon i løpet av det siste året.

Upgrade to unlock premium data.

Fildato Skjema Investor Tidligere
aksjer
Siste
aksjer
Δ Aksjer
(prosent)
Eierandel
(prosent)
Δ Eierandel
(prosent)
2025-05-08 13D/A NORRIS ELWOOD G 6,452,457 6,320,392 -2.05 12.50 -26.90
2025-04-09 13D/A Cohen Scot 13,526,827 24.10 2.99
13F- og NPORT-arkiveringer

Detaljer om 13F-arkiveringer er gratis. Detaljer om NP-arkiveringer krever et premium-medlemskap. Grønne rader indikerer nye posisjoner. Røde rader indikerer lukkede posisjoner. Klikk på lenke ikonet for å se hele transaksjonshistorikken.

Oppgrader for å låse opp premiedata og eksportere til Excel. .

Fildato Kilde Investor Type Gjennomsnittlig pris
(estimert)
Aksjer Δ Aksjer
(%)
Rapportert verdi ($1000) Verdi (%) Portallokering (%)
2025-08-14 13F Royal Capital Wealth Management, LLC 54 612 0,00 85 −8,60
2025-08-11 13F HighTower Advisors, LLC 63 415 3,37 99 −5,77
2025-08-27 NP VEXMX - Vanguard Extended Market Index Fund Investor Shares This fund is a listed as child fund of Vanguard Group Inc and if that institution has disclosed ownership in this security, then these positions will not be double counted when calculating total shares and total value 405 134 0,00 632 −8,67
2025-08-11 13F Core Wealth Partners LLC 11 400 0,00 18 −10,53
2025-08-11 13F HighTower Advisors, LLC Call 14 400 33,33 3 50,00
2025-08-13 13F IAG Wealth Partners, LLC 3 000 0,00 5 −20,00
2025-08-05 13F Simplex Trading, Llc 42 327 209,72 0
2025-07-24 13F Financial Security Advisor, Inc. 44 895 0,00 70 −7,89
2025-08-19 13F Newbridge Financial Services Group, Inc. 2 000 0,00 3 0,00
2025-08-14 13F Raymond James Financial Inc 610 424 −0,84 952 −9,51
2025-08-13 13F Northwestern Mutual Wealth Management Co 0 −100,00 0
2025-08-27 NP VITNX - Vanguard Institutional Total Stock Market Index Fund Institutional Shares This fund is a listed as child fund of Vanguard Group Inc and if that institution has disclosed ownership in this security, then these positions will not be double counted when calculating total shares and total value 23 362 0,00 36 −7,69
2025-07-10 13F Kozak & Associates, Inc. 399 0,00 1
2025-08-06 13F Commonwealth Equity Services, Llc 14 406 −47,20 0
2025-08-08 13F SG Americas Securities, LLC 0 −100,00 0
2025-08-13 13F Alerus Financial Na 0 −100,00 0
2025-05-12 13F Virtu Financial LLC 0 −100,00 0
2025-08-14 13F Citadel Advisors Llc Call 64 200 34,31 100 23,46
2025-05-29 NP JAFEX - Total Stock Market Index Trust NAV 796 20,79 1 0,00
2025-08-12 13F MAI Capital Management 6 125 0,00 10 −10,00
2025-08-14 13F Citadel Advisors Llc Put 14 900 −60,48 23 −64,06
2025-08-28 NP IWC - iShares Micro-Cap ETF This fund is a listed as child fund of BlackRock Inc. and if that institution has disclosed ownership in this security, then these positions will not be double counted when calculating total shares and total value 77 353 1,10 121 −7,69
2025-08-14 13F Goldman Sachs Group Inc 13 114 20
2025-08-15 13F Tower Research Capital LLC (TRC) 666 −76,98 1 −75,00
2025-08-11 13F Vanguard Group Inc 1 562 126 13,53 2 437 3,57
2025-08-14 13F Wells Fargo & Company/mn 1 015 −81,92 2 −88,89
2025-08-12 13F LPL Financial LLC 104 206 60,18 163 45,95
2025-08-12 13F BlackRock, Inc. 511 711 −6,14 798 −14,38
2025-07-18 13F Dogwood Wealth Management LLC 5 0
2025-04-17 13F FNY Investment Advisers, LLC 0 −100,00 0
2025-07-24 13F CarsonAllaria Wealth Management, Ltd. 1 375 0,00 2 0,00
2025-08-14 13F Caption Management, LLC 101 055 −0,23 158 −9,25
2025-08-14 13F Caption Management, LLC Call 1 600 −82,22 2 −86,67
2025-08-14 13F State Street Corp 111 567 0,00 174 −8,42
2025-08-14 13F Jane Street Group, Llc 23 461 −33,99 37 −40,00
2025-09-04 13F/A Advisor Group Holdings, Inc. 53 708 13,63 84 3,75
2025-07-21 13F Ameritas Advisory Services, LLC 1 000 2
2025-08-08 13F Comprehensive Financial Planning, Inc./PA 100 0,00 0
2025-08-13 13F Marshall Wace, Llp 29 735 −81,94 46 −83,63
2025-08-27 13F/A Squarepoint Ops LLC 34 559 54
2025-08-08 13F Larson Financial Group LLC 0 −100,00 0
2025-08-12 13F Charles Schwab Investment Management Inc 21 515 0,00 34 −8,33
2025-08-14 13F Bank Of America Corp /de/ 3 444 −1,43 5 0,00
2025-08-14 13F CoreCap Advisors, LLC 1 767 0,00 3 −33,33
2025-08-14 13F Main Street Financial Solutions, LLC 57 400 0,00 90 −9,18
2025-08-14 13F UBS Group AG 41 444 7,66 65 −1,54
2025-07-08 13F Nbc Securities, Inc. 3 000 0,00 0
2025-08-26 NP EQ ADVISORS TRUST - 1290 VT Micro Cap Portfolio Class IB 7 146 22,76 11 22,22
2025-08-14 13F Royal Bank Of Canada 82 600 32 165,62 129
2025-05-05 13F IFP Advisors, Inc 0 −100,00 0
2025-07-24 NP FCFMX - Fidelity Series Total Market Index Fund This fund is a listed as child fund of Fmr Llc and if that institution has disclosed ownership in this security, then these positions will not be double counted when calculating total shares and total value 46 871 15,12 68 −24,72
2025-08-14 13F Susquehanna International Group, Llp 81 557 55,42 127 42,70
2025-05-15 13F Two Sigma Securities, Llc 0 −100,00 0
2025-08-14 13F Susquehanna International Group, Llp Call 14 900 27,35 23 15,00
2025-08-27 NP VBINX - Vanguard Balanced Index Fund Investor Shares This fund is a listed as child fund of Vanguard Group Inc and if that institution has disclosed ownership in this security, then these positions will not be double counted when calculating total shares and total value 21 600 0,00 34 −8,33
2025-08-14 13F Susquehanna International Group, Llp Put 13 400 21
2025-08-13 13F Jones Financial Companies Lllp 3 700 0,00 6 −28,57
2025-07-24 NP FSKAX - Fidelity Total Market Index Fund This fund is a listed as child fund of Fmr Llc and if that institution has disclosed ownership in this security, then these positions will not be double counted when calculating total shares and total value 64 155 20,70 93 −19,83
2025-08-27 NP VTSMX - Vanguard Total Stock Market Index Fund Investor Shares This fund is a listed as child fund of Vanguard Group Inc and if that institution has disclosed ownership in this security, then these positions will not be double counted when calculating total shares and total value 1 103 007 20,31 1 721 9,76
2025-07-09 13F Sapient Capital Llc 0 −100,00 0
2025-07-25 13F NorthRock Partners, LLC 62 344 0,00 97 −8,49
2025-08-14 13F Bnp Paribas Arbitrage, Sa 82 0,00 0
2025-07-24 NP FSMAX - Fidelity Extended Market Index Fund This fund is a listed as child fund of Fmr Llc and if that institution has disclosed ownership in this security, then these positions will not be double counted when calculating total shares and total value 172 916 3,80 251 −31,32
2025-08-12 13F Proequities, Inc. 0 0
2025-08-12 13F Jpmorgan Chase & Co 75 −57,14 0
2025-04-28 13F American Capital Advisory, LLC 0 −100,00 0
2025-08-07 13F Allworth Financial LP 6 431 10
2025-08-13 13F Northern Trust Corp 55 420 0,00 86 −8,51
2025-08-14 13F Citadel Advisors Llc 0 −100,00 0 −100,00
2025-07-24 NP FNCMX - Fidelity Nasdaq Composite Index Fund This fund is a listed as child fund of Fmr Llc and if that institution has disclosed ownership in this security, then these positions will not be double counted when calculating total shares and total value 38 058 0,00 55 −33,73
2025-08-14 13F Harwood Advisory Group, LLC 1 616 0,00 3 −33,33
2025-06-24 NP SWTSX - Schwab Total Stock Market Index Fund This fund is a listed as child fund of Charles Schwab Investment Management Inc and if that institution has disclosed ownership in this security, then these positions will not be double counted when calculating total shares and total value 21 515 0,00 33 −25,58
2025-08-11 13F Wealthspire Advisors, LLC 44 834 0,00 70 −9,21
2025-07-22 13F Gsa Capital Partners Llp 0 −100,00 0
2025-08-18 13F Wolverine Trading, Llc Call 22 300 35
2025-07-25 13F Cwm, Llc 300 0,00 0
2025-08-13 13F Renaissance Technologies Llc 46 800 73
2025-04-30 13F Cornerstone Planning Group LLC 0 −100,00 0
2025-08-12 13F XTX Topco Ltd 20 266 32
2025-08-12 13F Steward Partners Investment Advisory, Llc 1 000 −81,82 2 −88,89
2025-08-15 13F Morgan Stanley 87 955 −8,94 137 −16,97
2025-07-25 13F Griffin Asset Management, Inc. 12 000 −7,69 19 −18,18
2025-07-31 13F City State Bank 100 0,00 0
2025-08-05 13F Seelaus Asset Management LLC 30 140 0,00 47 −7,84
2025-05-15 13F Two Sigma Investments, Lp 0 −100,00 0
2025-08-20 13F/A Thompson Davis & Co., Inc. 66 150 103
2025-07-18 13F PFG Investments, LLC 11 180 −32,16 17 −39,29
2025-08-08 13F Geode Capital Management, Llc 377 369 0,44 589 −8,41
2025-08-14 13F Group One Trading, L.p. 183 −87,52 0 −100,00
Fintel data has been cited in the following publications:
Daily Mail Fox Business Business Insider Wall Street Journal The Washington Post Bloomberg Financial Times Globe and Mail
NASDAQ.com Reuters The Guardian Associated Press FactCheck.org Snopes Politifact
Federal Register The Intercept Forbes Fortune Magazine TheStreet Time Magazine Canadian Broadcasting Corporation International Business Times
Cambridge University Press Investopedia MarketWatch NY Daily News Entrepreneur Newsweek Barron's El Economista