Grunnleggende statistikk
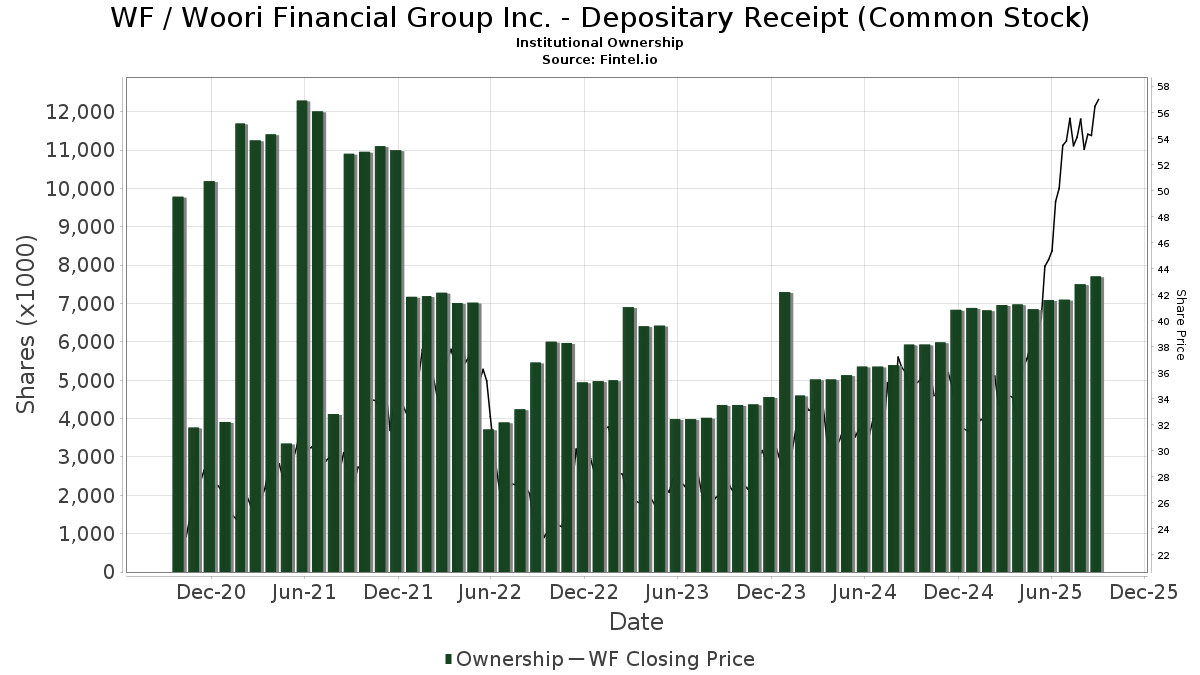
| Institusjonelle eiere | 161 total, 161 long only, 0 short only, 0 long/short - change of 6,62% MRQ |
| Gjennomsnittlig porteføljeallokering | 0.0698 % - change of 5,44% MRQ |
| Institusjonelle aksjer (Long) | 7 708 767 (ex 13D/G) - change of 0,62MM shares 8,72% MRQ |
| Institusjonell verdi (Long) | $ 355 180 USD ($1000) |
Institusjonelt eierskap og aksjonærer
Woori Financial Group Inc. - Depositary Receipt (Common Stock) (US:WF) har 161 institusjonelle eiere og aksjonærer som har sendt inn 13D/G- eller 13F-skjemaer til Securities Exchange Commission (SEC). Disse institusjonene eier til sammen 7,708,767 aksjer. De største aksjonærene inkluderer BlackRock, Inc., Morgan Stanley, Connor, Clark & Lunn Investment Management Ltd., Valeo Financial Advisors, LLC, Arrowstreet Capital, Limited Partnership, Creative Planning, Acadian Asset Management Llc, Vident Advisory, LLC, Ethic Inc., and JustInvest LLC .
Woori Financial Group Inc. - Depositary Receipt (Common Stock) (NYSE:WF) institusjonell eierstruktur viser nåværende posisjoner i selskapet fordelt på institusjoner og fond, samt de siste endringene i posisjonsstørrelse. De største aksjonærene kan være individuelle investorer, verdipapirfond, hedgefond eller institusjoner. Schedule 13D indikerer at investoren eier (eller har eid) mer enn 5 % av selskapet og har til hensikt (eller hadde til hensikt) å aktivt forfølge en endring i forretningsstrategien. Schedule 13G indikerer en passiv investering på over 5 %.
The share price as of September 10, 2025 is 56,47 / share. Previously, on September 11, 2024, the share price was 34,10 / share. This represents an increase of 65,60% over that period.
Fondssentiment-score
Fondssentiment Score (også kjent som akkumulering av eierskap poengsum) viser hvilke aksjer som er mest kjøpt av fond. Den er resultatet av en sofistikert, kvantitativ flerfaktormodell som identifiserer selskaper med de høyeste nivåene av institusjonell akkumulering. Beregningsmodellen for poeng bruker en kombinasjon av den totale økningen i antall offentliggjorte eiere, endringer i porteføljeallokeringen til disse eierne og andre beregninger. Tallet går fra 0 til 100, der høyere tall indikerer en høyere grad av akkumulering i forhold til sammenlignbare selskaper, der 50 er gjennomsnittet.
Oppdateringsfrekvens: Daglig
Sjekk ut Ownership Explorer, som inneholder en liste over de høyest rangerte selskapene.
Institusjonell Put/Call-forhold
I tillegg til å rapportere standard aksje- og gjeldsemisjoner må institusjoner med mer enn 100 millioner kroner i forvaltningskapital også oppgi beholdningen av put- og callopsjoner. Siden put-opsjoner generelt indikerer et negativt sentiment, og call-opsjoner indikerer et positivt sentiment, kan vi få et inntrykk av det generelle institusjonelle sentimentet ved å plotte forholdet mellom put- og call-opsjoner. Diagrammet til høyre viser det historiske forholdet mellom put- og call-opsjoner for dette instrumentet.
Ved å bruke Put/Call-forholdet som en indikator på investorsentimentet kan man overvinne en av de viktigste svakhetene ved å bruke totalt institusjonelt eierskap, nemlig at en betydelig andel av forvaltningskapitalen investeres passivt for å følge indekser. Passivt forvaltede fond kjøper vanligvis ikke opsjoner, slik at indikatoren for put/call-forhold i større grad gjenspeiler stemningen i aktivt forvaltede fond.
13F- og NPORT-arkiveringer
Detaljer om 13F-arkiveringer er gratis. Detaljer om NP-arkiveringer krever et premium-medlemskap. Grønne rader indikerer nye posisjoner. Røde rader indikerer lukkede posisjoner. Klikk på lenke ikonet for å se hele transaksjonshistorikken.
Oppgrader
for å låse opp premiedata og eksportere til Excel. ![]() .
.
| Fildato | Kilde | Investor | Type | Gjennomsnittlig pris (estimert) |
Aksjer | Δ Aksjer (%) |
Rapportert verdi ($1000) | Verdi (%) | Portallokering (%) | |
|---|---|---|---|---|---|---|---|---|---|---|
| 2025-07-14 | 13F | Abound Wealth Management | 30 | 0,00 | 1 | 0,00 | ||||
| 2025-08-05 | 13F | Bridgewater Advisors Inc. | 12 225 | 2,05 | 650 | 48,74 | ||||
| 2025-05-16 | 13F | Jones Financial Companies Lllp | 0 | −100,00 | 0 | |||||
| 2025-07-25 | 13F | JustInvest LLC | 100 704 | 27,95 | 5 008 | 90,64 | ||||
| 2025-08-04 | 13F | Hantz Financial Services, Inc. | 1 568 | 7 366,67 | 0 | |||||
| 2025-08-14 | 13F | Vident Advisory, LLC | 117 759 | 2,08 | 5 856 | 52,06 | ||||
| 2025-07-09 | 13F | Sivia Capital Partners, LLC | 9 229 | −7,54 | 459 | 37,54 | ||||
| 2025-08-12 | 13F | Proequities, Inc. | 0 | 0 | ||||||
| 2025-08-14 | 13F | Strategic Global Advisors, LLC | 12 792 | 0,00 | 636 | 49,30 | ||||
| 2025-07-25 | 13F | Sequoia Financial Advisors, LLC | 30 027 | 19,96 | 1 493 | 78,80 | ||||
| 2025-08-14 | 13F | Point72 Asset Management, L.P. | 0 | −100,00 | 0 | |||||
| 2025-08-14 | 13F | Granite FO LLC | 43 | 0,00 | 2 | 100,00 | ||||
| 2025-08-27 | NP | RMEAX - Aspiriant Risk-Managed Equity Allocation Fund Advisor Shares | 1 | 0,00 | 0 | |||||
| 2025-06-26 | NP | DFAX - Dimensional World ex U.S. Core Equity 2 ETF | 2 894 | 0,00 | 107 | 13,83 | ||||
| 2025-08-13 | 13F | Quadrant Capital Group Llc | 29 392 | −43,48 | 1 462 | −15,79 | ||||
| 2025-07-08 | 13F | Parallel Advisors, LLC | 14 709 | −0,12 | 731 | 48,88 | ||||
| 2025-08-12 | 13F | CIBC Private Wealth Group, LLC | 129 | −68,54 | 6 | −50,00 | ||||
| 2025-08-14 | 13F | Evergreen Capital Management Llc | 6 301 | 313 | ||||||
| 2025-08-13 | 13F | Victory Capital Management Inc | 36 615 | 0,00 | 1 821 | 48,94 | ||||
| 2025-08-13 | 13F | Arrowstreet Capital, Limited Partnership | 284 575 | −1,90 | 14 152 | 46,16 | ||||
| 2025-08-13 | 13F | Townsquare Capital Llc | 0 | −100,00 | 0 | |||||
| 2025-08-19 | 13F | Asset Dedication, LLC | 0 | −100,00 | 0 | |||||
| 2025-06-26 | NP | DFA INVESTMENT DIMENSIONS GROUP INC - Emerging Markets Social Core Equity Portfolio Shares | 291 | 0,00 | 11 | 11,11 | ||||
| 2025-09-04 | 13F/A | Advisor Group Holdings, Inc. | 1 042 | 51,90 | 51 | 131,82 | ||||
| 2025-08-12 | 13F | O'shaughnessy Asset Management, Llc | 89 110 | 3,11 | 4 431 | 53,64 | ||||
| 2025-07-22 | 13F | Valeo Financial Advisors, LLC | 363 718 | 388 | ||||||
| 2025-07-24 | 13F | Ramirez Asset Management, Inc. | 39 157 | −0,78 | 1 947 | 47,84 | ||||
| 2025-08-12 | 13F | MAI Capital Management | 4 327 | 215 | ||||||
| 2025-08-12 | 13F | Global Retirement Partners, LLC | 646 | −29,48 | 32 | 14,29 | ||||
| 2025-07-16 | 13F | Signaturefd, Llc | 43 212 | 2,10 | 2 149 | 52,12 | ||||
| 2025-08-12 | 13F | XTX Topco Ltd | 0 | −100,00 | 0 | |||||
| 2025-08-15 | 13F | Morgan Stanley | 1 511 459 | 8,24 | 75 165 | 61,26 | ||||
| 2025-05-08 | NP | QGBLX - Quantified Global Fund Investor Class | 15 723 | 1 425,02 | 525 | 1 537,50 | ||||
| 2025-08-12 | 13F | LPL Financial LLC | 7 163 | −45,48 | 356 | −18,72 | ||||
| 2025-08-14 | 13F | Quantinno Capital Management LP | 84 072 | 48,96 | 4 181 | 121,99 | ||||
| 2025-08-05 | 13F | Westside Investment Management, Inc. | 512 | 25 | ||||||
| 2025-08-14 | 13F | UBS Group AG | 22 613 | 843,78 | 1 125 | 1 322,78 | ||||
| 2025-07-24 | 13F | Ronald Blue Trust, Inc. | 11 549 | 30,44 | 574 | 94,58 | ||||
| 2025-08-14 | 13F | Royal Bank Of Canada | 3 429 | 187,19 | 171 | 327,50 | ||||
| 2025-06-23 | NP | UUPIX - Ultraemerging Markets Profund Investor Class | 884 | 6,38 | 33 | 18,52 | ||||
| 2025-07-21 | 13F | Qrg Capital Management, Inc. | 11 865 | 18,08 | 590 | 76,12 | ||||
| 2025-08-14 | 13F | Smartleaf Asset Management LLC | 984 | 551,66 | 48 | 860,00 | ||||
| 2025-06-26 | NP | DEXC - Dimensional Emerging Markets ex China Core Equity ETF | 6 385 | 10,56 | 237 | 25,53 | ||||
| 2025-05-01 | 13F | Schechter Investment Advisors, LLC | 8 780 | −26,34 | 293 | −21,24 | ||||
| 2025-08-14 | 13F | Ieq Capital, Llc | 9 185 | 41,16 | 457 | 110,14 | ||||
| 2025-08-14 | 13F | Atomi Financial Group, Inc. | 7 250 | 12,44 | 361 | 67,44 | ||||
| 2025-08-07 | 13F | Connor, Clark & Lunn Investment Management Ltd. | 494 930 | −8,46 | 24 613 | 36,38 | ||||
| 2025-08-11 | 13F | Brown Brothers Harriman & Co | 296 | 15 | ||||||
| 2025-08-13 | 13F | First Trust Advisors Lp | 21 729 | −5,18 | 1 081 | 41,36 | ||||
| 2025-07-11 | 13F/A | Umb Bank N A/mo | 527 | 0,00 | 26 | 52,94 | ||||
| 2025-07-28 | 13F | Ritholtz Wealth Management | 36 171 | 19,98 | 1 799 | 78,73 | ||||
| 2025-08-12 | 13F | Franklin Resources Inc | 6 507 | 5,89 | 324 | 57,56 | ||||
| 2025-08-14 | 13F | Fmr Llc | 36 011 | −0,14 | 1 791 | 48,79 | ||||
| 2025-08-04 | 13F | Assetmark, Inc | 17 172 | 1 593,49 | 854 | 2 484,85 | ||||
| 2025-08-06 | 13F | First Horizon Advisors, Inc. | 14 | 0,00 | 1 | |||||
| 2025-08-11 | 13F | Pinnacle Wealth Planning Services, Inc. | 5 109 | −41,74 | 254 | −13,01 | ||||
| 2025-08-11 | 13F | Frank, Rimerman Advisors LLC | 4 453 | 221 | ||||||
| 2025-08-14 | 13F | Bnp Paribas Arbitrage, Sa | 53 059 | 2,29 | 2 639 | 52,40 | ||||
| 2025-08-14 | 13F | Cubist Systematic Strategies, LLC | 0 | −100,00 | 0 | |||||
| 2025-06-26 | NP | DEHP - Dimensional Emerging Markets High Profitability ETF | 4 438 | −6,73 | 165 | 5,81 | ||||
| 2025-08-08 | 13F | SBI Securities Co., Ltd. | 226 | −47,44 | 11 | −21,43 | ||||
| 2025-08-07 | 13F | Parkside Financial Bank & Trust | 140 | 7 | ||||||
| 2025-06-26 | NP | DFA INVESTMENT DIMENSIONS GROUP INC - Emerging Markets Sustainability Core 1 Portfolio Institutional Class This fund is a listed as child fund of Dimensional Fund Advisors Lp and if that institution has disclosed ownership in this security, then these positions will not be double counted when calculating total shares and total value | 773 | 0,00 | 29 | 12,00 | ||||
| 2025-08-12 | 13F | Wayfinding Financial, LLC | 0 | −100,00 | 0 | |||||
| 2025-08-07 | 13F | Allworth Financial LP | 1 171 | 25,51 | 58 | 70,59 | ||||
| 2025-08-13 | 13F | Northern Trust Corp | 28 737 | 4,79 | 1 429 | 56,17 | ||||
| 2025-04-21 | 13F | Nelson, Van Denburg & Campbell Wealth Management Group, LLC | 0 | −100,00 | 0 | |||||
| 2025-08-04 | 13F | Simon Quick Advisors, Llc | 6 359 | 316 | ||||||
| 2025-08-14 | 13F | Mariner, LLC | 27 799 | 9,06 | 1 381 | 62,47 | ||||
| 2025-08-14 | 13F | Aqr Capital Management Llc | 38 041 | 88,67 | 1 892 | 180,98 | ||||
| 2025-08-18 | 13F | Geneos Wealth Management Inc. | 20 | 1 | ||||||
| 2025-07-22 | 13F | Miracle Mile Advisors, LLC | 10 778 | 4,37 | 536 | 55,52 | ||||
| 2025-07-25 | 13F | Cwm, Llc | 2 987 | −6,07 | 0 | |||||
| 2025-08-15 | 13F | CI Private Wealth, LLC | 34 876 | 71,40 | 1 734 | 155,38 | ||||
| 2025-05-05 | 13F | Lindbrook Capital, Llc | 5 566 | 3,50 | 186 | 10,12 | ||||
| 2025-07-15 | 13F | Public Employees Retirement System Of Ohio | 31 325 | −11,89 | 1 558 | 31,28 | ||||
| 2025-08-11 | 13F | Principal Securities, Inc. | 55 | −57,03 | 3 | −50,00 | ||||
| 2025-07-11 | 13F | Farther Finance Advisors, LLC | 949 | 1 255,71 | 47 | 2 250,00 | ||||
| 2025-08-14 | 13F | Ariadne Wealth Management, LP | 6 896 | 0,09 | 383 | 47,49 | ||||
| 2025-08-14 | 13F | Millennium Management Llc | 63 281 | −1,38 | 3 147 | 46,94 | ||||
| 2025-08-29 | NP | MPLAX - Praxis International Index Fund Class A | 34 279 | 0,00 | 1 705 | 48,95 | ||||
| 2025-08-14 | 13F | Verition Fund Management LLC | 0 | −100,00 | 0 | |||||
| 2025-07-14 | 13F | Foster Group, Inc. | 6 199 | −6,23 | 308 | 40,00 | ||||
| 2025-08-14 | 13F | Sei Investments Co | 65 522 | 1,19 | 3 258 | 50,76 | ||||
| 2025-08-05 | 13F | Advisors Preferred, LLC | 0 | −100,00 | 0 | |||||
| 2025-08-13 | 13F | EverSource Wealth Advisors, LLC | 7 058 | 0,92 | 351 | 50,21 | ||||
| 2025-07-24 | 13F | Jfs Wealth Advisors, Llc | 444 | 14,43 | 22 | 83,33 | ||||
| 2025-07-08 | 13F | Arlington Trust Co LLC | 219 | 0,00 | 11 | 42,86 | ||||
| 2025-07-24 | 13F | Us Bancorp \de\ | 41 310 | 9,10 | 2 054 | 62,63 | ||||
| 2025-08-12 | 13F | Pathstone Holdings, LLC | 21 850 | 27,49 | 1 087 | 89,86 | ||||
| 2025-08-12 | 13F | Coldstream Capital Management Inc | 10 373 | 577,53 | 516 | 909,80 | ||||
| 2025-08-08 | 13F | Geode Capital Management, Llc | 4 829 | 240 | ||||||
| 2025-08-14 | 13F/A | Skopos Labs, Inc. | 1 880 | 273,76 | 93 | 481,25 | ||||
| 2025-07-29 | NP | RBB FUND, INC. - Aquarius International Fund | 4 696 | 0,00 | 196 | 22,64 | ||||
| 2025-08-07 | 13F | Profund Advisors Llc | 5 160 | 257 | ||||||
| 2025-08-14 | 13F | Jane Street Group, Llc | 0 | −100,00 | 0 | |||||
| 2025-08-08 | 13F | Creative Planning | 261 811 | 25,83 | 13 020 | 87,46 | ||||
| 2025-08-14 | 13F | Wells Fargo & Company/mn | 483 | 24 | ||||||
| 2025-07-30 | 13F | Cullen/frost Bankers, Inc. | 0 | −100,00 | 0 | |||||
| 2025-05-16 | 13F | Coppell Advisory Solutions LLC | 0 | −100,00 | 0 | |||||
| 2025-06-26 | NP | DFEM - Dimensional Emerging Markets Core Equity 2 ETF | 11 270 | 0,00 | 418 | 13,32 | ||||
| 2025-08-14 | 13F | Goldman Sachs Group Inc | 41 848 | −19,79 | 2 081 | 19,53 | ||||
| 2025-08-01 | 13F | Envestnet Asset Management Inc | 8 143 | 8,57 | 405 | 61,60 | ||||
| 2025-07-28 | NP | NSI - National Security Emerging Markets Index ETF | 3 273 | 38,51 | 136 | 70,00 | ||||
| 2025-07-09 | 13F | Aaron Wealth Advisors LLC | 6 148 | 306 | ||||||
| 2025-08-11 | 13F | HighTower Advisors, LLC | 5 937 | −4,23 | 295 | 43,20 | ||||
| 2025-08-14 | 13F | Wetherby Asset Management Inc | 62 221 | 10,96 | 3 094 | 76,60 | ||||
| 2025-08-14 | 13F | Ancora Advisors, LLC | 150 | 0,00 | 7 | 40,00 | ||||
| 2025-08-04 | 13F | Spire Wealth Management | 0 | −100,00 | 0 | |||||
| 2025-07-30 | NP | APIE - ActivePassive International Equity ETF | 30 416 | 6,57 | 1 268 | 30,59 | ||||
| 2025-06-26 | NP | DFSE - Dimensional Emerging Markets Sustainability Core 1 ETF | 4 147 | 14,75 | 154 | 29,66 | ||||
| 2025-05-15 | 13F | CAPROCK Group, Inc. | 10 480 | −31,17 | 364 | −23,37 | ||||
| 2025-08-14 | 13F | Mercer Global Advisors Inc /adv | 8 583 | 4,94 | 427 | 56,04 | ||||
| 2025-07-14 | 13F | GAMMA Investing LLC | 3 894 | 59,52 | 194 | 138,27 | ||||
| 2025-08-13 | 13F | Guggenheim Capital Llc | 20 438 | 0,25 | 1 016 | 49,41 | ||||
| 2025-05-06 | 13F | Venturi Wealth Management, LLC | 0 | −100,00 | 0 | |||||
| 2025-08-05 | 13F | NewSquare Capital LLC | 380 | 155,03 | 19 | 350,00 | ||||
| 2025-08-14 | 13F | Ameriprise Financial Inc | 7 594 | −9,08 | 378 | 35,61 | ||||
| 2025-08-14 | 13F | Two Sigma Advisers, Lp | 0 | −100,00 | 0 | |||||
| 2025-07-23 | 13F | Optas, LLC | 0 | −100,00 | 0 | |||||
| 2025-08-13 | 13F | Bare Financial Services, Inc | 145 | 168,52 | 7 | 600,00 | ||||
| 2025-08-14 | 13F | Principal Street Partners, LLC | 6 900 | 343 | ||||||
| 2025-08-12 | 13F | SRS Capital Advisors, Inc. | 681 | 34 | ||||||
| 2025-08-15 | 13F | Tower Research Capital LLC (TRC) | 1 150 | 3 282,35 | 57 | 5 600,00 | ||||
| 2025-07-15 | 13F | Ballentine Partners, LLC | 40 994 | 23,48 | 2 039 | 83,94 | ||||
| 2025-08-11 | 13F | Citigroup Inc | 11 178 | 8,46 | 556 | 61,34 | ||||
| 2025-08-12 | 13F | BlackRock, Inc. | 2 057 241 | 7,33 | 102 307 | 59,91 | ||||
| 2025-08-14 | 13F | Bank Of America Corp /de/ | 98 209 | −27,97 | 4 884 | 7,30 | ||||
| 2025-08-27 | NP | RYWTX - Emerging Markets 2x Strategy Fund Class A | 1 172 | 154,23 | 58 | 286,67 | ||||
| 2025-07-28 | 13F | Ativo Capital Management LLC | 32 076 | −3,07 | 1 595 | 44,47 | ||||
| 2025-08-20 | NP | REMG - Emerging Markets Equity Active ETF | 2 485 | 124 | ||||||
| 2025-08-11 | 13F | B. Metzler seel. Sohn & Co. AG | 39 257 | 1,55 | 1 952 | 51,32 | ||||
| 2025-08-12 | 13F | Dimensional Fund Advisors Lp | 90 571 | 15,96 | 4 503 | 72,79 | ||||
| 2025-08-05 | 13F | Huntington National Bank | 9 | 0 | ||||||
| 2025-08-08 | 13F | Pnc Financial Services Group, Inc. | 19 055 | 13,70 | 948 | 69,41 | ||||
| 2025-08-13 | 13F | West Family Investments, Inc. | 17 614 | 42,85 | 876 | 112,90 | ||||
| 2025-07-24 | 13F | IFP Advisors, Inc | 99 | 37,50 | 5 | 100,00 | ||||
| 2025-08-13 | 13F | Russell Investments Group, Ltd. | 8 744 | 133,30 | 435 | 247,20 | ||||
| 2025-07-30 | 13F | Ethic Inc. | 105 012 | 9,15 | 5 150 | 57,99 | ||||
| 2025-05-02 | 13F | Cable Hill Partners, LLC | 8 813 | −8,59 | 327 | 8,31 | ||||
| 2025-07-16 | 13F | Highline Wealth Partners Llc | 91 | 62,50 | 5 | 300,00 | ||||
| 2025-08-15 | 13F | WealthCollab, LLC | 1 284 | 2,64 | 64 | 53,66 | ||||
| 2025-07-25 | 13F | Meritage Portfolio Management | 95 621 | −2,80 | 4 755 | 44,84 | ||||
| 2025-05-09 | 13F | R Squared Ltd | 0 | −100,00 | 0 | |||||
| 2025-07-14 | 13F | Abacus Wealth Partners, LLC | 7 469 | 0,21 | 371 | 49,60 | ||||
| 2025-08-14 | 13F | Lazard Asset Management Llc | 12 633 | 1 | ||||||
| 2025-08-26 | NP | Profunds - Profund Vp Emerging Markets | 3 760 | 14,01 | 187 | 69,09 | ||||
| 2025-07-30 | 13F | Drive Wealth Management, Llc | 4 811 | 239 | ||||||
| 2025-07-17 | 13F | Clean Yield Group | 100 | 0,00 | 5 | 33,33 | ||||
| 2025-08-12 | 13F | Trexquant Investment LP | 0 | −100,00 | 0 | |||||
| 2025-07-25 | 13F | Yousif Capital Management, Llc | 24 346 | 7,89 | 1 211 | 60,69 | ||||
| 2025-08-13 | 13F | Cerity Partners LLC | 66 279 | −2,82 | 3 296 | 44,82 | ||||
| 2025-08-13 | 13F | Marshall Wace, Llp | 0 | −100,00 | 0 | |||||
| 2025-08-12 | 13F | Rhumbline Advisers | 17 888 | −31,43 | 890 | 2,18 | ||||
| 2025-08-14 | 13F | Glenmede Investment Management, LP | 4 947 | 246 | ||||||
| 2025-06-26 | NP | DFAE - Dimensional Emerging Core Equity Market ETF | 31 007 | 45,81 | 1 149 | 65,32 | ||||
| 2025-07-18 | 13F | BSW Wealth Partners | 8 844 | 6,35 | 440 | 58,48 | ||||
| 2025-07-29 | 13F | Private Trust Co Na | 31 | 0,00 | 2 | 0,00 | ||||
| 2025-08-13 | 13F | Invesco Ltd. | 32 792 | −14,16 | 1 631 | 27,84 | ||||
| 2025-08-07 | 13F | Vise Technologies, Inc. | 15 057 | 749 | ||||||
| 2025-07-14 | 13F | UMA Financial Services, Inc. | 139 | 131,67 | 7 | 200,00 | ||||
| 2025-08-14 | 13F | Aprio Wealth Management, LLC | 11 420 | −1,57 | 568 | 46,51 | ||||
| 2025-07-28 | 13F | BRYN MAWR TRUST Co | 97 | 0,00 | 5 | 33,33 | ||||
| 2025-08-11 | 13F | Bell Investment Advisors, Inc | 357 | −22,39 | 18 | 13,33 | ||||
| 2025-08-07 | 13F | Acadian Asset Management Llc | 128 924 | 0,85 | 6 | 50,00 | ||||
| 2025-08-12 | 13F | Jpmorgan Chase & Co | 80 430 | 40,10 | 4 000 | 108,72 | ||||
| 2025-08-13 | 13F | Twin Peaks Wealth Advisors, LLC | 143 | 8 | ||||||
| 2025-08-13 | 13F | Natixis Advisors, L.p. | 25 050 | −6,08 | 1 | |||||
| 2025-08-14 | 13F | Two Sigma Investments, Lp | 12 458 | −56,02 | 620 | −34,50 | ||||
| 2025-08-13 | 13F | Northwestern Mutual Wealth Management Co | 172 | 9 | ||||||
| 2025-07-11 | 13F | Pinnacle Bancorp, Inc. | 65 | 3 | ||||||
| 2025-06-26 | NP | DFEV - Dimensional Emerging Markets Value ETF | 4 382 | −8,58 | 162 | 3,85 | ||||
| 2025-07-15 | 13F | Td Private Client Wealth Llc | 411 | 20,53 | 20 | 81,82 | ||||
| 2025-07-24 | 13F | PDS Planning, Inc | 13 440 | 1,36 | 668 | 51,13 | ||||
| 2025-08-08 | 13F | Crossmark Global Holdings, Inc. | 5 425 | 270 | ||||||
| 2025-07-23 | 13F | Canopy Partners, LLC | 6 071 | 0,58 | 302 | 49,75 | ||||
| 2025-07-29 | 13F | Wealthstream Advisors, Inc. | 5 224 | 260 | ||||||
| 2025-08-07 | 13F | Sierra Ocean, Llc | 298 | −2,30 | 15 | 40,00 | ||||
| 2025-07-08 | 13F | Rise Advisors, LLC | 28 | 833,33 | 1 | |||||
| 2025-08-13 | 13F | Renaissance Technologies Llc | 0 | −100,00 | 0 | |||||
| 2025-08-14 | 13F | Raymond James Financial Inc | 322 | 16 | ||||||
| 2025-07-17 | 13F | Greenleaf Trust | 7 102 | 0,98 | 353 | 50,85 | ||||
| 2025-07-17 | 13F | HB Wealth Management, LLC | 5 729 | 285 | ||||||
| 2025-04-21 | 13F | CWA Asset Management Group, LLC | 0 | −100,00 | 0 |
Other Listings
| DE:2WGA | € 45,80 |