Grunnleggende statistikk
| Institusjonelle eiere | 98 total, 97 long only, 0 short only, 1 long/short - change of −2,00% MRQ |
| Gjennomsnittlig porteføljeallokering | 0.1309 % - change of −14,64% MRQ |
| Institusjonelle aksjer (Long) | 4 338 248 (ex 13D/G) - change of −0,88MM shares −16,92% MRQ |
| Institusjonell verdi (Long) | $ 153 918 USD ($1000) |
Institusjonelt eierskap og aksjonærer
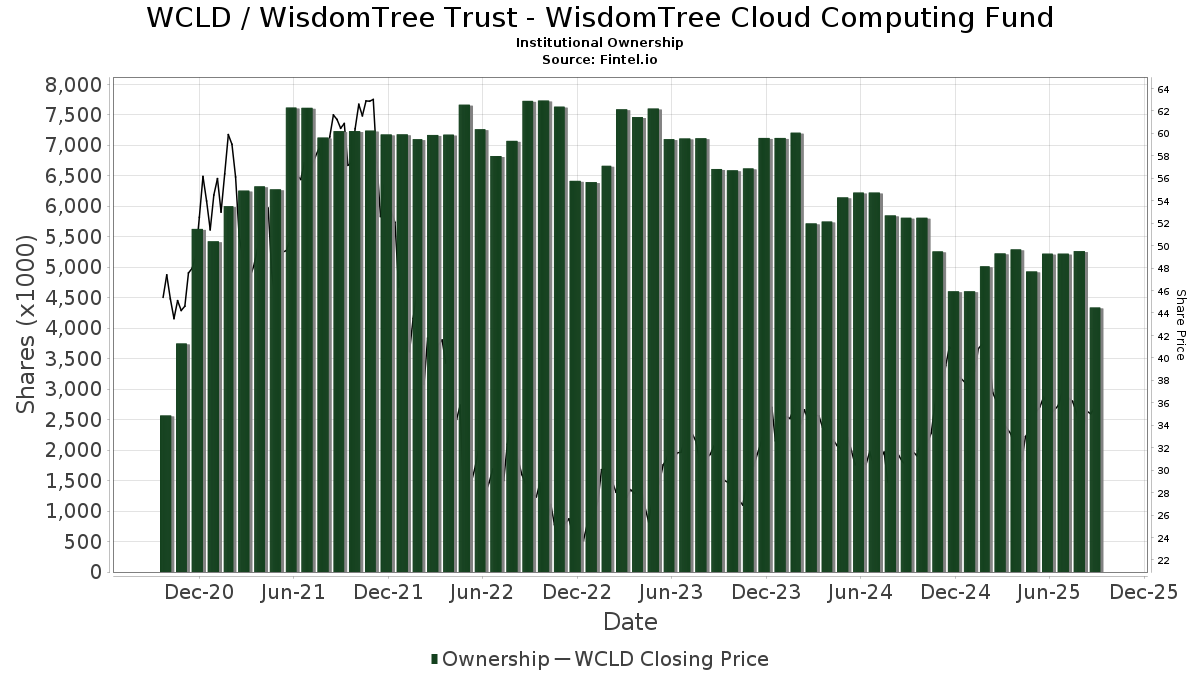
WisdomTree Trust - WisdomTree Cloud Computing Fund (US:WCLD) har 98 institusjonelle eiere og aksjonærer som har sendt inn 13D/G- eller 13F-skjemaer til Securities Exchange Commission (SEC). Disse institusjonene eier til sammen 4,338,248 aksjer. De største aksjonærene inkluderer RMB Capital Management, LLC, Endurance Services Ltd, Selective Wealth Management, Inc., Morgan Stanley, Jpmorgan Chase & Co, Clearwater Capital Advisors, LLC, Ieq Capital, Llc, Summit Trail Advisors, Llc, Raymond James Financial Inc, and Yarbrough Capital, LLC .
WisdomTree Trust - WisdomTree Cloud Computing Fund (NasdaqGM:WCLD) institusjonell eierstruktur viser nåværende posisjoner i selskapet fordelt på institusjoner og fond, samt de siste endringene i posisjonsstørrelse. De største aksjonærene kan være individuelle investorer, verdipapirfond, hedgefond eller institusjoner. Schedule 13D indikerer at investoren eier (eller har eid) mer enn 5 % av selskapet og har til hensikt (eller hadde til hensikt) å aktivt forfølge en endring i forretningsstrategien. Schedule 13G indikerer en passiv investering på over 5 %.
The share price as of September 10, 2025 is 35,47 / share. Previously, on September 11, 2024, the share price was 30,46 / share. This represents an increase of 16,45% over that period.
Fondssentiment-score
Fondssentiment Score (også kjent som akkumulering av eierskap poengsum) viser hvilke aksjer som er mest kjøpt av fond. Den er resultatet av en sofistikert, kvantitativ flerfaktormodell som identifiserer selskaper med de høyeste nivåene av institusjonell akkumulering. Beregningsmodellen for poeng bruker en kombinasjon av den totale økningen i antall offentliggjorte eiere, endringer i porteføljeallokeringen til disse eierne og andre beregninger. Tallet går fra 0 til 100, der høyere tall indikerer en høyere grad av akkumulering i forhold til sammenlignbare selskaper, der 50 er gjennomsnittet.
Oppdateringsfrekvens: Daglig
Sjekk ut Ownership Explorer, som inneholder en liste over de høyest rangerte selskapene.
Institusjonell Put/Call-forhold
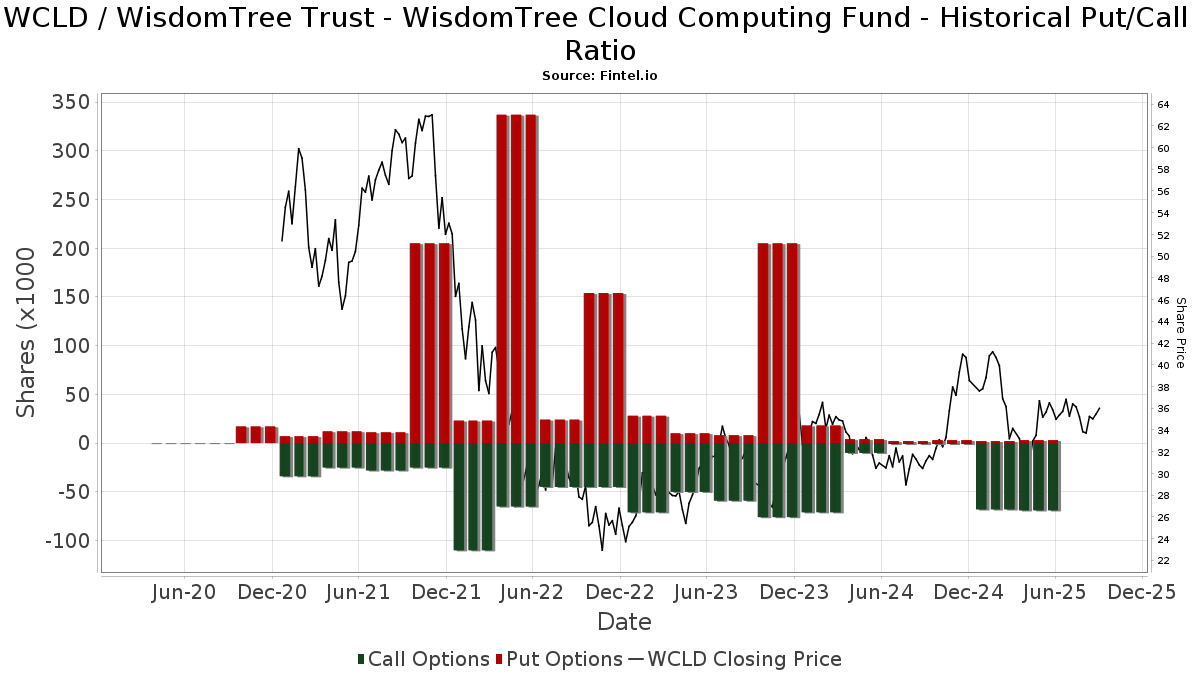
I tillegg til å rapportere standard aksje- og gjeldsemisjoner må institusjoner med mer enn 100 millioner kroner i forvaltningskapital også oppgi beholdningen av put- og callopsjoner. Siden put-opsjoner generelt indikerer et negativt sentiment, og call-opsjoner indikerer et positivt sentiment, kan vi få et inntrykk av det generelle institusjonelle sentimentet ved å plotte forholdet mellom put- og call-opsjoner. Diagrammet til høyre viser det historiske forholdet mellom put- og call-opsjoner for dette instrumentet.
Ved å bruke Put/Call-forholdet som en indikator på investorsentimentet kan man overvinne en av de viktigste svakhetene ved å bruke totalt institusjonelt eierskap, nemlig at en betydelig andel av forvaltningskapitalen investeres passivt for å følge indekser. Passivt forvaltede fond kjøper vanligvis ikke opsjoner, slik at indikatoren for put/call-forhold i større grad gjenspeiler stemningen i aktivt forvaltede fond.
13F- og NPORT-arkiveringer
Detaljer om 13F-arkiveringer er gratis. Detaljer om NP-arkiveringer krever et premium-medlemskap. Grønne rader indikerer nye posisjoner. Røde rader indikerer lukkede posisjoner. Klikk på lenke ikonet for å se hele transaksjonshistorikken.
Oppgrader
for å låse opp premiedata og eksportere til Excel. ![]() .
.
| Fildato | Kilde | Investor | Type | Gjennomsnittlig pris (estimert) |
Aksjer | Δ Aksjer (%) |
Rapportert verdi ($1000) | Verdi (%) | Portallokering (%) | |
|---|---|---|---|---|---|---|---|---|---|---|
| 2025-08-14 | 13F | Susquehanna International Group, Llp | Call | 69 800 | 4,80 | 2 523 | 16,71 | |||
| 2025-07-10 | 13F | Cypress Point Wealth Management, LLC | 9 795 | 0,00 | 354 | 11,36 | ||||
| 2025-08-14 | 13F | Susquehanna International Group, Llp | 10 130 | −38,55 | 366 | −31,46 | ||||
| 2025-07-24 | 13F | Costello Asset Management, INC | 213 | 0,00 | 8 | 16,67 | ||||
| 2025-04-09 | 13F | Milestone Asset Management, Llc | 0 | −100,00 | 0 | |||||
| 2025-08-15 | 13F | Tower Research Capital LLC (TRC) | 8 306 | 300 | ||||||
| 2025-07-25 | 13F | Lodestar Private Asset Management Llc | 8 843 | −47,83 | 320 | −41,89 | ||||
| 2025-08-14 | 13F | Banque Transatlantique SA | 0 | −100,00 | 0 | |||||
| 2025-07-11 | 13F | First PREMIER Bank | 664 | −52,02 | 0 | |||||
| 2025-08-12 | 13F | Marshall & Sterling Wealth Advisors Inc. | 44 | 0,00 | 2 | 0,00 | ||||
| 2025-07-22 | 13F | Team Financial Group, LLC | 105 | 4 | ||||||
| 2025-07-28 | 13F | Frazier Financial Advisors, LLC | 168 | 0,00 | 6 | 20,00 | ||||
| 2025-07-28 | 13F | Fairman Group, LLC | 1 560 | 0,00 | 56 | −57,25 | ||||
| 2025-08-14 | 13F | Royal Bank Of Canada | 36 071 | 25,06 | 1 303 | 39,21 | ||||
| 2025-08-14 | 13F | Smartleaf Asset Management LLC | 4 428 | 17,30 | 158 | 26,61 | ||||
| 2025-08-14 | 13F | Ieq Capital, Llc | 199 456 | −3,10 | 7 208 | 7,92 | ||||
| 2025-07-22 | 13F | Grimes & Company, Inc. | 6 824 | 0,00 | 247 | 11,31 | ||||
| 2025-08-04 | 13F | Creative Financial Designs Inc /adv | 5 600 | 85,43 | 202 | 108,25 | ||||
| 2025-08-13 | 13F | Flow Traders U.s. Llc | 24 619 | 1 | ||||||
| 2025-08-05 | 13F | Ceera Investments, Llc | 7 091 | 0,00 | 256 | 11,30 | ||||
| 2025-05-28 | 13F | Intrua Financial, LLC | 0 | −100,00 | 0 | −100,00 | ||||
| 2025-08-06 | 13F | AE Wealth Management LLC | 59 | 0,00 | 2 | 100,00 | ||||
| 2025-08-12 | 13F | O'shaughnessy Asset Management, Llc | 0 | −100,00 | 0 | |||||
| 2025-08-14 | 13F | Two Sigma Securities, Llc | 6 038 | 218 | ||||||
| 2025-07-15 | 13F | Armis Advisers, LLC | 14 492 | −2,16 | 524 | 8,96 | ||||
| 2025-08-29 | 13F | Evolution Wealth Management Inc. | 162 | 6 | ||||||
| 2025-08-05 | 13F | Bank Of Montreal /can/ | 186 | −67,76 | 7 | −66,67 | ||||
| 2025-08-11 | 13F | Y.D. More Investments Ltd | 5 251 | 32,90 | 190 | 47,66 | ||||
| 2025-08-12 | 13F | Stelac Advisory Services LLC | 0 | −100,00 | 0 | |||||
| 2025-08-14 | 13F | Raymond James Financial Inc | Put | 3 500 | 123 | |||||
| 2025-05-09 | 13F | Washington Growth Strategies Llc | 0 | −100,00 | 0 | |||||
| 2025-07-29 | 13F | Ballast, Inc. | 33 955 | 1 227 | ||||||
| 2025-08-14 | 13F | Raymond James Financial Inc | 165 762 | 4,20 | 5 991 | 16,04 | ||||
| 2025-08-05 | 13F | GPS Wealth Strategies Group, LLC | 567 | 0,00 | 20 | 11,11 | ||||
| 2025-08-14 | 13F | Citadel Advisors Llc | Call | 0 | −100,00 | 0 | ||||
| 2025-07-11 | 13F | Farther Finance Advisors, LLC | 280 | 0,00 | 10 | 11,11 | ||||
| 2025-08-12 | 13F | PSI Advisors, LLC | 0 | −100,00 | 0 | |||||
| 2025-08-12 | 13F | SRS Capital Advisors, Inc. | 14 725 | 9,68 | 532 | 22,30 | ||||
| 2025-05-15 | 13F | Hrt Financial Lp | 0 | −100,00 | 0 | |||||
| 2025-07-17 | 13F | Halbert Hargrove Global Advisors, Llc | 5 372 | 0,00 | 194 | 11,49 | ||||
| 2025-08-19 | 13F | Asset Dedication, LLC | 399 | 0,00 | 14 | 16,67 | ||||
| 2025-08-14 | 13F | Federation des caisses Desjardins du Quebec | 5 | 0,00 | 0 | |||||
| 2025-08-12 | 13F | Clearwater Capital Advisors, LLC | 205 870 | 10,73 | 7 440 | 23,34 | ||||
| 2025-08-14 | 13F | Citadel Advisors Llc | 27 920 | 917,49 | 1 009 | 1 033,71 | ||||
| 2025-08-12 | 13F | Franklin Resources Inc | 14 253 | −1,08 | 515 | 10,28 | ||||
| 2025-08-14 | 13F | Stifel Financial Corp | 30 969 | 9,68 | 1 119 | 22,16 | ||||
| 2025-05-15 | 13F | Gts Securities Llc | 0 | −100,00 | 0 | |||||
| 2025-07-07 | 13F | First Community Trust Na | 13 310 | 0,00 | 481 | 11,60 | ||||
| 2025-08-06 | 13F | Commonwealth Equity Services, Llc | 9 773 | −17,12 | 0 | |||||
| 2025-04-16 | 13F | Wealth Enhancement Advisory Services, Llc | 0 | −100,00 | 0 | |||||
| 2025-08-15 | 13F | Morgan Stanley | 249 934 | −58,90 | 9 033 | −54,22 | ||||
| 2025-08-14 | 13F | UBS Group AG | 151 497 | −75,98 | 5 475 | −73,25 | ||||
| 2025-07-02 | 13F | HBW Advisory Services LLC | 0 | −100,00 | 0 | |||||
| 2025-07-15 | 13F | Graypoint LLC | 8 078 | 0,00 | 292 | 11,07 | ||||
| 2025-05-12 | 13F | Meitav Dash Investments Ltd | 0 | −100,00 | 0 | −100,00 | ||||
| 2025-04-17 | 13F | Robertson Stephens Wealth Management, LLC | 0 | −100,00 | 0 | |||||
| 2025-08-08 | 13F | Thrive Capital Management, LLC | 0 | −100,00 | 0 | |||||
| 2025-08-11 | 13F | Private Advisor Group, LLC | 7 458 | −3,24 | 270 | 7,60 | ||||
| 2025-08-12 | 13F | Steward Partners Investment Advisory, Llc | 100 | 0,00 | 4 | 0,00 | ||||
| 2025-08-14 | 13F | Glen Eagle Advisors, LLC | 33 | −85,84 | 1 | −85,71 | ||||
| 2025-08-08 | 13F | Hartland & Co., LLC | 25 | 0,00 | 1 | |||||
| 2025-07-24 | 13F | Blair William & Co/il | 7 195 | −0,69 | 260 | 10,64 | ||||
| 2025-07-14 | 13F | Opal Wealth Advisors, LLC | 5 634 | 44,02 | 204 | 61,11 | ||||
| 2025-08-12 | 13F | Horizon Financial Services, Llc | 283 | 10 | ||||||
| 2025-08-13 | 13F | Continuum Advisory, LLC | 0 | −100,00 | 0 | −100,00 | ||||
| 2025-04-11 | 13F | Insight Advisors, LLC/ PA | 0 | −100,00 | 0 | |||||
| 2025-07-15 | 13F | Financial Management Professionals, Inc. | 1 | 0 | ||||||
| 2025-07-25 | 13F | Cwm, Llc | 15 176 | 3,10 | 1 | |||||
| 2025-08-14 | 13F | Fmr Llc | 3 126 | −24,36 | 113 | −16,42 | ||||
| 2025-07-16 | 13F | Perigon Wealth Management, LLC | 12 160 | −42,02 | 439 | −35,44 | ||||
| 2025-08-12 | 13F | Jpmorgan Chase & Co | 227 808 | −0,16 | 8 233 | 11,20 | ||||
| 2025-08-13 | 13F | Twin Peaks Wealth Advisors, LLC | 8 044 | 2,88 | 265 | 9,54 | ||||
| 2025-08-13 | 13F | Oxler Private Wealth LLC | 9 701 | 0,00 | 351 | 11,46 | ||||
| 2025-08-12 | 13F | Global Retirement Partners, LLC | 350 | 250,00 | 13 | 300,00 | ||||
| 2025-08-11 | 13F | Banque Cantonale Vaudoise | 3 354 | −49,99 | 0 | |||||
| 2025-07-15 | 13F | North Star Investment Management Corp. | 1 625 | 59 | ||||||
| 2025-04-22 | 13F/A | NorthRock Partners, LLC | 0 | −100,00 | 0 | |||||
| 2025-08-14 | 13F | Boston Private Wealth Llc | 0 | −100,00 | 0 | |||||
| 2025-05-15 | 13F | Schonfeld Strategic Advisors LLC | 0 | −100,00 | 0 | |||||
| 2025-08-14 | 13F | RMB Capital Management, LLC | 598 972 | 13,53 | 21 647 | 26,44 | ||||
| 2025-04-28 | 13F | Vontobel Holding Ltd. | 0 | −100,00 | 0 | |||||
| 2025-08-14 | 13F | Bank Of America Corp /de/ | 36 397 | −80,91 | 1 315 | −78,74 | ||||
| 2025-08-14 | 13F | Citadel Advisors Llc | Put | 0 | −100,00 | 0 | ||||
| 2025-08-13 | 13F | PineBridge Investments, L.P. | 26 364 | −14,16 | 953 | −4,42 | ||||
| 2025-08-14 | 13F | Cubist Systematic Strategies, LLC | 14 412 | 521 | ||||||
| 2025-07-31 | 13F | Cambridge Investment Research Advisors, Inc. | 14 717 | −9,20 | 1 | |||||
| 2025-07-31 | 13F | Wealthfront Advisers Llc | 61 892 | 0,75 | 2 237 | 12,19 | ||||
| 2025-08-11 | 13F | HighTower Advisors, LLC | 23 050 | −17,83 | 833 | −8,46 | ||||
| 2025-09-04 | 13F/A | Advisor Group Holdings, Inc. | 9 092 | 17,30 | 329 | 30,68 | ||||
| 2025-04-09 | 13F | Merit Financial Group, LLC | 0 | −100,00 | 0 | −100,00 | ||||
| 2025-08-14 | 13F | Byrne Financial Freedom, Llc | 94 900 | 1,38 | 3 430 | 12,91 | ||||
| 2025-08-14 | 13F | Integrated Wealth Concepts LLC | 0 | −100,00 | 0 | |||||
| 2025-05-16 | 13F | Bell Investment Advisors, Inc | 0 | −100,00 | 0 | |||||
| 2025-08-12 | 13F | MAI Capital Management | 416 | 0,00 | 15 | 15,38 | ||||
| 2025-08-14 | 13F | Qube Research & Technologies Ltd | 17 361 | −62,84 | 627 | −58,64 | ||||
| 2025-08-08 | 13F | Larson Financial Group LLC | 5 915 | −4,83 | 214 | 5,97 | ||||
| 2025-07-22 | 13F | Old National Bancorp /in/ | 129 055 | 4 664 | ||||||
| 2025-07-15 | 13F | Yarbrough Capital, LLC | 165 470 | 0,00 | 5 980 | 11,38 | ||||
| 2025-07-15 | 13F | StoneCrest Wealth Management, Inc. | 0 | −100,00 | 0 | |||||
| 2025-07-28 | 13F | Harbour Investments, Inc. | 2 805 | 0,00 | 101 | 10,99 | ||||
| 2025-04-10 | 13F | Bremer Bank National Association | 129 055 | 0,00 | 4 188 | −13,53 | ||||
| 2025-08-13 | 13F | Northwestern Mutual Wealth Management Co | 2 779 | 0,00 | 100 | 11,11 | ||||
| 2025-07-10 | 13F | Selective Wealth Management, Inc. | 295 066 | −2,87 | 10 861 | 17,07 | ||||
| 2025-08-14 | 13F | Comerica Bank | 30 | 0,00 | 1 | |||||
| 2025-08-08 | 13F | Cetera Investment Advisers | 30 380 | −10,37 | 1 098 | −0,18 | ||||
| 2025-08-14 | 13F | Ameriprise Financial Inc | 0 | −100,00 | 0 | |||||
| 2025-08-13 | 13F | Cerity Partners LLC | 16 194 | −3,76 | 585 | 7,14 | ||||
| 2025-07-07 | 13F | Versant Capital Management, Inc | 400 | 0,00 | 14 | 16,67 | ||||
| 2025-08-14 | 13F | Two Sigma Investments, Lp | 155 486 | 5 619 | ||||||
| 2025-04-23 | 13F | Mascagni Wealth Management, Inc. | 0 | −100,00 | 0 | −100,00 | ||||
| 2025-08-04 | 13F | Joseph P. Lucia & Associates, LLC | 33 955 | −5,31 | 1 227 | 5,50 | ||||
| 2025-07-03 | 13F | Garde Capital, Inc. | 0 | −100,00 | 0 | |||||
| 2025-08-12 | 13F | Founders Financial Alliance, LLC | 0 | −100,00 | 0 | |||||
| 2025-05-16 | 13F | Coppell Advisory Solutions LLC | 0 | −100,00 | 0 | |||||
| 2025-04-21 | 13F | Ronald Blue Trust, Inc. | 0 | −100,00 | 0 | |||||
| 2025-08-14 | 13F | Wells Fargo & Company/mn | 30 922 | 2,93 | 1 118 | 14,68 | ||||
| 2025-07-22 | 13F | Carolina Wealth Advisors, LLC | 442 | 18,82 | 16 | 25,00 | ||||
| 2025-08-12 | 13F | Proequities, Inc. | Put | 0 | 0 | |||||
| 2025-07-24 | 13F | IFP Advisors, Inc | 225 | 0,00 | 8 | 14,29 | ||||
| 2025-07-08 | 13F | Parallel Advisors, LLC | 1 286 | −15,84 | 46 | −6,12 | ||||
| 2025-04-25 | 13F | Stonebridge Financial Group, LLC | 0 | −100,00 | 0 | |||||
| 2025-08-13 | 13F/A | StoneX Group Inc. | 9 279 | 323 | ||||||
| 2025-08-11 | 13F | Citigroup Inc | 0 | −100,00 | 0 | |||||
| 2025-04-18 | 13F | Wolf Group Capital Advisors | 7 411 | −37,59 | 240 | −36,17 | ||||
| 2025-08-13 | 13F | Congress Wealth Management LLC / DE / | 13 366 | 483 | ||||||
| 2025-07-25 | 13F | Endowment Wealth Management, Inc. | 8 309 | 26,93 | 300 | 41,51 | ||||
| 2025-05-09 | 13F | Pnc Financial Services Group, Inc. | 0 | −100,00 | 0 | |||||
| 2025-08-14 | 13F | Summit Trail Advisors, Llc | 178 271 | −37,43 | 6 443 | −30,32 | ||||
| 2025-08-14 | 13F | Endurance Services Ltd | 354 500 | 0,00 | 12 812 | 11,37 | ||||
| 2025-08-11 | 13F | SFI Advisors, LLC | 14 509 | −1,70 | 524 | 9,62 | ||||
| 2025-08-13 | 13F | Marshall Wace, Llp | 26 605 | 152,80 | 962 | 181,82 | ||||
| 2025-08-12 | 13F | LPL Financial LLC | 83 492 | −10,27 | 3 017 | −0,07 | ||||
| 2025-04-25 | 13F | Albion Financial Group /ut | 0 | −100,00 | 0 | |||||
| 2025-07-18 | 13F | O'ROURKE & COMPANY, Inc | 6 744 | −18,38 | 244 | −9,33 | ||||
| 2025-05-14 | 13F | Legend Financial Advisors, Inc. | 0 | −100,00 | 0 | |||||
| 2025-08-14 | 13F | Goldman Sachs Group Inc | 86 173 | 31,23 | 3 114 | 46,20 | ||||
| 2025-08-19 | 13F | Advisory Services Network, LLC | 9 198 | 5,28 | 322 | 13,43 | ||||
| 2025-08-13 | 13F | Sumitomo Mitsui Financial Group, Inc. | 58 506 | −19,28 | 2 114 | −10,12 |
Other Listings
| MX:WCLD |