Grunnleggende statistikk
| Institusjonelle eiere | 112 total, 108 long only, 0 short only, 4 long/short - change of 0,00% MRQ |
| Gjennomsnittlig porteføljeallokering | 0.0202 % - change of −21,07% MRQ |
| Institusjonelle aksjer (Long) | 17 382 945 (ex 13D/G) - change of 1,08MM shares 6,61% MRQ |
| Institusjonell verdi (Long) | $ 75 419 USD ($1000) |
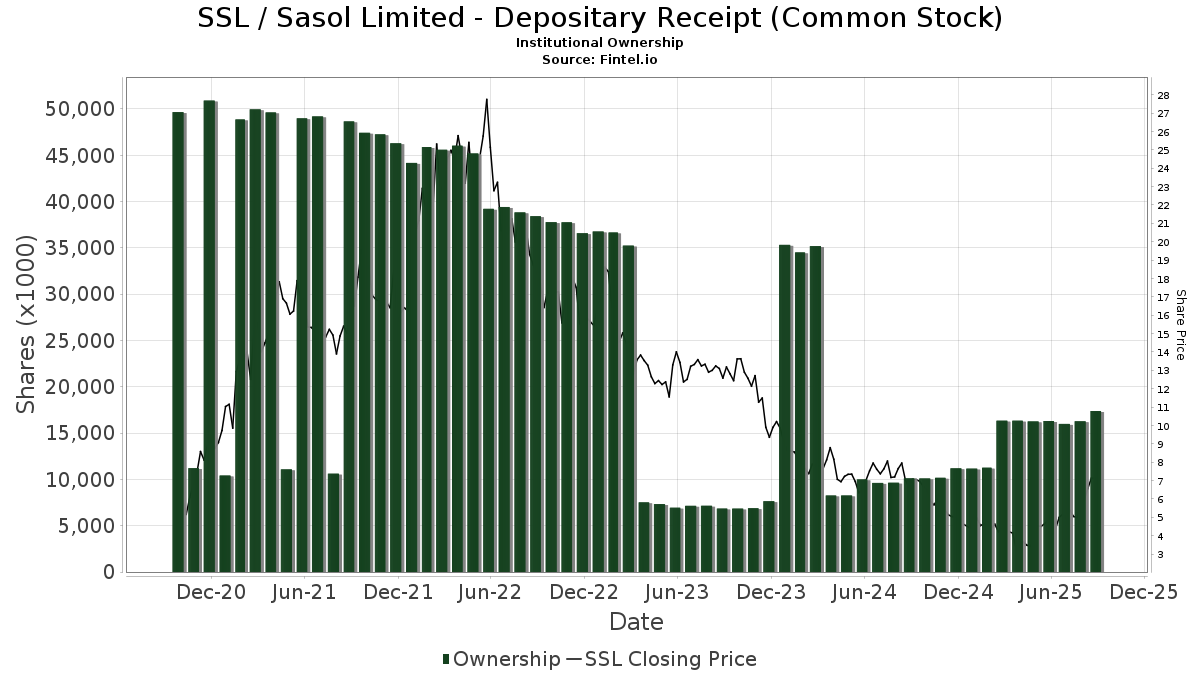
Institusjonelt eierskap og aksjonærer
Sasol Limited - Depositary Receipt (Common Stock) (US:SSL) har 112 institusjonelle eiere og aksjonærer som har sendt inn 13D/G- eller 13F-skjemaer til Securities Exchange Commission (SEC). Disse institusjonene eier til sammen 17,382,945 aksjer. De største aksjonærene inkluderer Morgan Stanley, BlackRock, Inc., Two Sigma Investments, Lp, Two Sigma Advisers, Lp, American Century Companies Inc, Goldman Sachs Group Inc, Connor, Clark & Lunn Investment Management Ltd., AVEM - Avantis Emerging Markets Equity ETF, Dimensional Fund Advisors Lp, and UBS Group AG .
Sasol Limited - Depositary Receipt (Common Stock) (NYSE:SSL) institusjonell eierstruktur viser nåværende posisjoner i selskapet fordelt på institusjoner og fond, samt de siste endringene i posisjonsstørrelse. De største aksjonærene kan være individuelle investorer, verdipapirfond, hedgefond eller institusjoner. Schedule 13D indikerer at investoren eier (eller har eid) mer enn 5 % av selskapet og har til hensikt (eller hadde til hensikt) å aktivt forfølge en endring i forretningsstrategien. Schedule 13G indikerer en passiv investering på over 5 %.
The share price as of September 9, 2025 is 6,89 / share. Previously, on September 10, 2024, the share price was 6,80 / share. This represents an increase of 1,32% over that period.
Fondssentiment-score
Fondssentiment Score (også kjent som akkumulering av eierskap poengsum) viser hvilke aksjer som er mest kjøpt av fond. Den er resultatet av en sofistikert, kvantitativ flerfaktormodell som identifiserer selskaper med de høyeste nivåene av institusjonell akkumulering. Beregningsmodellen for poeng bruker en kombinasjon av den totale økningen i antall offentliggjorte eiere, endringer i porteføljeallokeringen til disse eierne og andre beregninger. Tallet går fra 0 til 100, der høyere tall indikerer en høyere grad av akkumulering i forhold til sammenlignbare selskaper, der 50 er gjennomsnittet.
Oppdateringsfrekvens: Daglig
Sjekk ut Ownership Explorer, som inneholder en liste over de høyest rangerte selskapene.
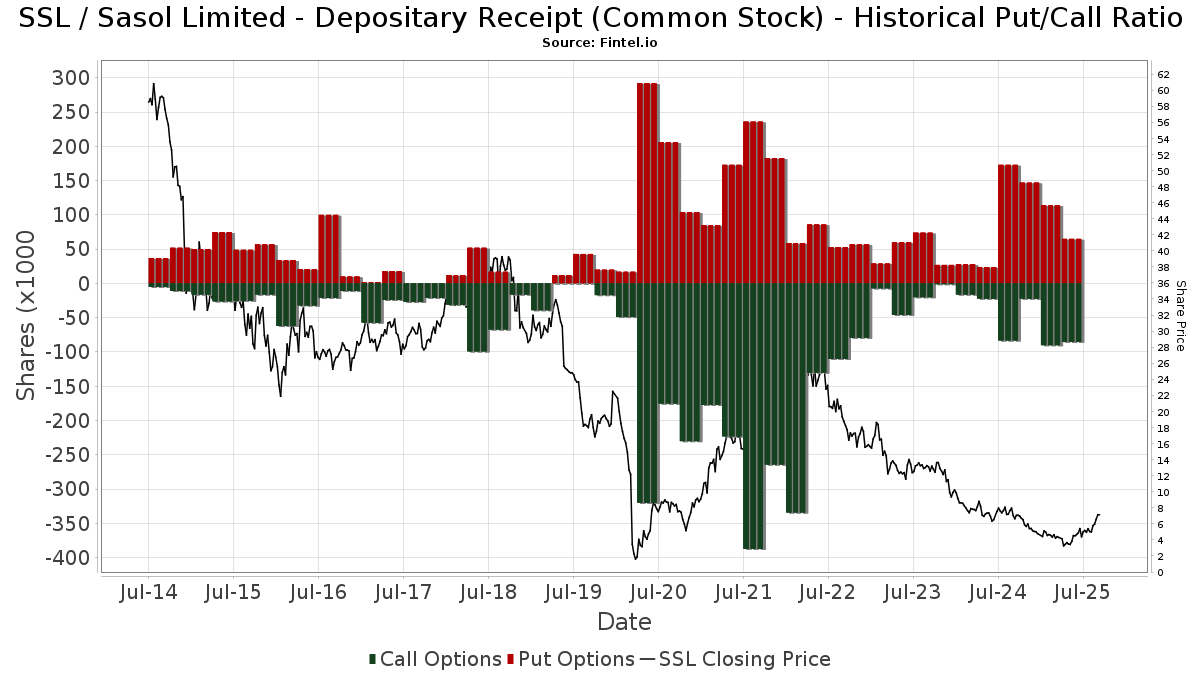
Institusjonell Put/Call-forhold
I tillegg til å rapportere standard aksje- og gjeldsemisjoner må institusjoner med mer enn 100 millioner kroner i forvaltningskapital også oppgi beholdningen av put- og callopsjoner. Siden put-opsjoner generelt indikerer et negativt sentiment, og call-opsjoner indikerer et positivt sentiment, kan vi få et inntrykk av det generelle institusjonelle sentimentet ved å plotte forholdet mellom put- og call-opsjoner. Diagrammet til høyre viser det historiske forholdet mellom put- og call-opsjoner for dette instrumentet.
Ved å bruke Put/Call-forholdet som en indikator på investorsentimentet kan man overvinne en av de viktigste svakhetene ved å bruke totalt institusjonelt eierskap, nemlig at en betydelig andel av forvaltningskapitalen investeres passivt for å følge indekser. Passivt forvaltede fond kjøper vanligvis ikke opsjoner, slik at indikatoren for put/call-forhold i større grad gjenspeiler stemningen i aktivt forvaltede fond.
13F- og NPORT-arkiveringer
Detaljer om 13F-arkiveringer er gratis. Detaljer om NP-arkiveringer krever et premium-medlemskap. Grønne rader indikerer nye posisjoner. Røde rader indikerer lukkede posisjoner. Klikk på lenke ikonet for å se hele transaksjonshistorikken.
Oppgrader
for å låse opp premiedata og eksportere til Excel. ![]() .
.
| Fildato | Kilde | Investor | Type | Gjennomsnittlig pris (estimert) |
Aksjer | Δ Aksjer (%) |
Rapportert verdi ($1000) | Verdi (%) | Portallokering (%) | |
|---|---|---|---|---|---|---|---|---|---|---|
| 2025-07-28 | NP | AVEEX - Avantis Emerging Markets Equity Fund Institutional Class This fund is a listed as child fund of American Century Companies Inc and if that institution has disclosed ownership in this security, then these positions will not be double counted when calculating total shares and total value | 26 634 | 0,00 | 118 | 1,72 | ||||
| 2025-06-26 | NP | DFA INVESTMENT DIMENSIONS GROUP INC - World ex U.S. Core Equity Portfolio Institutional Class Shares | 20 702 | 0,00 | 72 | −25,77 | ||||
| 2025-08-06 | 13F | Savant Capital, LLC | 36 116 | 160 | ||||||
| 2025-08-14 | 13F | Raymond James Financial Inc | 9 484 | −20,33 | 42 | −18,00 | ||||
| 2025-07-08 | 13F | Parallel Advisors, LLC | 17 169 | 119,86 | 76 | 127,27 | ||||
| 2025-08-08 | 13F | Abc Arbitrage Sa | 188 436 | 833 | ||||||
| 2025-08-14 | 13F | Evergreen Capital Management Llc | 23 166 | 102 | ||||||
| 2025-05-05 | 13F | Lindbrook Capital, Llc | 3 168 | −55,96 | 13 | −59,37 | ||||
| 2025-08-14 | 13F | UBS Group AG | 631 731 | −14,31 | 2 792 | −10,46 | ||||
| 2025-08-12 | 13F | XTX Topco Ltd | 0 | −100,00 | 0 | |||||
| 2025-08-13 | 13F | Guggenheim Capital Llc | 19 861 | −5,68 | 88 | −2,25 | ||||
| 2025-04-30 | 13F | Nisa Investment Advisors, Llc | 0 | −100,00 | 0 | |||||
| 2025-08-14 | 13F | Royal Bank Of Canada | 15 936 | −8,13 | 71 | −2,74 | ||||
| 2025-05-15 | 13F | Pinnacle Wealth Planning Services, Inc. | 0 | −100,00 | 0 | |||||
| 2025-08-12 | 13F | Jpmorgan Chase & Co | 59 395 | 7 081,98 | 263 | 8 633,33 | ||||
| 2025-07-25 | 13F | Cwm, Llc | 1 727 | −69,44 | 0 | |||||
| 2025-08-14 | 13F | Two Sigma Securities, Llc | 0 | −100,00 | 0 | |||||
| 2025-07-28 | NP | AVEM - Avantis Emerging Markets Equity ETF This fund is a listed as child fund of American Century Companies Inc and if that institution has disclosed ownership in this security, then these positions will not be double counted when calculating total shares and total value | 735 074 | 26,23 | 3 264 | 28,26 | ||||
| 2025-08-14 | 13F | Bnp Paribas Arbitrage, Sa | 221 995 | 210,48 | 981 | 224,83 | ||||
| 2025-08-08 | 13F | SG Americas Securities, LLC | 76 763 | 0 | ||||||
| 2025-05-08 | 13F | Essential Planning, LLC. | 0 | −100,00 | 0 | |||||
| 2025-08-12 | 13F | Pacer Advisors, Inc. | 142 633 | 128,96 | 635 | 144,79 | ||||
| 2025-08-14 | 13F | Bank Of America Corp /de/ | 537 250 | 206,17 | 2 375 | 219,95 | ||||
| 2025-08-15 | 13F | CI Private Wealth, LLC | 20 740 | −31,20 | 92 | −28,35 | ||||
| 2025-07-14 | 13F | UMA Financial Services, Inc. | 211 | 37,91 | 1 | |||||
| 2025-08-12 | 13F | American Century Companies Inc | 890 502 | 25,48 | 3 936 | 31,16 | ||||
| 2025-08-12 | 13F | Dimensional Fund Advisors Lp | 724 589 | −26,13 | 3 203 | −22,79 | ||||
| 2025-08-13 | 13F | Jump Financial, LLC | 388 598 | 211,33 | 1 718 | 225,81 | ||||
| 2025-08-14 | 13F | Sunbelt Securities, Inc. | 99 | 0,00 | 0 | |||||
| 2025-07-22 | 13F | Net Worth Advisory Group | 21 611 | 5,12 | 96 | 10,47 | ||||
| 2025-04-24 | 13F | PDS Planning, Inc | 0 | −100,00 | 0 | |||||
| 2025-08-12 | 13F | Skopos Labs, Inc. | 2 184 | 0,00 | 9 | 0,00 | ||||
| 2025-08-13 | 13F | Cerity Partners LLC | 43 002 | −25,03 | 190 | −21,49 | ||||
| 2025-05-15 | 13F | Point72 Hong Kong Ltd | 0 | −100,00 | 0 | −100,00 | ||||
| 2025-08-14 | 13F | Group One Trading, L.p. | 9 426 | −47,47 | 42 | −45,33 | ||||
| 2025-08-07 | 13F | Allworth Financial LP | 3 213 | 205,71 | 14 | 366,67 | ||||
| 2025-08-14 | 13F | Mariner, LLC | 206 154 | 236,03 | 911 | 251,74 | ||||
| 2025-08-14 | 13F | Group One Trading, L.p. | Put | 7 200 | −61,08 | 32 | −60,26 | |||
| 2025-08-14 | 13F | Sei Investments Co | 0 | −100,00 | 0 | |||||
| 2025-08-14 | 13F | Group One Trading, L.p. | Call | 10 200 | 920,00 | 45 | 1 025,00 | |||
| 2025-08-15 | 13F | Morgan Stanley | 3 089 253 | 39,02 | 13 655 | 45,27 | ||||
| 2025-08-15 | 13F | Tower Research Capital LLC (TRC) | 5 566 | −46,96 | 25 | −45,45 | ||||
| 2025-08-12 | 13F | Aigen Investment Management, Lp | 0 | −100,00 | 0 | |||||
| 2025-06-26 | NP | Dfa Investment Trust Co - The Emerging Markets Series This fund is a listed as child fund of Dimensional Fund Advisors Lp and if that institution has disclosed ownership in this security, then these positions will not be double counted when calculating total shares and total value | 305 779 | −19,24 | 1 064 | −40,19 | ||||
| 2025-08-11 | 13F | Bell Investment Advisors, Inc | 70 | 0,00 | 0 | |||||
| 2025-07-21 | 13F | Qrg Capital Management, Inc. | 22 781 | 11,33 | 101 | 16,28 | ||||
| 2025-08-08 | 13F | Creative Planning | 246 324 | 157,03 | 1 089 | 168,64 | ||||
| 2025-08-14 | 13F | GWM Advisors LLC | 18 814 | 47,57 | 83 | 56,60 | ||||
| 2025-08-14 | 13F | Point72 Asset Management, L.P. | 512 500 | 23,44 | 2 265 | 28,99 | ||||
| 2025-08-14 | 13F | Wells Fargo & Company/mn | 10 533 | 37,61 | 47 | 43,75 | ||||
| 2025-08-13 | 13F | Walleye Capital LLC | 0 | −100,00 | 0 | −100,00 | ||||
| 2025-07-28 | NP | AVXC - Avantis Emerging Markets ex-China Equity ETF | 6 939 | 37,43 | 31 | 36,36 | ||||
| 2025-08-08 | 13F | SBI Securities Co., Ltd. | 12 852 | 2,87 | 57 | 7,69 | ||||
| 2025-08-14 | 13F | Millennium Management Llc | 32 510 | −97,76 | 144 | −97,67 | ||||
| 2025-05-06 | 13F | Advisors Preferred, LLC | 0 | −100,00 | 0 | |||||
| 2025-07-08 | 13F | Northwest & Ethical Investments L.P. | 0 | −100,00 | 0 | |||||
| 2025-08-13 | 13F | First Trust Advisors Lp | 14 155 | −5,15 | 63 | −1,59 | ||||
| 2025-08-07 | 13F | Connor, Clark & Lunn Investment Management Ltd. | 767 312 | 11,93 | 3 392 | 16,97 | ||||
| 2025-08-14 | 13F | Quartz Partners, LLC | 14 504 | 8,01 | 64 | 14,29 | ||||
| 2025-08-14 | 13F | Aqr Capital Management Llc | 22 987 | 102 | ||||||
| 2025-07-24 | 13F | Ronald Blue Trust, Inc. | 13 245 | −23,12 | 59 | −19,44 | ||||
| 2025-05-15 | 13F | Verition Fund Management LLC | 0 | −100,00 | 0 | −100,00 | ||||
| 2025-05-15 | 13F | Jain Global LLC | 0 | −100,00 | 0 | |||||
| 2025-08-14 | 13F | Susquehanna International Group, Llp | Put | 36 200 | −41,33 | 160 | −38,46 | |||
| 2025-08-14 | 13F | Susquehanna International Group, Llp | 11 756 | −93,96 | 52 | −93,80 | ||||
| 2025-08-12 | 13F | Coldstream Capital Management Inc | 0 | −100,00 | 0 | |||||
| 2025-08-12 | 13F | Pathstone Holdings, LLC | 31 049 | −3,90 | 137 | 0,74 | ||||
| 2025-08-14 | 13F | Susquehanna International Group, Llp | Call | 25 100 | 42,61 | 111 | 48,65 | |||
| 2025-08-12 | 13F | Proequities, Inc. | Put | 0 | 0 | |||||
| 2025-08-13 | 13F | Quadrant Capital Group Llc | 152 631 | 264,80 | 675 | 282,95 | ||||
| 2025-06-30 | NP | CAFRX - Africa Fund | 4 000 | 0,00 | 14 | −27,78 | ||||
| 2025-08-12 | 13F | Proequities, Inc. | Call | 0 | 0 | |||||
| 2025-05-05 | 13F | Creekmur Asset Management LLC | 0 | −100,00 | 0 | |||||
| 2025-08-11 | 13F | Private Advisor Group, LLC | 41 939 | 75,82 | 185 | 85,00 | ||||
| 2025-08-12 | 13F | Proequities, Inc. | 0 | 0 | ||||||
| 2025-08-08 | 13F | Gts Securities Llc | 29 088 | 129 | ||||||
| 2025-07-24 | 13F | Us Bancorp \de\ | 23 635 | 14,71 | 104 | 19,54 | ||||
| 2025-07-25 | 13F | JustInvest LLC | 34 523 | −25,37 | 153 | −22,05 | ||||
| 2025-08-12 | 13F | BlackRock, Inc. | 2 011 911 | 55,03 | 8 893 | 62,00 | ||||
| 2025-08-12 | 13F | Trexquant Investment LP | 0 | −100,00 | 0 | |||||
| 2025-07-30 | NP | APIE - ActivePassive International Equity ETF | 54 732 | 64,07 | 243 | 67,59 | ||||
| 2025-07-16 | 13F | Signaturefd, Llc | 26 790 | 137,54 | 118 | 151,06 | ||||
| 2025-08-12 | 13F | LPL Financial LLC | 129 340 | 121,80 | 572 | 132,11 | ||||
| 2025-08-13 | 13F | Centiva Capital, LP | 0 | −100,00 | 0 | |||||
| 2025-08-13 | 13F | Northern Trust Corp | 162 406 | 0,95 | 718 | 5,44 | ||||
| 2025-08-14 | 13F | Van Eck Associates Corp | 1 176 | −28,34 | 0 | |||||
| 2025-07-14 | 13F | GAMMA Investing LLC | 4 155 | 231,08 | 18 | 260,00 | ||||
| 2025-08-21 | NP | AFK - VanEck Vectors Africa Index ETF | 28 350 | −1,12 | 125 | 3,31 | ||||
| 2025-08-13 | 13F | Barclays Plc | 0 | −100,00 | 0 | |||||
| 2025-08-11 | 13F | Principal Securities, Inc. | 167 | 221,15 | 1 | |||||
| 2025-07-24 | 13F | Jfs Wealth Advisors, Llc | 271 | 1 | ||||||
| 2025-08-14 | 13F | D. E. Shaw & Co., Inc. | 202 856 | −54,32 | 897 | −52,29 | ||||
| 2025-08-14 | 13F | Ariadne Wealth Management, LP | 11 772 | 68 | ||||||
| 2025-07-28 | NP | AVES - Avantis Emerging Markets Value ETF This fund is a listed as child fund of American Century Companies Inc and if that institution has disclosed ownership in this security, then these positions will not be double counted when calculating total shares and total value | 83 985 | 14,17 | 373 | 15,89 | ||||
| 2025-08-14 | 13F | Goldman Sachs Group Inc | 862 405 | 575,68 | 3 812 | 607,05 | ||||
| 2025-08-14 | 13F | Jane Street Group, Llc | 281 722 | 82,11 | 1 245 | 90,37 | ||||
| 2025-05-02 | 13F | Pzena Investment Management Llc | 0 | −100,00 | 0 | |||||
| 2025-05-14 | 13F | EntryPoint Capital, LLC | 0 | −100,00 | 0 | |||||
| 2025-08-12 | 13F | Rhumbline Advisers | 6 235 | −9,57 | 28 | −6,90 | ||||
| 2025-05-15 | 13F | Engineers Gate Manager LP | 0 | −100,00 | 0 | |||||
| 2025-07-18 | 13F | Generali Investments CEE, investicni spolecnost, a.s. | 367 196 | 0,00 | 1 623 | 4,51 | ||||
| 2025-07-25 | 13F | Sequoia Financial Advisors, LLC | 13 875 | 8,47 | 61 | 12,96 | ||||
| 2025-08-14 | 13F | Banco BTG Pactual S.A. | 20 000 | 88 | ||||||
| 2025-08-14 | 13F | Two Sigma Investments, Lp | 1 004 589 | −33,71 | 4 440 | −30,73 | ||||
| 2025-08-14 | 13F | Wetherby Asset Management Inc | 31 130 | −0,16 | 138 | −3,52 | ||||
| 2025-08-11 | 13F | Brown Brothers Harriman & Co | 435 | 2 | ||||||
| 2025-08-14 | 13F | Vident Advisory, LLC | 59 417 | −17,00 | 263 | −13,25 | ||||
| 2025-08-13 | 13F | Renaissance Technologies Llc | 393 800 | −8,84 | 1 741 | −4,76 | ||||
| 2025-08-14 | 13F | Ieq Capital, Llc | 13 580 | 60 | ||||||
| 2025-08-06 | 13F | True Wealth Design, LLC | 43 | −15,69 | 0 | |||||
| 2025-07-15 | 13F | Public Employees Retirement System Of Ohio | 95 728 | 15,87 | 423 | 21,20 | ||||
| 2025-07-09 | 13F | Sivia Capital Partners, LLC | 11 699 | 52 | ||||||
| 2025-08-11 | 13F | Citigroup Inc | 122 476 | 138,37 | 541 | 149,31 | ||||
| 2025-05-13 | 13F | HighTower Advisors, LLC | 0 | −100,00 | 0 | |||||
| 2025-07-30 | 13F | FNY Investment Advisers, LLC | 203 310 | 1 | ||||||
| 2025-05-12 | 13F | Greenwich Wealth Management LLC | 0 | −100,00 | 0 | |||||
| 2025-08-04 | 13F | Hantz Financial Services, Inc. | 0 | −100,00 | 0 | |||||
| 2025-08-08 | 13F | Pnc Financial Services Group, Inc. | 11 518 | 0,18 | 51 | 4,17 | ||||
| 2025-08-14 | 13F | Cubist Systematic Strategies, LLC | 285 377 | 39,36 | 1 261 | 45,61 | ||||
| 2025-08-12 | 13F | Virtu Financial LLC | 27 237 | 46,78 | 0 | |||||
| 2025-08-14 | 13F | Fmr Llc | 17 956 | −57,54 | 79 | −55,62 | ||||
| 2025-06-26 | NP | DFCEX - Emerging Markets Core Equity Portfolio - Institutional Class This fund is a listed as child fund of Dimensional Fund Advisors Lp and if that institution has disclosed ownership in this security, then these positions will not be double counted when calculating total shares and total value | 508 321 | 0,00 | 1 769 | −25,99 | ||||
| 2025-07-11 | 13F | Farther Finance Advisors, LLC | 691 | 230,62 | 3 | |||||
| 2025-07-25 | 13F | Apollon Wealth Management, LLC | 0 | −100,00 | 0 | |||||
| 2025-06-02 | 13F/A | Deutsche Bank Ag\ | 0 | −100,00 | 0 | |||||
| 2025-08-13 | 13F | FORA Capital, LLC | 0 | −100,00 | 0 | |||||
| 2025-08-14 | 13F | Schonfeld Strategic Advisors LLC | 0 | −100,00 | 0 | |||||
| 2025-07-14 | 13F | Abound Wealth Management | 26 | 0,00 | 0 | |||||
| 2025-08-05 | 13F | Simplex Trading, Llc | Call | 16 600 | −57,44 | 0 | ||||
| 2025-08-14 | 13F | Banque Transatlantique SA | 0 | −100,00 | 0 | |||||
| 2025-09-04 | 13F/A | Advisor Group Holdings, Inc. | 4 839 | −14,03 | 21 | −8,70 | ||||
| 2025-07-31 | 13F | Caitong International Asset Management Co., Ltd | 997 | 100,20 | 4 | 100,00 | ||||
| 2025-08-04 | 13F | Assetmark, Inc | 101 | 0 | ||||||
| 2025-08-07 | 13F | Sierra Ocean, Llc | 1 230 | 86,08 | 5 | 150,00 | ||||
| 2025-08-05 | 13F | Simplex Trading, Llc | Put | 100 | −99,39 | 0 | ||||
| 2025-08-05 | 13F | Simplex Trading, Llc | 2 676 | −76,74 | 0 | |||||
| 2025-08-15 | 13F | WealthCollab, LLC | 0 | −100,00 | 0 | |||||
| 2025-08-07 | 13F | Parkside Financial Bank & Trust | 406 | 2 | ||||||
| 2025-08-13 | 13F | EverSource Wealth Advisors, LLC | 8 960 | 347,33 | 40 | 387,50 | ||||
| 2025-07-28 | NP | VCGEX - Emerging Economies Fund | 20 550 | −79,64 | 91 | −80,00 | ||||
| 2025-07-15 | 13F | Ballentine Partners, LLC | 19 572 | 47,28 | 87 | 53,57 | ||||
| 2025-08-14 | 13F | Citadel Advisors Llc | 85 777 | −51,42 | 379 | −49,20 | ||||
| 2025-05-30 | NP | FRDM - Freedom 100 Emerging Markets ETF | 0 | −100,00 | 0 | −100,00 | ||||
| 2025-08-14 | 13F | Citadel Advisors Llc | Put | 22 000 | 24,29 | 97 | 31,08 | |||
| 2025-08-14 | 13F | Integrated Wealth Concepts LLC | 60 514 | 267 | ||||||
| 2025-04-23 | 13F | Legacy Advisors, LLC | 0 | −100,00 | 0 | |||||
| 2025-08-12 | 13F | MAI Capital Management | 2 652 | 12 | ||||||
| 2025-08-14 | 13F | Citadel Advisors Llc | Call | 33 200 | 1,84 | 147 | 6,57 | |||
| 2025-08-14 | 13F | Stifel Financial Corp | 264 506 | 1 169 | ||||||
| 2025-05-14 | 13F | Ameriprise Financial Inc | 0 | −100,00 | 0 | −100,00 | ||||
| 2025-08-14 | 13F | Barometer Capital Management Inc. | 51 821 | 5,93 | 229 | 11,17 | ||||
| 2025-08-14 | 13F | Two Sigma Advisers, Lp | 932 800 | −25,12 | 4 123 | −21,77 | ||||
| 2025-07-21 | 13F | Ameriflex Group, Inc. | 400 | −82,61 | 2 | −88,89 | ||||
| 2025-08-14 | 13F | Federation des caisses Desjardins du Quebec | 700 | −22,22 | 3 | 0,00 | ||||
| 2025-08-14 | 13F | Balyasny Asset Management Llc | 28 262 | −51,21 | 125 | −49,39 | ||||
| 2025-08-13 | 13F | Northwestern Mutual Wealth Management Co | 1 172 | 5 | ||||||
| 2025-08-19 | 13F | Asset Dedication, LLC | 0 | −100,00 | 0 | |||||
| 2025-08-12 | 13F | O'shaughnessy Asset Management, Llc | 0 | −100,00 | 0 | |||||
| 2025-07-28 | NP | NSI - National Security Emerging Markets Index ETF | 16 514 | 38,49 | 73 | 40,38 | ||||
| 2025-07-24 | 13F | IFP Advisors, Inc | 0 | −100,00 | 0 |
Other Listings
| DE:SAO | € 6,15 |