Grunnleggende statistikk
| Institusjonelle eiere | 93 total, 93 long only, 0 short only, 0 long/short - change of 3,33% MRQ |
| Gjennomsnittlig porteføljeallokering | 0.2603 % - change of −10,98% MRQ |
| Institusjonelle aksjer (Long) | 791 368 (ex 13D/G) - change of 0,02MM shares 2,69% MRQ |
| Institusjonell verdi (Long) | $ 84 391 USD ($1000) |
Institusjonelt eierskap og aksjonærer
SPDR Series Trust - SPDR SSGA US Small Cap Low Volatility Index ETF (US:SMLV) har 93 institusjonelle eiere og aksjonærer som har sendt inn 13D/G- eller 13F-skjemaer til Securities Exchange Commission (SEC). Disse institusjonene eier til sammen 791,368 aksjer. De største aksjonærene inkluderer Congress Wealth Management LLC / DE /, LPL Financial LLC, DORVAL Corp, Cambridge Investment Research Advisors, Inc., Ieq Capital, Llc, Aqr Capital Management Llc, Ameriprise Financial Inc, Commonwealth Equity Services, Llc, McNaughton Wealth Management, LLC, and Susquehanna International Group, Llp .
SPDR Series Trust - SPDR SSGA US Small Cap Low Volatility Index ETF (ARCA:SMLV) institusjonell eierstruktur viser nåværende posisjoner i selskapet fordelt på institusjoner og fond, samt de siste endringene i posisjonsstørrelse. De største aksjonærene kan være individuelle investorer, verdipapirfond, hedgefond eller institusjoner. Schedule 13D indikerer at investoren eier (eller har eid) mer enn 5 % av selskapet og har til hensikt (eller hadde til hensikt) å aktivt forfølge en endring i forretningsstrategien. Schedule 13G indikerer en passiv investering på over 5 %.
The share price as of September 9, 2025 is 131,88 / share. Previously, on September 10, 2024, the share price was 121,31 / share. This represents an increase of 8,72% over that period.

Fondssentiment-score
Fondssentiment Score (også kjent som akkumulering av eierskap poengsum) viser hvilke aksjer som er mest kjøpt av fond. Den er resultatet av en sofistikert, kvantitativ flerfaktormodell som identifiserer selskaper med de høyeste nivåene av institusjonell akkumulering. Beregningsmodellen for poeng bruker en kombinasjon av den totale økningen i antall offentliggjorte eiere, endringer i porteføljeallokeringen til disse eierne og andre beregninger. Tallet går fra 0 til 100, der høyere tall indikerer en høyere grad av akkumulering i forhold til sammenlignbare selskaper, der 50 er gjennomsnittet.
Oppdateringsfrekvens: Daglig
Sjekk ut Ownership Explorer, som inneholder en liste over de høyest rangerte selskapene.
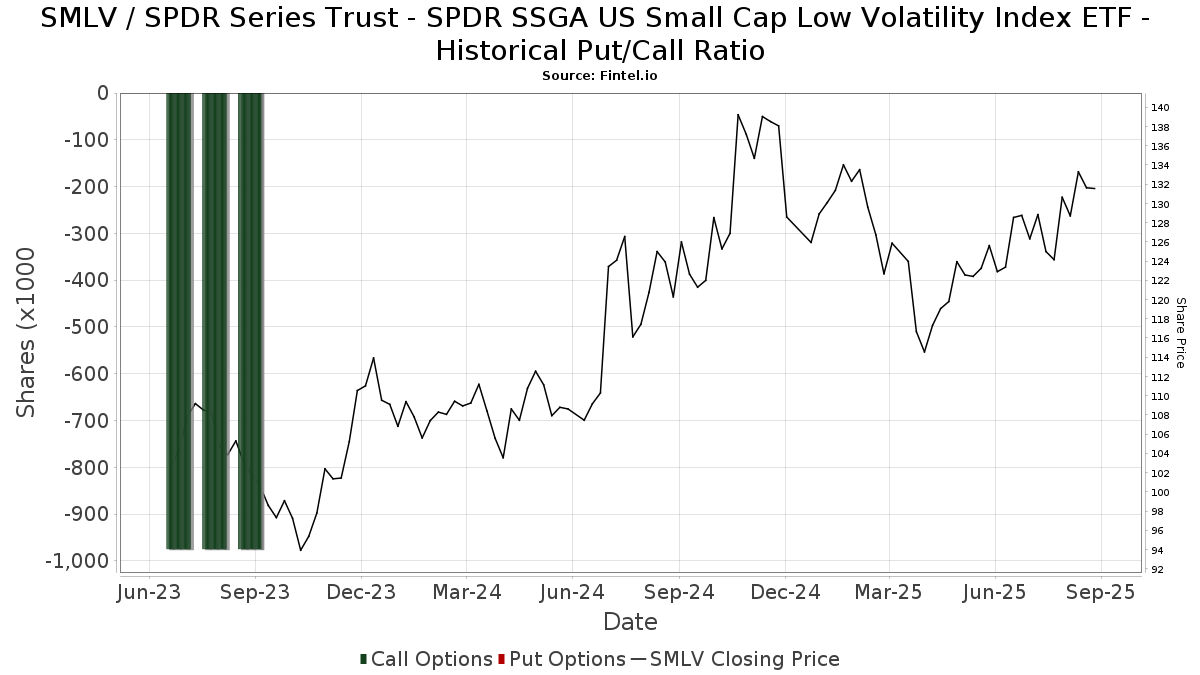
Institusjonell Put/Call-forhold
I tillegg til å rapportere standard aksje- og gjeldsemisjoner må institusjoner med mer enn 100 millioner kroner i forvaltningskapital også oppgi beholdningen av put- og callopsjoner. Siden put-opsjoner generelt indikerer et negativt sentiment, og call-opsjoner indikerer et positivt sentiment, kan vi få et inntrykk av det generelle institusjonelle sentimentet ved å plotte forholdet mellom put- og call-opsjoner. Diagrammet til høyre viser det historiske forholdet mellom put- og call-opsjoner for dette instrumentet.
Ved å bruke Put/Call-forholdet som en indikator på investorsentimentet kan man overvinne en av de viktigste svakhetene ved å bruke totalt institusjonelt eierskap, nemlig at en betydelig andel av forvaltningskapitalen investeres passivt for å følge indekser. Passivt forvaltede fond kjøper vanligvis ikke opsjoner, slik at indikatoren for put/call-forhold i større grad gjenspeiler stemningen i aktivt forvaltede fond.
13F- og NPORT-arkiveringer
Detaljer om 13F-arkiveringer er gratis. Detaljer om NP-arkiveringer krever et premium-medlemskap. Grønne rader indikerer nye posisjoner. Røde rader indikerer lukkede posisjoner. Klikk på lenke ikonet for å se hele transaksjonshistorikken.
Oppgrader
for å låse opp premiedata og eksportere til Excel. ![]() .
.
| Fildato | Kilde | Investor | Type | Gjennomsnittlig pris (estimert) |
Aksjer | Δ Aksjer (%) |
Rapportert verdi ($1000) | Verdi (%) | Portallokering (%) | |
|---|---|---|---|---|---|---|---|---|---|---|
| 2025-07-31 | 13F | Sage Mountain Advisors LLC | 452 | 0,00 | 57 | 1,82 | ||||
| 2025-08-15 | 13F | Equitable Holdings, Inc. | 0 | −100,00 | 0 | |||||
| 2025-08-06 | 13F | Commonwealth Equity Services, Llc | 24 821 | −21,58 | 3 | 0,00 | ||||
| 2025-05-12 | 13F | Jpmorgan Chase & Co | 0 | −100,00 | 0 | −100,00 | ||||
| 2025-08-14 | 13F | Bank Of America Corp /de/ | 13 562 | 10,05 | 1 697 | 12,02 | ||||
| 2025-07-10 | 13F | High Net Worth Advisory Group LLC | 1 870 | −1,84 | 234 | −0,43 | ||||
| 2025-08-07 | 13F | Winthrop Capital Management, LLC | 142 | −4,70 | 0 | |||||
| 2025-04-21 | 13F | PSI Advisors, LLC | 0 | −100,00 | 0 | |||||
| 2025-08-12 | 13F | Proequities, Inc. | 0 | 0 | ||||||
| 2025-07-29 | 13F | Portland Financial Advisors Inc | 4 215 | 0,00 | 527 | 1,93 | ||||
| 2025-08-01 | 13F | Envestnet Asset Management Inc | 17 287 | −6,19 | 2 163 | −4,51 | ||||
| 2025-08-11 | 13F | United Capital Financial Advisers, Llc | 5 786 | −1,93 | 724 | −0,14 | ||||
| 2025-05-08 | 13F | Plante Moran Financial Advisors, LLC | 0 | −100,00 | 0 | |||||
| 2025-07-30 | 13F | Insight Advisors, LLC/ PA | 8 480 | −3,89 | 1 061 | −2,21 | ||||
| 2025-08-14 | 13F | Ieq Capital, Llc | 56 025 | 0,00 | 7 009 | 1,82 | ||||
| 2025-08-14 | 13F | Sunbelt Securities, Inc. | 10 | 0,00 | 1 | 0,00 | ||||
| 2025-08-14 | 13F | UBS Group AG | 10 285 | 1,50 | 1 287 | 3,29 | ||||
| 2025-07-29 | 13F | Stratos Wealth Partners, LTD. | 4 056 | 2,81 | 508 | 4,75 | ||||
| 2025-07-25 | 13F | Cwm, Llc | 0 | −100,00 | 0 | |||||
| 2025-08-14 | 13F | Ausdal Financial Partners, Inc. | 3 985 | 0,66 | 499 | 2,47 | ||||
| 2025-07-31 | 13F | Cambridge Investment Research Advisors, Inc. | 64 889 | 4,75 | 8 | 14,29 | ||||
| 2025-08-12 | 13F | Jaffetilchin Investment Partners, LLC | 2 979 | 0,27 | 373 | 1,92 | ||||
| 2025-07-14 | 13F | Painted Porch Advisors LLC | 115 | 0,88 | 14 | 0,00 | ||||
| 2025-08-13 | 13F | Summit Wealth Group Llc / Co | 4 493 | 562 | ||||||
| 2025-06-24 | NP | TNQIX - 1290 Retirement 2055 Fund Class I | 744 | 0,00 | 89 | −9,28 | ||||
| 2025-08-14 | 13F | Ameriprise Financial Inc | 36 642 | 1,82 | 4 584 | 3,69 | ||||
| 2025-08-08 | 13F | Avantax Advisory Services, Inc. | 11 001 | −2,14 | 1 376 | −0,36 | ||||
| 2025-08-18 | 13F | N.E.W. Advisory Services LLC | 113 | 0,89 | 14 | 7,69 | ||||
| 2025-08-04 | 13F | Spire Wealth Management | 37 | −77,16 | 5 | −78,95 | ||||
| 2025-07-09 | 13F | Fragasso Group Inc. | 2 909 | 364 | ||||||
| 2025-08-06 | 13F | AE Wealth Management LLC | 69 | 0,00 | 9 | 0,00 | ||||
| 2025-08-11 | 13F | Citigroup Inc | 6 100 | 0,15 | 763 | 2,01 | ||||
| 2025-07-16 | 13F | Swisher Financial Concepts, Inc. | 2 541 | 7,90 | 318 | 9,69 | ||||
| 2025-07-30 | 13F | Pacific Sun Financial Corp | 6 194 | −6,77 | 775 | −5,15 | ||||
| 2025-08-14 | 13F | Goldman Sachs Group Inc | 7 702 | 0,00 | 964 | 1,80 | ||||
| 2025-07-24 | 13F | Us Bancorp \de\ | 8 | 0,00 | 1 | |||||
| 2025-06-24 | NP | TNWIX - 1290 Retirement 2050 Fund Class I | 726 | 0,00 | 86 | −9,47 | ||||
| 2025-08-15 | 13F | Morgan Stanley | 10 664 | 6,45 | 1 334 | 8,46 | ||||
| 2025-08-12 | 13F | Steward Partners Investment Advisory, Llc | 720 | 0,00 | 90 | 2,27 | ||||
| 2025-08-11 | 13F | Western Wealth Management, LLC | 2 015 | 0,05 | 252 | 2,02 | ||||
| 2025-08-13 | 13F | Jones Financial Companies Lllp | 5 513 | 86,00 | 690 | 89,29 | ||||
| 2025-08-12 | 13F | CIBC Private Wealth Group, LLC | 1 400 | 0,00 | 175 | 13,64 | ||||
| 2025-09-04 | 13F/A | Advisor Group Holdings, Inc. | 5 118 | 16,93 | 641 | 19,14 | ||||
| 2025-07-22 | 13F | Valley National Advisers Inc | 191 | 0,00 | 0 | |||||
| 2025-06-24 | NP | TNIIX - 1290 Retirement 2020 Fund Class I | 85 | 0,00 | 10 | −9,09 | ||||
| 2025-05-15 | 13F | Capstone Investment Advisors, Llc | 0 | −100,00 | 0 | |||||
| 2025-07-24 | 13F | IFP Advisors, Inc | 1 052 | 0,00 | 132 | 1,55 | ||||
| 2025-07-17 | 13F | Johnson & White Wealth Management, LLC | 13 361 | 3,29 | 2 | 0,00 | ||||
| 2025-08-14 | 13F | IHT Wealth Management, LLC | 1 991 | 0,61 | 249 | 2,47 | ||||
| 2025-07-10 | 13F | HF Advisory Group, LLC | 7 289 | −1,21 | 912 | 0,55 | ||||
| 2025-07-28 | 13F | DORVAL Corp | 74 202 | 4,19 | 9 284 | −0,42 | ||||
| 2025-06-24 | NP | TNLIX - 1290 Retirement 2035 Fund Class I | 270 | 0,00 | 32 | −8,57 | ||||
| 2025-08-04 | 13F | Assetmark, Inc | 165 | 21 | ||||||
| 2025-08-14 | 13F | Warren Averett Asset Management, LLC | 2 545 | −9,53 | 318 | −7,83 | ||||
| 2025-07-29 | 13F | Signature Estate & Investment Advisors Llc | 1 602 | 200 | ||||||
| 2025-08-06 | 13F | Savant Capital, LLC | 6 255 | −6,88 | 783 | −5,21 | ||||
| 2025-07-23 | 13F | Dohj, Llc | 2 555 | −0,04 | 300 | −4,78 | ||||
| 2025-08-12 | 13F | O'shaughnessy Asset Management, Llc | 480 | 0,00 | 60 | 3,45 | ||||
| 2025-07-09 | 13F | Reyes Financial Architecture, Inc. | 100 | 0,00 | 13 | 0,00 | ||||
| 2025-07-17 | 13F | Vermillion Wealth Management, Inc. | 112 | 0,90 | 14 | 0,00 | ||||
| 2025-07-08 | 13F | Nbc Securities, Inc. | 110 | 0,00 | 0 | |||||
| 2025-08-11 | 13F | Principal Securities, Inc. | 629 | 1,94 | 79 | 0,00 | ||||
| 2025-08-13 | 13F | Capital Analysts, Inc. | 2 974 | −41,88 | 0 | |||||
| 2025-07-28 | 13F | Harbour Investments, Inc. | 66 | 0,00 | 8 | 0,00 | ||||
| 2025-08-14 | 13F | Aqr Capital Management Llc | 46 571 | 0,00 | 5 827 | 1,82 | ||||
| 2025-08-12 | 13F | Cowa, Llc | 7 387 | 4,51 | 924 | 6,45 | ||||
| 2025-07-22 | 13F | McNaughton Wealth Management, LLC | 23 417 | 1,96 | 2 930 | 3,79 | ||||
| 2025-08-08 | 13F | Cornerstone Advisors Asset Management, Inc | 0 | −100,00 | 0 | |||||
| 2025-07-14 | 13F | AdvisorNet Financial, Inc | 383 | 0,79 | 48 | 2,17 | ||||
| 2025-08-13 | 13F | Navis Wealth Advisors, LLC | 6 050 | 0,67 | 757 | 2,44 | ||||
| 2025-08-13 | 13F | Beacon Pointe Advisors, LLC | 4 391 | −12,95 | 549 | −11,31 | ||||
| 2025-08-13 | 13F | IAG Wealth Partners, LLC | 13 280 | −5,05 | 1 662 | −3,32 | ||||
| 2025-08-13 | 13F | Continuum Advisory, LLC | 2 272 | 0,53 | 284 | 2,53 | ||||
| 2025-08-11 | 13F | HighTower Advisors, LLC | 3 846 | 0,65 | 481 | 2,56 | ||||
| 2025-08-11 | 13F | Tidemark, LLC | 162 | 0,00 | 20 | 5,26 | ||||
| 2025-06-24 | NP | TNKIX - 1290 Retirement 2030 Fund Class I | 227 | 0,00 | 27 | −6,90 | ||||
| 2025-08-14 | 13F | GWM Advisors LLC | 5 762 | 16,08 | 721 | 18,23 | ||||
| 2025-07-15 | 13F | McAdam, LLC | 2 988 | 5,55 | 374 | 7,49 | ||||
| 2025-06-24 | NP | TNJIX - 1290 Retirement 2025 Fund Class I | 19 | −5,00 | 2 | 0,00 | ||||
| 2025-08-11 | 13F | Private Advisor Group, LLC | 1 924 | −48,36 | 241 | −47,48 | ||||
| 2025-08-08 | 13F | Capital Investment Advisory Services, LLC | 67 | 0,00 | 8 | 0,00 | ||||
| 2025-06-24 | NP | TNOIX - 1290 Retirement 2045 Fund Class I | 654 | 0,00 | 78 | −9,41 | ||||
| 2025-08-14 | 13F | Two Sigma Investments, Lp | 7 400 | −28,85 | 926 | −27,56 | ||||
| 2025-08-14 | 13F | Wells Fargo & Company/mn | 89 | −31,01 | 11 | −26,67 | ||||
| 2025-08-08 | 13F | Cetera Investment Advisers | 8 225 | 44,81 | 1 029 | 47,49 | ||||
| 2025-08-12 | 13F | LPL Financial LLC | 75 092 | 25,27 | 9 395 | 27,55 | ||||
| 2025-07-30 | 13F | Strategic Blueprint, LLC | 3 110 | 0,00 | 389 | 1,83 | ||||
| 2025-08-05 | 13F | Roffman Miller Associates Inc /pa/ | 2 932 | 0,55 | 367 | 2,23 | ||||
| 2025-08-14 | 13F | Royal Bank Of Canada | 1 346 | 62,17 | 169 | 65,69 | ||||
| 2025-08-14 | 13F | Susquehanna International Group, Llp | 19 694 | 2 464 | ||||||
| 2025-04-08 | 13F | J2 Capital Management Inc | 0 | −100,00 | 0 | |||||
| 2025-05-14 | 13F | Kestra Advisory Services, LLC | 0 | −100,00 | 0 | −100,00 | ||||
| 2025-07-30 | 13F | Bogart Wealth, LLC | 74 | 0,00 | 9 | 0,00 | ||||
| 2025-03-28 | 13F/A | Berkeley, Inc | 0 | −100,00 | 0 | −100,00 | ||||
| 2025-07-14 | 13F | Park Avenue Securities Llc | 9 798 | 41,30 | 1 | |||||
| 2025-05-14 | 13F | Northwestern Mutual Wealth Management Co | 0 | −100,00 | 0 | |||||
| 2025-08-08 | 13F | Pnc Financial Services Group, Inc. | 9 328 | −9,71 | 1 167 | −8,12 | ||||
| 2025-08-14 | 13F | Raymond James Financial Inc | 3 062 | 1,36 | 383 | 3,23 | ||||
| 2025-06-24 | NP | TNNIX - 1290 Retirement 2040 Fund Class I | 577 | 0,00 | 69 | −9,33 | ||||
| 2025-08-14 | 13F | Fmr Llc | 157 | −12,78 | 20 | −13,64 | ||||
| 2025-07-18 | 13F | SOA Wealth Advisors, LLC. | 668 | 0,60 | 84 | 2,47 | ||||
| 2025-07-16 | 13F | ORG Partners LLC | 0 | −100,00 | 0 | |||||
| 2025-07-11 | 13F | Farther Finance Advisors, LLC | 59 | 1,72 | 7 | 0,00 | ||||
| 2025-08-13 | 13F | Congress Wealth Management LLC / DE / | 85 695 | −19,27 | 10 722 | −17,80 | ||||
| 2025-08-14 | 13F | Atomi Financial Group, Inc. | 2 235 | −1,97 | 280 | −0,36 | ||||
| 2025-07-22 | 13F | Miracle Mile Advisors, LLC | 2 725 | 341 | ||||||
| 2025-04-29 | 13F | Resources Investment Advisors, LLC. | 0 | −100,00 | 0 | −100,00 |