Grunnleggende statistikk
| Institusjonelle eiere | 127 total, 127 long only, 0 short only, 0 long/short - change of −3,76% MRQ |
| Gjennomsnittlig porteføljeallokering | 0.1079 % - change of 0,12% MRQ |
| Institusjonelle aksjer (Long) | 5 343 977 (ex 13D/G) - change of −0,18MM shares −3,26% MRQ |
| Institusjonell verdi (Long) | $ 332 819 USD ($1000) |
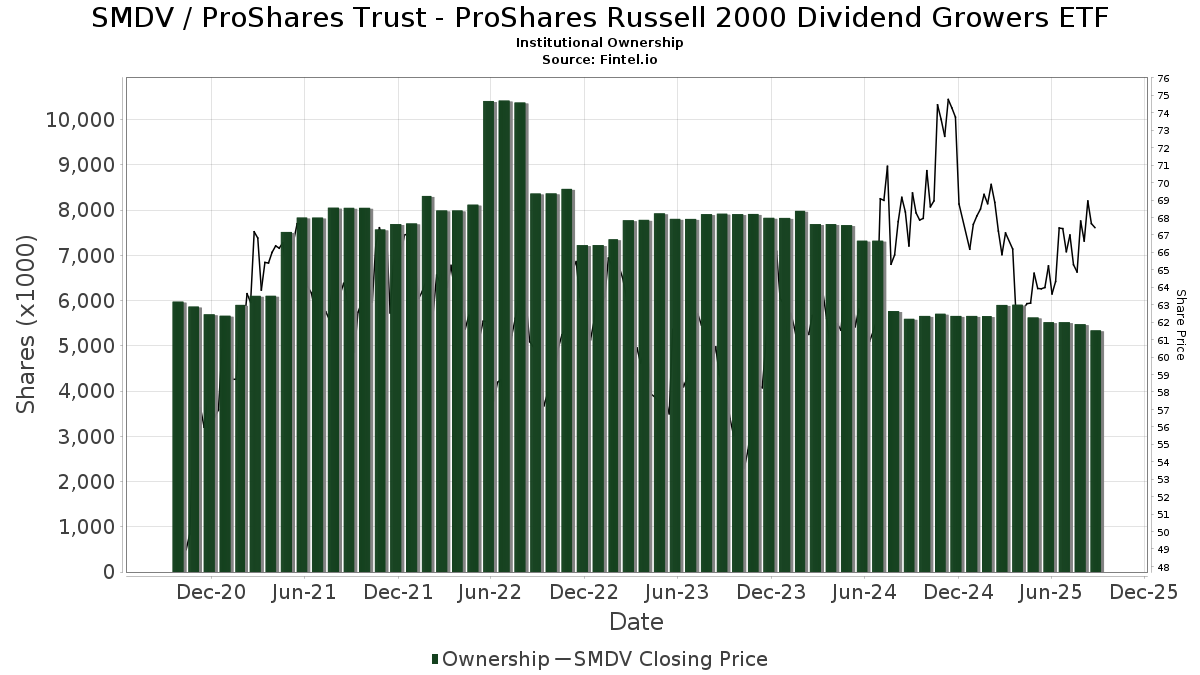
Institusjonelt eierskap og aksjonærer
ProShares Trust - ProShares Russell 2000 Dividend Growers ETF (US:SMDV) har 127 institusjonelle eiere og aksjonærer som har sendt inn 13D/G- eller 13F-skjemaer til Securities Exchange Commission (SEC). Disse institusjonene eier til sammen 5,343,977 aksjer. De største aksjonærene inkluderer Morgan Stanley, Capital Investment Advisors, LLC, UBS Group AG, Wells Fargo & Company/mn, Raymond James Financial Inc, Bank Of America Corp /de/, LPL Financial LLC, Royal Bank Of Canada, Toth Financial Advisory Corp, and Wiley Bros.-aintree Capital, Llc .
ProShares Trust - ProShares Russell 2000 Dividend Growers ETF (BATS:SMDV) institusjonell eierstruktur viser nåværende posisjoner i selskapet fordelt på institusjoner og fond, samt de siste endringene i posisjonsstørrelse. De største aksjonærene kan være individuelle investorer, verdipapirfond, hedgefond eller institusjoner. Schedule 13D indikerer at investoren eier (eller har eid) mer enn 5 % av selskapet og har til hensikt (eller hadde til hensikt) å aktivt forfølge en endring i forretningsstrategien. Schedule 13G indikerer en passiv investering på over 5 %.
The share price as of September 12, 2025 is 67,64 / share. Previously, on September 16, 2024, the share price was 69,09 / share. This represents a decline of 2,10% over that period.
Fondssentiment-score
Fondssentiment Score (også kjent som akkumulering av eierskap poengsum) viser hvilke aksjer som er mest kjøpt av fond. Den er resultatet av en sofistikert, kvantitativ flerfaktormodell som identifiserer selskaper med de høyeste nivåene av institusjonell akkumulering. Beregningsmodellen for poeng bruker en kombinasjon av den totale økningen i antall offentliggjorte eiere, endringer i porteføljeallokeringen til disse eierne og andre beregninger. Tallet går fra 0 til 100, der høyere tall indikerer en høyere grad av akkumulering i forhold til sammenlignbare selskaper, der 50 er gjennomsnittet.
Oppdateringsfrekvens: Daglig
Sjekk ut Ownership Explorer, som inneholder en liste over de høyest rangerte selskapene.
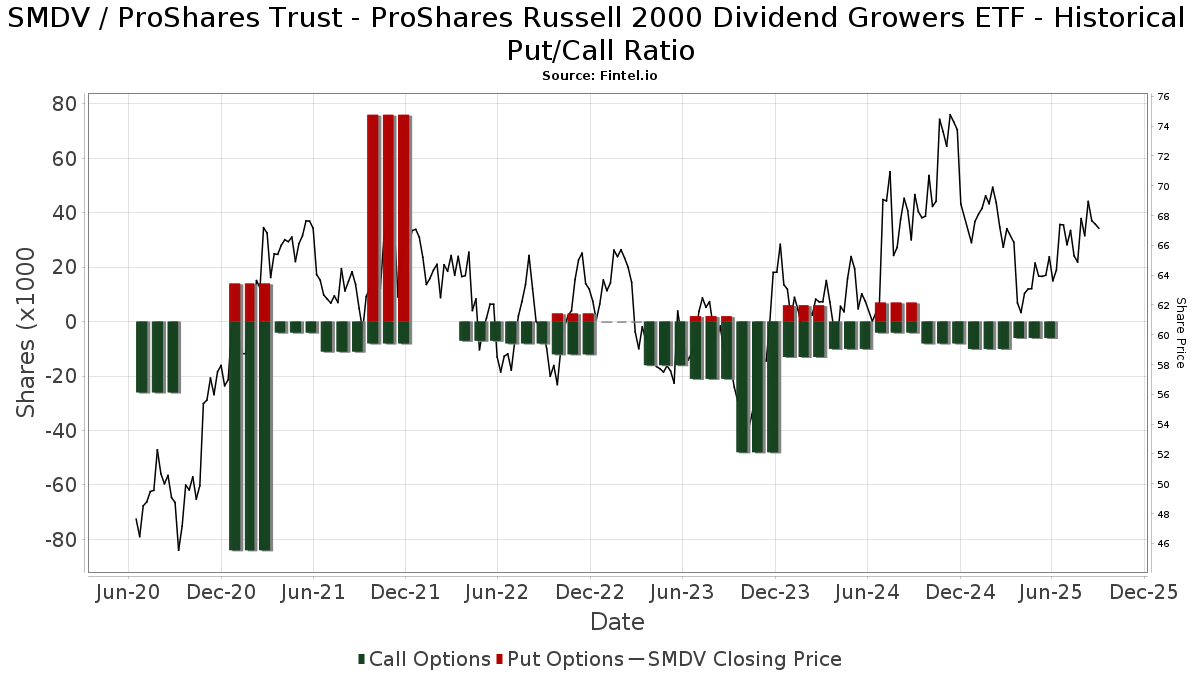
Institusjonell Put/Call-forhold
I tillegg til å rapportere standard aksje- og gjeldsemisjoner må institusjoner med mer enn 100 millioner kroner i forvaltningskapital også oppgi beholdningen av put- og callopsjoner. Siden put-opsjoner generelt indikerer et negativt sentiment, og call-opsjoner indikerer et positivt sentiment, kan vi få et inntrykk av det generelle institusjonelle sentimentet ved å plotte forholdet mellom put- og call-opsjoner. Diagrammet til høyre viser det historiske forholdet mellom put- og call-opsjoner for dette instrumentet.
Ved å bruke Put/Call-forholdet som en indikator på investorsentimentet kan man overvinne en av de viktigste svakhetene ved å bruke totalt institusjonelt eierskap, nemlig at en betydelig andel av forvaltningskapitalen investeres passivt for å følge indekser. Passivt forvaltede fond kjøper vanligvis ikke opsjoner, slik at indikatoren for put/call-forhold i større grad gjenspeiler stemningen i aktivt forvaltede fond.
13F- og NPORT-arkiveringer
Detaljer om 13F-arkiveringer er gratis. Detaljer om NP-arkiveringer krever et premium-medlemskap. Grønne rader indikerer nye posisjoner. Røde rader indikerer lukkede posisjoner. Klikk på lenke ikonet for å se hele transaksjonshistorikken.
Oppgrader
for å låse opp premiedata og eksportere til Excel. ![]() .
.
| Fildato | Kilde | Investor | Type | Gjennomsnittlig pris (estimert) |
Aksjer | Δ Aksjer (%) |
Rapportert verdi ($1000) | Verdi (%) | Portallokering (%) | |
|---|---|---|---|---|---|---|---|---|---|---|
| 2025-08-12 | 13F | Howe & Rusling Inc | 2 721 | 7,72 | 177 | 7,27 | ||||
| 2025-08-13 | 13F | Baird Financial Group, Inc. | 125 218 | 0,34 | 8 147 | −0,48 | ||||
| 2025-08-14 | 13F | Susquehanna International Group, Llp | 9 206 | 122,80 | 599 | 120,66 | ||||
| 2025-08-14 | 13F | Susquehanna International Group, Llp | Call | 6 700 | 8,06 | 436 | 7,14 | |||
| 2025-08-14 | 13F | Lazard Asset Management Llc | 1 250 | 0,00 | 0 | |||||
| 2025-05-06 | 13F | WT Wealth Management | 0 | −100,00 | 0 | |||||
| 2025-08-14 | 13F | Moneta Group Investment Advisors Llc | 3 227 | 0,00 | 210 | −0,95 | ||||
| 2025-07-22 | 13F | DAVENPORT & Co LLC | 3 826 | 0,00 | 249 | −0,80 | ||||
| 2025-08-14 | 13F | Harvest Investment Services, LLC | 14 383 | 2,51 | 936 | 1,63 | ||||
| 2025-08-12 | 13F | Jacobi Capital Management LLC | 28 411 | −0,78 | 1 848 | −1,60 | ||||
| 2025-08-18 | 13F | Geneos Wealth Management Inc. | 7 955 | 11,52 | 518 | 10,71 | ||||
| 2025-07-31 | 13F | Cambridge Investment Research Advisors, Inc. | 54 029 | −3,54 | 4 | 0,00 | ||||
| 2025-08-14 | 13F | GWM Advisors LLC | 5 415 | 8,02 | 352 | 7,32 | ||||
| 2025-05-12 | 13F | Benjamin Edwards Inc | 0 | −100,00 | 0 | |||||
| 2025-07-25 | 13F | Cwm, Llc | 154 | 0,00 | 0 | |||||
| 2025-08-12 | 13F | J.w. Cole Advisors, Inc. | 6 843 | 6,79 | 445 | 5,95 | ||||
| 2025-08-11 | 13F | HighTower Advisors, LLC | 5 121 | 3,41 | 333 | 2,78 | ||||
| 2025-08-12 | 13F | MAI Capital Management | 2 297 | −2,38 | 149 | −3,25 | ||||
| 2025-08-13 | 13F | Beacon Pointe Advisors, LLC | 10 011 | 0,00 | 651 | −0,76 | ||||
| 2025-07-10 | 13F | Wealth Enhancement Advisory Services, Llc | 5 786 | −2,84 | 392 | 0,51 | ||||
| 2025-08-14 | 13F | Citadel Advisors Llc | 9 850 | −35,24 | 641 | −35,81 | ||||
| 2025-05-06 | 13F | Pinnacle Associates Ltd | 0 | −100,00 | 0 | |||||
| 2025-08-11 | 13F | Citigroup Inc | 3 266 | −8,72 | 212 | −9,40 | ||||
| 2025-07-22 | 13F | Legacy Trust | 0 | −100,00 | 0 | |||||
| 2025-07-25 | 13F | Lion Street Advisors, LLC | 3 132 | 0,10 | 204 | −0,98 | ||||
| 2025-08-12 | 13F | Park Square Financial Group, LLC | 44 | 0,00 | 3 | 0,00 | ||||
| 2025-08-11 | 13F | Aptus Capital Advisors, LLC | 218 | 0,46 | 14 | 0,00 | ||||
| 2025-08-11 | 13F | Western Wealth Management, LLC | 4 185 | 0,29 | 272 | −0,37 | ||||
| 2025-07-10 | 13F | CWC Advisors, LLC. | 3 250 | 0,00 | 211 | −0,94 | ||||
| 2025-04-10 | 13F | Hennion & Walsh Asset Management, Inc. | 0 | −100,00 | 0 | −100,00 | ||||
| 2025-08-14 | 13F | Acorn Wealth Advisors, LLC | 5 099 | 1,39 | 332 | 0,61 | ||||
| 2025-08-06 | 13F | Round Rock Advisors, LLC | 4 275 | −0,02 | 278 | −0,71 | ||||
| 2025-08-06 | 13F | Wedbush Securities Inc | 14 370 | −3,34 | 1 | |||||
| 2025-08-11 | 13F | CFS Investment Advisory Services, LLC | 7 529 | 26,86 | 0 | |||||
| 2025-07-25 | 13F | Landmark Wealth Management, LLC | 47 835 | −0,12 | 3 | 0,00 | ||||
| 2025-07-09 | 13F | Dynamic Advisor Solutions LLC | 7 840 | 1,62 | 510 | 0,79 | ||||
| 2025-08-04 | 13F | Assetmark, Inc | 33 | 17,86 | 2 | 100,00 | ||||
| 2025-08-04 | 13F | Arkadios Wealth Advisors | 3 976 | −2,38 | 259 | −3,37 | ||||
| 2025-08-07 | 13F | Palisade Asset Management, LLC | 0 | −100,00 | 0 | |||||
| 2025-07-01 | 13F | Harbor Investment Advisory, Llc | 2 780 | 0,00 | 181 | −1,10 | ||||
| 2025-07-29 | 13F | Private Trust Co Na | 89 | 0,00 | 6 | 0,00 | ||||
| 2025-07-16 | 13F | Essex Financial Services, Inc. | 23 562 | −6,58 | 1 533 | −7,38 | ||||
| 2025-07-14 | 13F | Toth Financial Advisory Corp | 191 474 | −1,42 | 12 457 | −2,22 | ||||
| 2025-08-12 | 13F | Steward Partners Investment Advisory, Llc | 790 | 0,00 | 51 | 0,00 | ||||
| 2025-07-21 | 13F | Empirical Financial Services, LLC d.b.a. Empirical Wealth Management | 0 | −100,00 | 0 | |||||
| 2025-08-14 | 13F | Mercer Global Advisors Inc /adv | 13 807 | −3,07 | 898 | −3,85 | ||||
| 2025-08-14 | 13F | Raymond James Financial Inc | 293 006 | −3,04 | 19 063 | −3,82 | ||||
| 2025-08-08 | 13F | United Asset Strategies, Inc. | 16 220 | −6,63 | 1 055 | −7,37 | ||||
| 2025-07-25 | 13F | Total Clarity Wealth Management, Inc. | 6 640 | −1,98 | 432 | −5,90 | ||||
| 2025-05-15 | 13F | Citadel Advisors Llc | Put | 0 | −100,00 | 0 | −100,00 | |||
| 2025-07-10 | 13F | Oliver Lagore Vanvalin Investment Group | 0 | −100,00 | 0 | |||||
| 2025-07-11 | 13F | Caldwell Securities, Inc | 2 646 | 30,22 | 172 | 29,32 | ||||
| 2025-08-14 | 13F | Stifel Financial Corp | 47 410 | 1,07 | 3 085 | 0,26 | ||||
| 2025-07-24 | 13F | Blair William & Co/il | 5 946 | 0,00 | 387 | −0,77 | ||||
| 2025-08-08 | 13F | Cetera Investment Advisers | 87 490 | −2,03 | 5 692 | −2,82 | ||||
| 2025-07-07 | 13F | Wesbanco Bank Inc | 3 833 | −29,45 | 249 | −30,06 | ||||
| 2025-07-21 | 13F | Ameritas Advisory Services, LLC | 444 | 29 | ||||||
| 2025-08-14 | 13F | Warren Averett Asset Management, LLC | 3 662 | 0,00 | 238 | −0,83 | ||||
| 2025-08-13 | 13F | Northwestern Mutual Wealth Management Co | 15 449 | −33,06 | 1 005 | −33,58 | ||||
| 2025-05-09 | 13F | Pathway Financial Advisers, LLC | 0 | −100,00 | 0 | |||||
| 2025-07-24 | 13F | Us Bancorp \de\ | 1 000 | 150,00 | 65 | 150,00 | ||||
| 2025-07-22 | 13F | Kraematon Investment Advisors, Inc | 5 222 | −2,72 | 340 | −3,69 | ||||
| 2025-08-04 | 13F | Northwest Financial Advisors | 10 695 | −11,10 | 696 | −11,91 | ||||
| 2025-08-19 | 13F | National Asset Management, Inc. | 4 819 | −8,00 | 314 | −11,58 | ||||
| 2025-08-04 | 13F | L.m. Kohn & Company | 9 789 | 13,63 | 637 | 12,57 | ||||
| 2025-08-13 | 13F | Jones Financial Companies Lllp | 11 760 | 34,72 | 768 | 34,27 | ||||
| 2025-05-08 | 13F | Endeavor Private Wealth, Inc. | 0 | −100,00 | 0 | |||||
| 2025-08-14 | 13F | Ameriprise Financial Inc | 44 356 | 72,82 | 2 886 | 71,42 | ||||
| 2025-07-15 | 13F | Bay Capital Advisors, LLC | 4 400 | 0,00 | 286 | −0,69 | ||||
| 2025-08-14 | 13F | Two Sigma Investments, Lp | 29 900 | −5,97 | 1 945 | −6,71 | ||||
| 2025-08-12 | 13F | MWA Asset Management | 4 081 | −26,88 | 265 | −27,60 | ||||
| 2025-08-04 | 13F | Pensionmark Financial Group, Llc | 7 952 | 0,00 | 517 | −0,77 | ||||
| 2025-07-28 | 13F | BRYN MAWR TRUST Co | 368 | −33,57 | 24 | −36,11 | ||||
| 2025-08-12 | 13F | Franklin Resources Inc | 735 | 48 | ||||||
| 2025-07-30 | 13F | Parcion Private Wealth LLC | 24 893 | 0,00 | 1 620 | −0,80 | ||||
| 2025-07-18 | 13F | Trilogy Capital Inc. | 0 | −100,00 | 0 | |||||
| 2025-08-14 | 13F | UBS Group AG | 377 984 | −15,42 | 24 592 | −16,10 | ||||
| 2025-07-23 | 13F | Trueblood Wealth Management, LLC | 15 481 | 0,00 | 1 007 | −0,79 | ||||
| 2025-08-12 | 13F | Proequities, Inc. | 0 | 0 | ||||||
| 2025-08-14 | 13F | CoreCap Advisors, LLC | 75 | −10,71 | 5 | −20,00 | ||||
| 2025-08-07 | 13F | Addison Advisors LLC | 50 | 0,00 | 3 | 0,00 | ||||
| 2025-08-14 | 13F | Royal Capital Wealth Management, LLC | 12 423 | 0,11 | 808 | −0,62 | ||||
| 2025-08-14 | 13F | Comerica Bank | 9 671 | −0,51 | 629 | −1,26 | ||||
| 2025-08-05 | 13F | Key FInancial Inc | 549 | 0,00 | 36 | −2,78 | ||||
| 2025-08-11 | 13F | Nations Financial Group Inc, /ia/ /adv | 15 189 | −1,43 | 988 | −2,18 | ||||
| 2025-07-30 | 13F | FNY Investment Advisers, LLC | 200 | 0 | ||||||
| 2025-08-13 | 13F | Smith, Moore & Co. | 55 164 | 3,31 | 3 589 | 2,46 | ||||
| 2025-08-12 | 13F | Nemes Rush Group LLC | 0 | −100,00 | 0 | |||||
| 2025-08-07 | 13F | Cascade Financial Partners, LLC | 11 693 | 0,00 | 761 | −0,78 | ||||
| 2025-07-18 | 13F | PFG Investments, LLC | 17 259 | −26,11 | 1 123 | −26,76 | ||||
| 2025-08-11 | 13F | Principal Securities, Inc. | 481 | 54,17 | 31 | 47,62 | ||||
| 2025-08-14 | 13F | Jane Street Group, Llc | 4 196 | 273 | ||||||
| 2025-07-08 | 13F | Arlington Trust Co LLC | 140 033 | −3,24 | 9 111 | −4,02 | ||||
| 2025-08-13 | 13F | Colonial Trust Co / SC | 43 | 0,00 | 3 | 0,00 | ||||
| 2025-07-28 | 13F | Harbour Investments, Inc. | 2 243 | 2 143,00 | 146 | 2 316,67 | ||||
| 2025-08-14 | 13F | Citadel Advisors Llc | Call | 0 | −100,00 | 0 | ||||
| 2025-07-14 | 13F | Lewis Asset Management, LLC | 6 835 | −15,01 | 445 | −15,75 | ||||
| 2025-07-24 | 13F | Capital Advisors, Ltd. LLC | 4 943 | 8,26 | 0 | |||||
| 2025-05-05 | 13F | IFP Advisors, Inc | 0 | −100,00 | 0 | |||||
| 2025-08-14 | 13F | Royal Bank Of Canada | 198 490 | −10,73 | 12 914 | −11,44 | ||||
| 2025-08-14 | 13F | Qube Research & Technologies Ltd | 257 | −55,84 | 17 | −57,89 | ||||
| 2025-08-14 | 13F | Wells Fargo & Company/mn | 348 652 | −17,15 | 22 683 | −17,82 | ||||
| 2025-08-15 | 13F | Tower Research Capital LLC (TRC) | 1 319 | −85,17 | 86 | −85,42 | ||||
| 2025-08-14 | 13F | Financial Advisory Service, Inc. | 712 | −54,24 | 46 | −54,90 | ||||
| 2025-08-06 | 13F | Paladin Advisory Group, LLC | 101 | 0,00 | 7 | 0,00 | ||||
| 2025-08-11 | 13F | United Advisor Group, LLC | 48 451 | −0,18 | 3 152 | −0,97 | ||||
| 2025-05-13 | 13F | Bank Of Montreal /can/ | 0 | −100,00 | 0 | |||||
| 2025-07-30 | 13F/A | KPP Advisory Services LLC | 3 682 | −0,46 | 240 | −1,24 | ||||
| 2025-08-05 | 13F | GPS Wealth Strategies Group, LLC | 2 201 | 0,05 | 143 | −0,69 | ||||
| 2025-08-11 | 13F | Synergy Investment Management, LLC | 0 | −100,00 | 0 | |||||
| 2025-08-11 | 13F | Annis Gardner Whiting Capital Advisors, LLC | 344 | 23 | ||||||
| 2025-08-08 | 13F | Avantax Advisory Services, Inc. | 4 402 | 3,58 | 286 | 2,88 | ||||
| 2025-08-15 | 13F | Morgan Stanley | 1 090 179 | −3,83 | 70 927 | −4,61 | ||||
| 2025-05-14 | 13F | Huntington National Bank | 12 | |||||||
| 2025-08-01 | 13F | Envestnet Asset Management Inc | 72 998 | 33,06 | 4 749 | 31,99 | ||||
| 2025-07-09 | 13F | Key Client Fiduciary Advisors, LLC | 5 917 | 0,00 | 385 | −1,03 | ||||
| 2025-09-04 | 13F/A | Advisor Group Holdings, Inc. | 33 543 | −4,15 | 2 185 | −4,92 | ||||
| 2025-07-08 | 13F | Atlas Brown,Inc. | 5 817 | −0,70 | 378 | −1,56 | ||||
| 2025-08-04 | 13F | Spire Wealth Management | 107 | 0,94 | 7 | 0,00 | ||||
| 2025-05-13 | 13F | Capstone Wealth Management Group LLC | 0 | −100,00 | 0 | |||||
| 2025-07-17 | 13F/A | Capital Investment Advisors, LLC | 419 959 | 0,41 | 27 323 | −0,40 | ||||
| 2025-07-17 | 13F | Janney Montgomery Scott LLC | 3 592 | 1,41 | 0 | |||||
| 2025-08-12 | 13F | CIBC Private Wealth Group, LLC | 272 | 0,00 | 18 | 6,25 | ||||
| 2025-08-07 | 13F | New England Private Wealth Advisors LLC | 30 078 | 1 964 | ||||||
| 2025-07-08 | 13F | Nbc Securities, Inc. | 100 | 0,00 | 0 | |||||
| 2025-08-19 | 13F | Anchor Investment Management, LLC | 1 520 | −8,82 | 99 | −10,09 | ||||
| 2025-07-18 | 13F | Truist Financial Corp | 116 781 | 1,65 | 7 598 | 0,82 | ||||
| 2025-08-14 | 13F | Wiley Bros.-aintree Capital, Llc | 156 160 | 28,41 | 10 161 | 27,51 | ||||
| 2025-08-14 | 13F | IHT Wealth Management, LLC | 3 464 | 0,12 | 225 | −0,44 | ||||
| 2025-08-11 | 13F | Private Advisor Group, LLC | 8 488 | 7,63 | 552 | 6,77 | ||||
| 2025-05-15 | 13F | Two Sigma Securities, Llc | 0 | −100,00 | 0 | −100,00 | ||||
| 2025-08-14 | 13F | Fmr Llc | 1 878 | −13,26 | 122 | −13,48 | ||||
| 2025-08-12 | 13F | Global Retirement Partners, LLC | 245 | 60,13 | 16 | 50,00 | ||||
| 2025-07-17 | 13F | Jackson, Grant Investment Advisers, Inc. | 3 455 | 0,06 | 225 | −0,88 | ||||
| 2025-04-16 | 13F | Crowley Wealth Management, Inc. | 0 | −100,00 | 0 | |||||
| 2025-08-04 | 13F | Integrity Alliance, Llc. | 0 | −100,00 | 0 | |||||
| 2025-08-04 | 13F | Creative Financial Designs Inc /adv | 8 347 | 0,01 | 543 | −0,73 | ||||
| 2025-04-08 | 13F | Parallel Advisors, LLC | 0 | −100,00 | 0 | |||||
| 2025-07-23 | 13F | Ameliora Wealth Management Ltd. | 500 | 0,00 | 33 | 0,00 | ||||
| 2025-08-12 | 13F | LPL Financial LLC | 274 509 | 4,29 | 17 860 | 3,45 | ||||
| 2025-08-08 | 13F | Pnc Financial Services Group, Inc. | 573 | −9,62 | 37 | −9,76 | ||||
| 2025-08-14 | 13F | Heritage Wealth Management, Inc. | 3 972 | −10,18 | 258 | −11,03 | ||||
| 2025-08-15 | 13F | Equitable Holdings, Inc. | 19 246 | −0,67 | 1 252 | −1,42 | ||||
| 2025-04-28 | 13F | Mainstream Capital Management LLC | 0 | −100,00 | 0 | |||||
| 2025-08-11 | 13F | HHM Wealth Advisors, LLC | 0 | −100,00 | 0 | |||||
| 2025-07-28 | 13F | ForthRight Wealth Management, LLC | 85 395 | 24,56 | 5 556 | 23,55 | ||||
| 2025-07-29 | 13F | Creekside Partners | 5 485 | −1,83 | 357 | −2,73 | ||||
| 2025-08-06 | 13F | Commonwealth Equity Services, Llc | 94 117 | 0,38 | 6 | 0,00 | ||||
| 2025-08-14 | 13F | Bank Of America Corp /de/ | 279 956 | −1,02 | 18 214 | −1,83 | ||||
| 2025-07-17 | 13F | Park Place Capital Corp | 29 | 0,00 | 2 | 0,00 | ||||
| 2025-08-12 | 13F | Jpmorgan Chase & Co | 2 724 | −66,31 | 177 | −66,60 | ||||
| 2025-08-14 | 13F | Goldman Sachs Group Inc | 35 312 | 58,64 | 2 297 | 57,44 | ||||
| 2025-08-11 | 13F | Wbi Investments, Inc. | 16 584 | 1,74 | 1 079 | 0,84 | ||||
| 2025-04-25 | 13F | Koshinski Asset Management, Inc. | 0 | −100,00 | 0 | |||||
| 2025-08-01 | 13F | Belvedere Trading LLC | Call | 0 | −100,00 | 0 | ||||
| 2025-08-01 | 13F | Anson Capital, Inc. | 3 579 | 4,56 | 233 | 3,57 |