Grunnleggende statistikk
| Institusjonelle eiere | 135 total, 135 long only, 0 short only, 0 long/short - change of 4,65% MRQ |
| Gjennomsnittlig porteføljeallokering | 0.1022 % - change of −8,51% MRQ |
| Institusjonelle aksjer (Long) | 9 193 342 (ex 13D/G) - change of 0,40MM shares 4,50% MRQ |
| Institusjonell verdi (Long) | $ 203 055 USD ($1000) |
Institusjonelt eierskap og aksjonærer
Cohen & Steers REIT and Preferred Income Fund, Inc. (US:RNP) har 135 institusjonelle eiere og aksjonærer som har sendt inn 13D/G- eller 13F-skjemaer til Securities Exchange Commission (SEC). Disse institusjonene eier til sammen 9,193,342 aksjer. De største aksjonærene inkluderer Morgan Stanley, Ellis Investment Partners, LLC, LPL Financial LLC, Raymond James Financial Inc, Ameriprise Financial Inc, Bank Of America Corp /de/, Wells Fargo & Company/mn, XML Financial, LLC, Royal Bank Of Canada, and UBS Group AG .
Cohen & Steers REIT and Preferred Income Fund, Inc. (NYSE:RNP) institusjonell eierstruktur viser nåværende posisjoner i selskapet fordelt på institusjoner og fond, samt de siste endringene i posisjonsstørrelse. De største aksjonærene kan være individuelle investorer, verdipapirfond, hedgefond eller institusjoner. Schedule 13D indikerer at investoren eier (eller har eid) mer enn 5 % av selskapet og har til hensikt (eller hadde til hensikt) å aktivt forfølge en endring i forretningsstrategien. Schedule 13G indikerer en passiv investering på over 5 %.
The share price as of September 11, 2025 is 22,42 / share. Previously, on September 12, 2024, the share price was 23,68 / share. This represents a decline of 5,32% over that period.

Fondssentiment-score
Fondssentiment Score (også kjent som akkumulering av eierskap poengsum) viser hvilke aksjer som er mest kjøpt av fond. Den er resultatet av en sofistikert, kvantitativ flerfaktormodell som identifiserer selskaper med de høyeste nivåene av institusjonell akkumulering. Beregningsmodellen for poeng bruker en kombinasjon av den totale økningen i antall offentliggjorte eiere, endringer i porteføljeallokeringen til disse eierne og andre beregninger. Tallet går fra 0 til 100, der høyere tall indikerer en høyere grad av akkumulering i forhold til sammenlignbare selskaper, der 50 er gjennomsnittet.
Oppdateringsfrekvens: Daglig
Sjekk ut Ownership Explorer, som inneholder en liste over de høyest rangerte selskapene.
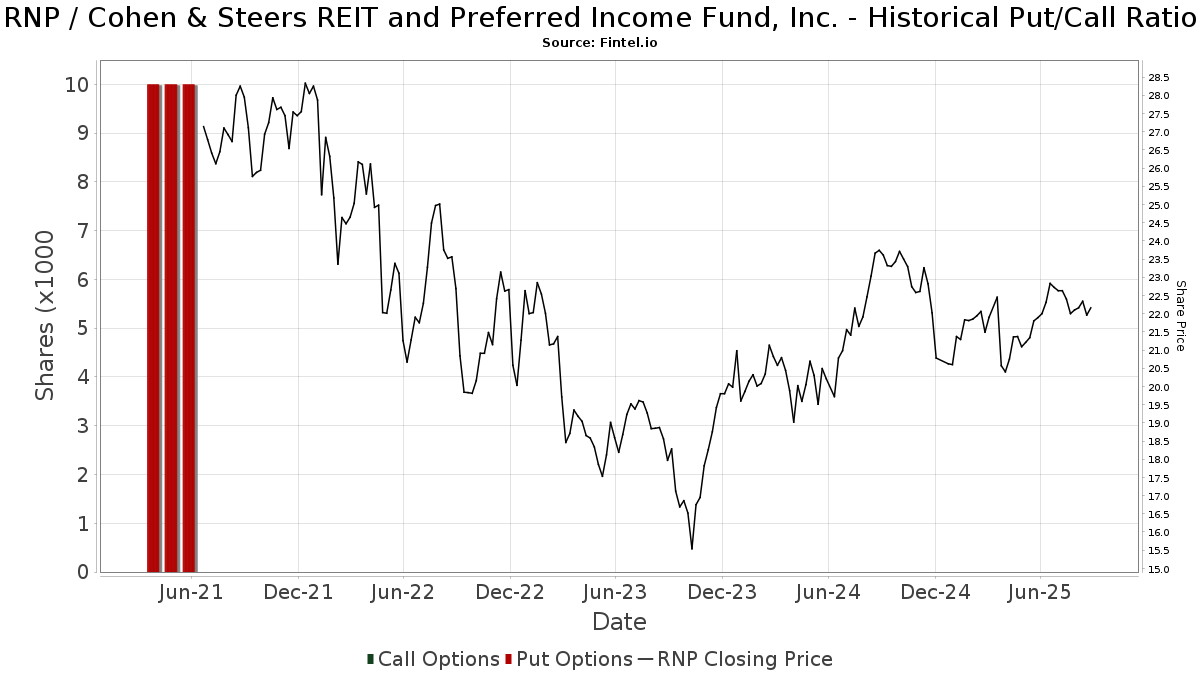
Institusjonell Put/Call-forhold
I tillegg til å rapportere standard aksje- og gjeldsemisjoner må institusjoner med mer enn 100 millioner kroner i forvaltningskapital også oppgi beholdningen av put- og callopsjoner. Siden put-opsjoner generelt indikerer et negativt sentiment, og call-opsjoner indikerer et positivt sentiment, kan vi få et inntrykk av det generelle institusjonelle sentimentet ved å plotte forholdet mellom put- og call-opsjoner. Diagrammet til høyre viser det historiske forholdet mellom put- og call-opsjoner for dette instrumentet.
Ved å bruke Put/Call-forholdet som en indikator på investorsentimentet kan man overvinne en av de viktigste svakhetene ved å bruke totalt institusjonelt eierskap, nemlig at en betydelig andel av forvaltningskapitalen investeres passivt for å følge indekser. Passivt forvaltede fond kjøper vanligvis ikke opsjoner, slik at indikatoren for put/call-forhold i større grad gjenspeiler stemningen i aktivt forvaltede fond.
13F- og NPORT-arkiveringer
Detaljer om 13F-arkiveringer er gratis. Detaljer om NP-arkiveringer krever et premium-medlemskap. Grønne rader indikerer nye posisjoner. Røde rader indikerer lukkede posisjoner. Klikk på lenke ikonet for å se hele transaksjonshistorikken.
Oppgrader
for å låse opp premiedata og eksportere til Excel. ![]() .
.
| Fildato | Kilde | Investor | Type | Gjennomsnittlig pris (estimert) |
Aksjer | Δ Aksjer (%) |
Rapportert verdi ($1000) | Verdi (%) | Portallokering (%) | |
|---|---|---|---|---|---|---|---|---|---|---|
| 2025-08-11 | 13F | TD Waterhouse Canada Inc. | 5 000 | 0,00 | 114 | 3,67 | ||||
| 2025-07-30 | 13F | D.a. Davidson & Co. | 10 754 | 4,88 | 245 | 7,96 | ||||
| 2025-07-29 | 13F | Koshinski Asset Management, Inc. | 79 709 | 8,80 | 1 815 | 12,25 | ||||
| 2025-08-14 | 13F | Mml Investors Services, Llc | 9 053 | −71,52 | 0 | −100,00 | ||||
| 2025-04-21 | 13F | Nelson, Van Denburg & Campbell Wealth Management Group, LLC | 0 | −100,00 | 0 | |||||
| 2025-07-17 | 13F | Janney Montgomery Scott LLC | 15 103 | 0,07 | 0 | |||||
| 2025-07-18 | 13F | Bartlett & Co. Wealth Management Llc | 48 535 | 1,36 | 1 105 | 4,64 | ||||
| 2025-08-11 | 13F | Shufro Rose & Co Llc | 49 300 | −1,00 | 1 088 | −1,00 | ||||
| 2025-08-08 | 13F | Islay Capital Management, Llc | 3 000 | 0,00 | 68 | 3,03 | ||||
| 2025-08-04 | 13F | JDM Financial Group LLC | 482 | 0,00 | 11 | 0,00 | ||||
| 2025-08-14 | 13F | Comerica Bank | 16 444 | 0,04 | 374 | 3,31 | ||||
| 2025-07-21 | 13F | Ameritas Advisory Services, LLC | 10 725 | 244 | ||||||
| 2025-08-18 | 13F | Geneos Wealth Management Inc. | 4 946 | 1,87 | 113 | 4,67 | ||||
| 2025-07-08 | 13F | Parallel Advisors, LLC | 3 | 0,00 | 0 | |||||
| 2025-07-31 | 13F | Hartford Financial Management Inc. | 444 | 0,00 | 10 | 11,11 | ||||
| 2025-07-31 | 13F | Moloney Securities Asset Management, LLC | 18 740 | 2,11 | 427 | 5,19 | ||||
| 2025-08-08 | 13F | Cetera Investment Advisers | 152 306 | 0,06 | 3 468 | 3,25 | ||||
| 2025-08-14 | 13F | Wiley Bros.-aintree Capital, Llc | 35 577 | 7,26 | 810 | 11,42 | ||||
| 2025-08-12 | 13F | Jpmorgan Chase & Co | 664 | 15 | ||||||
| 2025-07-25 | 13F | Atria Wealth Solutions, Inc. | 0 | −100,00 | 0 | |||||
| 2025-04-29 | 13F | Lee Danner & Bass Inc | 0 | −100,00 | 0 | −100,00 | ||||
| 2025-08-14 | 13F | IHT Wealth Management, LLC | 9 348 | −4,50 | 213 | −1,85 | ||||
| 2025-08-07 | 13F | Samalin Investment Counsel, LLC | 45 167 | 4,09 | 1 028 | 7,42 | ||||
| 2025-07-25 | 13F | Ellis Investment Partners, LLC | 1 199 662 | 0,23 | 27 316 | 3,41 | ||||
| 2025-08-06 | 13F | Commonwealth Equity Services, Llc | 187 384 | 13,28 | 4 | 33,33 | ||||
| 2025-07-25 | NP | FCEF - First Trust CEF Income Opportunity ETF This fund is a listed as child fund of First Trust Advisors Lp and if that institution has disclosed ownership in this security, then these positions will not be double counted when calculating total shares and total value | 52 230 | 4,77 | 1 135 | 1,89 | ||||
| 2025-08-13 | 13F | Johnson Financial Group, Inc. | 155 793 | −2,25 | 3 547 | 0,85 | ||||
| 2025-08-12 | 13F | Wealthbridge Capital Management, Llc | 21 950 | 3,54 | 500 | 6,85 | ||||
| 2025-07-18 | 13F | Consolidated Portfolio Review Corp | 113 031 | 15,17 | 2 574 | 18,79 | ||||
| 2025-08-12 | 13F | Advisors Asset Management, Inc. | 43 538 | −0,31 | 991 | 2,91 | ||||
| 2025-08-07 | 13F | Hennion & Walsh Asset Management, Inc. | 99 402 | 52,07 | 2 263 | 56,93 | ||||
| 2025-08-12 | 13F | Manchester Capital Management LLC | 4 000 | 0,00 | 91 | 3,41 | ||||
| 2025-08-12 | 13F | Insigneo Advisory Services, Llc | 23 800 | 0,00 | 542 | 3,05 | ||||
| 2025-07-17 | 13F | Venture Visionary Partners LLC | 86 467 | 8,98 | 1 969 | 12,39 | ||||
| 2025-08-08 | 13F | Fortis Group Advisors, LLC | 600 | 0,00 | 14 | 0,00 | ||||
| 2025-07-15 | 13F | Fifth Third Bancorp | 9 000 | 0,00 | 205 | 3,03 | ||||
| 2025-07-15 | 13F | Main Street Group, LTD | 1 040 | 0,00 | 24 | 4,55 | ||||
| 2025-08-19 | 13F | Advisory Services Network, LLC | 11 833 | 0,31 | 264 | 1,15 | ||||
| 2025-05-22 | NP | Cornerstone Total Return Fund Inc | 13 494 | −76,63 | 298 | −75,37 | ||||
| 2025-08-15 | 13F | Morgan Stanley | 1 300 655 | −0,18 | 29 616 | 2,98 | ||||
| 2025-08-11 | 13F | Principal Securities, Inc. | 228 | 5 | ||||||
| 2025-07-16 | 13F | American National Bank | 218 | 0,00 | 5 | 0,00 | ||||
| 2025-05-06 | 13F | Readystate Asset Management Lp | 0 | −100,00 | 0 | −100,00 | ||||
| 2025-05-22 | NP | Cornerstone Strategic Value Fund Inc | 62 948 | 415,08 | 1 389 | 444,71 | ||||
| 2025-05-13 | 13F | Elequin Capital Lp | 0 | −100,00 | 0 | |||||
| 2025-08-13 | 13F | Invesco Ltd. | 22 867 | −18,58 | 521 | −15,99 | ||||
| 2025-08-12 | 13F | CIBC Private Wealth Group, LLC | 3 | 200,00 | 0 | |||||
| 2025-07-30 | 13F | Bogart Wealth, LLC | 560 | 0,00 | 13 | 0,00 | ||||
| 2025-05-16 | 13F | McIlrath & Eck, LLC | 0 | −100,00 | 0 | |||||
| 2025-08-18 | 13F | Hollencrest Capital Management | 10 | 0,00 | 0 | |||||
| 2025-08-15 | 13F | Provenance Wealth Advisors, LLC | 0 | −100,00 | 0 | −100,00 | ||||
| 2025-08-11 | 13F | Private Advisor Group, LLC | 35 024 | −3,22 | 798 | −0,13 | ||||
| 2025-07-18 | 13F | SOA Wealth Advisors, LLC. | 0 | −100,00 | 0 | |||||
| 2025-08-15 | 13F | Tower Research Capital LLC (TRC) | 2 | 0,00 | 0 | |||||
| 2025-04-28 | 13F | Strategic Financial Concepts, LLC | 0 | −100,00 | 0 | −100,00 | ||||
| 2025-08-19 | 13F | Cape Investment Advisory, Inc. | 600 | 0,00 | 14 | 0,00 | ||||
| 2025-05-19 | 13F | Smith Asset Management Co., LLC | 24 683 | 23,55 | 545 | 30,46 | ||||
| 2025-07-11 | 13F | SILVER OAK SECURITIES, Inc | 12 700 | 289 | ||||||
| 2025-07-31 | 13F | Cambridge Investment Research Advisors, Inc. | 49 782 | −0,85 | 1 | 0,00 | ||||
| 2025-08-14 | 13F | Bank Of America Corp /de/ | 580 077 | −0,66 | 13 208 | 2,49 | ||||
| 2025-05-14 | 13F | Landscape Capital Management, L.l.c. | 0 | −100,00 | 0 | |||||
| 2025-07-29 | 13F | Private Trust Co Na | 7 219 | 0,00 | 164 | 3,14 | ||||
| 2025-08-14 | 13F | Ameriprise Financial Inc | 592 522 | 34,90 | 13 491 | 39,12 | ||||
| 2025-07-21 | 13F | Investment Planning Advisors, Inc. | 15 339 | −34,69 | 349 | −32,63 | ||||
| 2025-08-29 | 13F | Total Investment Management Inc | 64 | 1 | ||||||
| 2025-07-24 | 13F | Capital Advisors, Ltd. LLC | 1 987 | 0,00 | 0 | |||||
| 2025-09-04 | 13F/A | Advisor Group Holdings, Inc. | 117 179 | 16,99 | 2 669 | 20,72 | ||||
| 2025-07-17 | 13F/A | Capital Investment Advisors, LLC | 50 274 | −4,88 | 1 145 | −1,89 | ||||
| 2025-08-13 | 13F | Northwestern Mutual Wealth Management Co | 15 007 | −1,22 | 342 | 1,79 | ||||
| 2025-09-09 | 13F | NWF Advisory Services Inc. | 9 902 | 0,00 | 225 | 3,21 | ||||
| 2025-07-25 | 13F | Hazlett, Burt & Watson, Inc. | 213 | 1,91 | 0 | |||||
| 2025-07-10 | 13F | Kozak & Associates, Inc. | 466 | 11 | ||||||
| 2025-08-13 | 13F | Northern Trust Corp | 16 613 | 0,33 | 378 | 3,56 | ||||
| 2025-08-12 | 13F | MAI Capital Management | 4 045 | 0,00 | 92 | 3,37 | ||||
| 2025-08-08 | 13F | Larson Financial Group LLC | 0 | −100,00 | 0 | |||||
| 2025-08-14 | 13F | UBS Group AG | 272 574 | 2,98 | 6 207 | 6,25 | ||||
| 2025-08-12 | 13F | Steward Partners Investment Advisory, Llc | 30 125 | 4,42 | 686 | 7,70 | ||||
| 2025-07-17 | 13F | Camelot Portfolios, LLC | 23 096 | −4,79 | 526 | −1,87 | ||||
| 2025-07-24 | 13F | Us Bancorp \de\ | 1 261 | −90,04 | 29 | −89,96 | ||||
| 2025-08-14 | 13F | Modern Wealth Management, LLC | 9 520 | −26,88 | 217 | −24,74 | ||||
| 2025-07-15 | 13F | Oregon Pacific Wealth Management, LLC | 14 400 | −3,88 | 328 | −0,91 | ||||
| 2025-07-07 | 13F | RB Capital Management, LLC | 22 783 | −4,14 | 519 | −1,15 | ||||
| 2025-08-14 | 13F | Sunbelt Securities, Inc. | 150 | 0,00 | 3 | 0,00 | ||||
| 2025-07-21 | 13F | Ameriflex Group, Inc. | 1 469 | 0,00 | 33 | 0,00 | ||||
| 2025-07-11 | 13F | Caldwell Securities, Inc | 3 000 | 0,00 | 68 | 3,03 | ||||
| 2025-05-08 | 13F | We Are One Seven, LLC | 0 | −100,00 | 0 | |||||
| 2025-08-14 | 13F | Beaird Harris Wealth Management, LLC | 300 | 0,00 | 7 | 0,00 | ||||
| 2025-08-01 | 13F | Envestnet Asset Management Inc | 14 519 | −16,57 | 331 | −14,06 | ||||
| 2025-08-15 | 13F | Kestra Advisory Services, LLC | 49 554 | 3,90 | 1 128 | 7,22 | ||||
| 2025-07-21 | 13F | Future Financial Wealth Managment LLC | 0 | −100,00 | 0 | |||||
| 2025-07-28 | 13F | Harbour Investments, Inc. | 119 704 | 40,57 | 2 726 | 45,02 | ||||
| 2025-04-18 | 13F | JP Wealth Management, Inc. | 0 | −100,00 | 0 | |||||
| 2025-07-22 | 13F | DAVENPORT & Co LLC | 15 686 | 0,00 | 357 | 3,18 | ||||
| 2025-07-24 | 13F | Ronald Blue Trust, Inc. | 257 | 6 | ||||||
| 2025-08-04 | 13F | Spire Wealth Management | 6 115 | 1,88 | 139 | 5,30 | ||||
| 2025-08-19 | 13F | Campbell Capital Management Inc | 59 139 | −3,27 | 1 347 | −0,22 | ||||
| 2025-07-25 | 13F | Cwm, Llc | 2 983 | −29,93 | 0 | |||||
| 2025-08-13 | 13F | Jones Financial Companies Lllp | 35 | −98,25 | 1 | −100,00 | ||||
| 2025-05-15 | 13F | WPG Advisers, LLC | 0 | −100,00 | 0 | −100,00 | ||||
| 2025-08-06 | 13F | Atlantic Union Bankshares Corp | 48 934 | −7,73 | 1 114 | −4,79 | ||||
| 2025-08-14 | 13F | Royal Bank Of Canada | 310 099 | 3,57 | 7 060 | 6,84 | ||||
| 2025-08-08 | 13F | Pnc Financial Services Group, Inc. | 13 789 | −14,30 | 314 | −11,83 | ||||
| 2025-07-29 | 13F | International Assets Investment Management, Llc | 13 843 | 1,47 | 315 | 4,65 | ||||
| 2025-08-07 | 13F | Parkside Financial Bank & Trust | 2 500 | 0,00 | 57 | 1,82 | ||||
| 2025-07-10 | 13F | Wealth Enhancement Advisory Services, Llc | 19 540 | 31,83 | 447 | 36,39 | ||||
| 2025-08-07 | 13F | Lakeridge Wealth Management LLC | 9 770 | 0,00 | 222 | 3,26 | ||||
| 2025-08-14 | 13F | Colony Group, LLC | 19 784 | −1,97 | 450 | 1,12 | ||||
| 2025-07-10 | 13F | Secure Asset Management, LLC | 25 143 | 0,13 | 572 | 3,25 | ||||
| 2025-08-07 | 13F | McClarren Financial Advisors, Inc. | 0 | −100,00 | 0 | |||||
| 2025-08-05 | 13F | NewSquare Capital LLC | 1 500 | 0,00 | 34 | 3,03 | ||||
| 2025-08-08 | 13F | Cornerstone Advisors, LLC | 0 | −100,00 | 0 | |||||
| 2025-08-12 | 13F | LPL Financial LLC | 818 404 | 6,89 | 18 635 | 10,28 | ||||
| 2025-08-12 | 13F | AlphaCore Capital LLC | 33 997 | 10,06 | 774 | 13,66 | ||||
| 2025-07-07 | 13F | Trust Co | 400 | 0,00 | 9 | 12,50 | ||||
| 2025-05-16 | 13F | Coppell Advisory Solutions LLC | 0 | −100,00 | 0 | |||||
| 2025-08-08 | 13F | Hartland & Co., LLC | 2 000 | 46 | ||||||
| 2025-07-17 | 13F | LexAurum Advisors, LLC | 12 218 | 1,03 | 278 | 4,51 | ||||
| 2025-07-17 | 13F | Wolff Wiese Magana Llc | 28 | 0,00 | 1 | |||||
| 2025-08-12 | 13F | one8zero8, LLC | 11 000 | 0,00 | 250 | 3,31 | ||||
| 2025-08-13 | 13F | EverSource Wealth Advisors, LLC | 2 750 | 0,00 | 63 | 3,33 | ||||
| 2025-08-14 | 13F | Wells Fargo & Company/mn | 383 144 | 4,33 | 8 724 | 7,65 | ||||
| 2025-07-17 | 13F | XML Financial, LLC | 313 706 | 41,72 | 7 143 | 46,22 | ||||
| 2025-08-14 | 13F | GWM Advisors LLC | 818 | 0,00 | 19 | 0,00 | ||||
| 2025-08-14 | 13F | CoreCap Advisors, LLC | 4 155 | −0,02 | 95 | 3,30 | ||||
| 2025-08-12 | 13F | Proequities, Inc. | 0 | 0 | ||||||
| 2025-07-15 | 13F | Wealth Effects Llc | 13 800 | −15,34 | 314 | −12,53 | ||||
| 2025-07-21 | 13F | TFG Advisers LLC | 11 919 | −0,38 | 271 | 2,65 | ||||
| 2025-08-04 | 13F | MeadowBrook Investment Advisors LLC | 0 | −100,00 | 0 | |||||
| 2025-08-11 | 13F | Strategic Wealth Partners, Ltd. | 2 050 | 47 | ||||||
| 2025-08-13 | 13F | First Trust Advisors Lp | 80 097 | −6,24 | 1 824 | −3,29 | ||||
| 2025-08-12 | 13F | Intellus Advisors LLC | 9 721 | 5,22 | 221 | 8,87 | ||||
| 2025-08-07 | 13F | Allworth Financial LP | 2 214 | 330,74 | 50 | 400,00 | ||||
| 2025-05-14 | 13F | Monterey Private Wealth, Inc. | 9 902 | 0,00 | 219 | 5,83 | ||||
| 2025-05-12 | 13F | Wolverine Asset Management Llc | 0 | −100,00 | 0 | |||||
| 2025-07-31 | 13F | West Michigan Advisors, Llc | 15 791 | 0,31 | 360 | 3,46 | ||||
| 2025-08-08 | 13F | Creative Planning | 18 389 | 0,78 | 419 | 3,98 | ||||
| 2025-07-10 | 13F | Exchange Traded Concepts, Llc | 350 | 8 | ||||||
| 2025-07-11 | 13F | Annex Advisory Services, LLC | 8 827 | 201 | ||||||
| 2025-08-12 | 13F | Cornerstone Wealth Management, LLC | 9 244 | −66,62 | 210 | −85,34 | ||||
| 2025-08-11 | 13F | HighTower Advisors, LLC | 25 416 | 38,30 | 579 | 42,72 | ||||
| 2025-07-07 | 13F | Investors Research Corp | 2 200 | 0,00 | 50 | 4,17 | ||||
| 2025-08-08 | 13F | TD Capital Management LLC | 409 | 0,00 | 9 | 0,00 | ||||
| 2025-07-24 | 13F | IFP Advisors, Inc | 259 | 0,00 | 6 | 0,00 | ||||
| 2025-05-14 | 13F | Jane Street Group, Llc | 0 | −100,00 | 0 | |||||
| 2025-07-08 | 13F | Nbc Securities, Inc. | 1 400 | −48,15 | 0 | |||||
| 2025-08-01 | 13F | Oarsman Capital, Inc. | 42 350 | −3,75 | 964 | −0,72 | ||||
| 2025-05-14 | 13F | Van Hulzen Asset Management, LLC | 0 | −100,00 | 0 | −100,00 | ||||
| 2025-07-16 | 13F | Magnus Financial Group LLC | 19 956 | 0,13 | 454 | 3,42 | ||||
| 2025-07-24 | 13F | Costello Asset Management, INC | 416 | 0,00 | 9 | 0,00 | ||||
| 2025-08-14 | 13F | Hurley Capital, LLC | 1 000 | 23 | ||||||
| 2025-08-11 | 13F | Nations Financial Group Inc, /ia/ /adv | 17 649 | −11,02 | 402 | −8,24 | ||||
| 2025-04-01 | 13F/A | Talon Private Wealth, LLC | 0 | −100,00 | 0 | −100,00 | ||||
| 2025-08-13 | 13F | Everstar Asset Management, LLC | 29 260 | −9,86 | 666 | −6,98 | ||||
| 2025-07-30 | 13F | Cullen/frost Bankers, Inc. | 2 709 | 0,00 | 62 | 3,39 | ||||
| 2025-07-14 | 13F | Toth Financial Advisory Corp | 835 | 4,38 | 19 | 11,76 | ||||
| 2025-07-17 | 13F | Sound Income Strategies, LLC | 39 283 | −12,37 | 894 | −9,61 | ||||
| 2025-08-14 | 13F | Mariner, LLC | 10 372 | 7,81 | 236 | 11,32 | ||||
| 2025-08-04 | 13F | HBK Sorce Advisory LLC | 10 687 | 0,07 | 243 | 3,40 | ||||
| 2025-08-14 | 13F | Raymond James Financial Inc | 705 164 | 1,91 | 16 057 | 5,14 |