Grunnleggende statistikk
| Institusjonelle eiere | 246 total, 246 long only, 0 short only, 0 long/short - change of 6,03% MRQ |
| Gjennomsnittlig porteføljeallokering | 0.3924 % - change of 15,35% MRQ |
| Institusjonelle aksjer (Long) | 48 429 821 (ex 13D/G) - change of 5,14MM shares 11,87% MRQ |
| Institusjonell verdi (Long) | $ 1 108 426 USD ($1000) |
Institusjonelt eierskap og aksjonærer
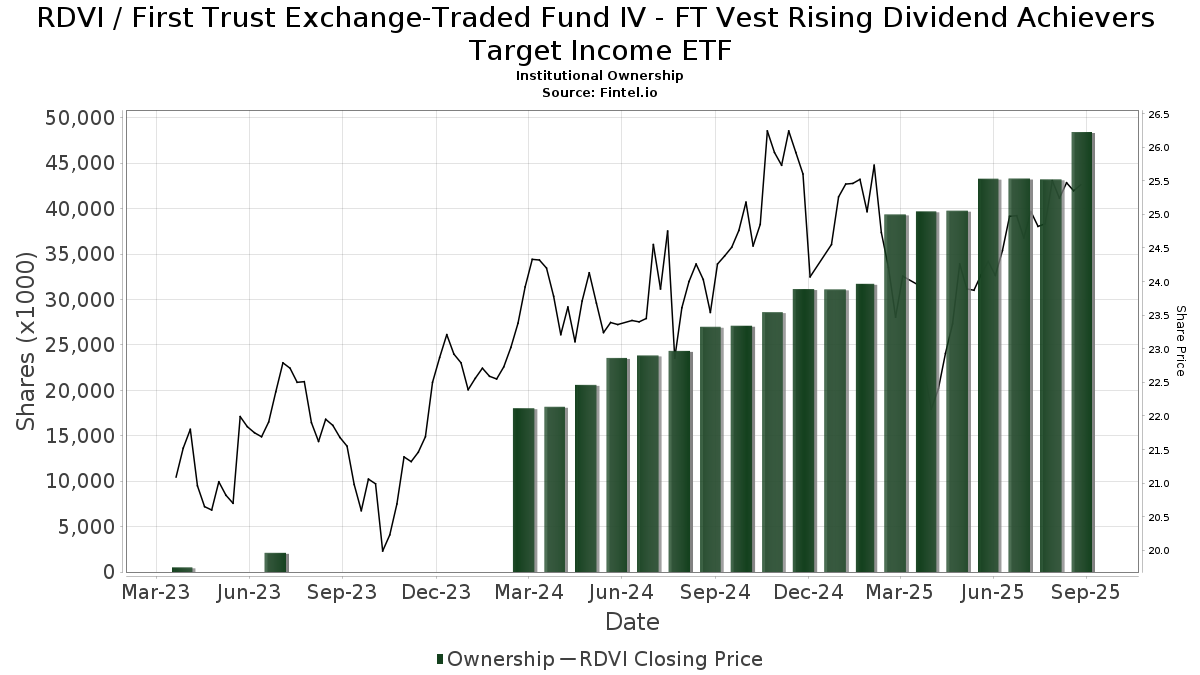
First Trust Exchange-Traded Fund IV - FT Vest Rising Dividend Achievers Target Income ETF (US:RDVI) har 246 institusjonelle eiere og aksjonærer som har sendt inn 13D/G- eller 13F-skjemaer til Securities Exchange Commission (SEC). Disse institusjonene eier til sammen 48,429,821 aksjer. De største aksjonærene inkluderer LPL Financial LLC, Raymond James Financial Inc, Wells Fargo & Company/mn, Stifel Financial Corp, Royal Bank Of Canada, Commonwealth Equity Services, Llc, Cetera Investment Advisers, Advisor Group Holdings, Inc., Spectrum Wealth Counsel, LLC, and Baird Financial Group, Inc. .
First Trust Exchange-Traded Fund IV - FT Vest Rising Dividend Achievers Target Income ETF (BATS:RDVI) institusjonell eierstruktur viser nåværende posisjoner i selskapet fordelt på institusjoner og fond, samt de siste endringene i posisjonsstørrelse. De største aksjonærene kan være individuelle investorer, verdipapirfond, hedgefond eller institusjoner. Schedule 13D indikerer at investoren eier (eller har eid) mer enn 5 % av selskapet og har til hensikt (eller hadde til hensikt) å aktivt forfølge en endring i forretningsstrategien. Schedule 13G indikerer en passiv investering på over 5 %.
The share price as of September 9, 2025 is 25,48 / share. Previously, on September 10, 2024, the share price was 23,56 / share. This represents an increase of 8,15% over that period.
Fondssentiment-score
Fondssentiment Score (også kjent som akkumulering av eierskap poengsum) viser hvilke aksjer som er mest kjøpt av fond. Den er resultatet av en sofistikert, kvantitativ flerfaktormodell som identifiserer selskaper med de høyeste nivåene av institusjonell akkumulering. Beregningsmodellen for poeng bruker en kombinasjon av den totale økningen i antall offentliggjorte eiere, endringer i porteføljeallokeringen til disse eierne og andre beregninger. Tallet går fra 0 til 100, der høyere tall indikerer en høyere grad av akkumulering i forhold til sammenlignbare selskaper, der 50 er gjennomsnittet.
Oppdateringsfrekvens: Daglig
Sjekk ut Ownership Explorer, som inneholder en liste over de høyest rangerte selskapene.
Institusjonell Put/Call-forhold
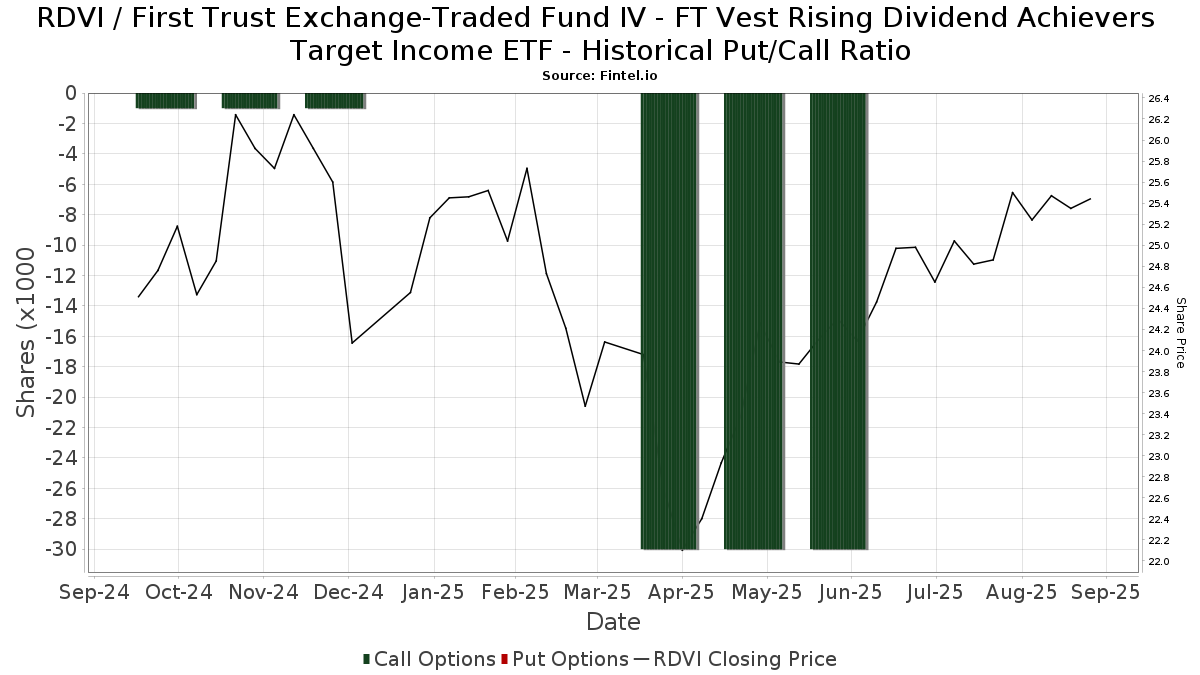
I tillegg til å rapportere standard aksje- og gjeldsemisjoner må institusjoner med mer enn 100 millioner kroner i forvaltningskapital også oppgi beholdningen av put- og callopsjoner. Siden put-opsjoner generelt indikerer et negativt sentiment, og call-opsjoner indikerer et positivt sentiment, kan vi få et inntrykk av det generelle institusjonelle sentimentet ved å plotte forholdet mellom put- og call-opsjoner. Diagrammet til høyre viser det historiske forholdet mellom put- og call-opsjoner for dette instrumentet.
Ved å bruke Put/Call-forholdet som en indikator på investorsentimentet kan man overvinne en av de viktigste svakhetene ved å bruke totalt institusjonelt eierskap, nemlig at en betydelig andel av forvaltningskapitalen investeres passivt for å følge indekser. Passivt forvaltede fond kjøper vanligvis ikke opsjoner, slik at indikatoren for put/call-forhold i større grad gjenspeiler stemningen i aktivt forvaltede fond.
13D/G-arkiveringer
Vi presenterer 13D/G-arkiveringene separat fra 13F-arkiveringene fordi de behandles forskjellig av SEC. 13D/G-arkiveringene kan sendes inn av grupper av investorer (med én leder), mens 13D/G-arkiveringene ikke kan sendes inn. Dette fører til situasjoner der en investor kan sende inn en 13D/G-rapport med én verdi for alle aksjene (som representerer alle aksjene som eies av investorgruppen), men deretter sende inn en 13F-melding med en annen verdi for alle aksjene (som kun representerer deres eget eierskap). Dette betyr at aksjeeierskap i 13D/G-arkiveringene og 13F-arkiveringene ofte ikke er direkte sammenlignbare, og vi presenterer dem derfor separat.
Merk: Fra og med 16. mai 2021 viser vi ikke lenger eiere som ikke har sendt inn en 13D/G i løpet av det siste året. Tidligere viste vi hele historikken for 13D/G-arkiveringer. Generelt må enheter som er pålagt å sende inn 13D/G-arkiveringer, sende inn minst én gang i året før de sender inn en avsluttende rapport. Det hender imidlertid at fond trekker seg ut av posisjoner uten å sende inn en avsluttende innlevering (dvs. at de avvikler), slik at visning av hele historikken av og til fører til forvirring om det nåværende eierskapet. For å unngå forvirring viser vi nå bare "nåværende" eiere, det vil si eiere som har sendt inn informasjon i løpet av det siste året.
Upgrade to unlock premium data.
| Fildato | Skjema | Investor | Tidligere aksjer |
Siste aksjer |
Δ Aksjer (prosent) |
Eierandel (prosent) |
Δ Eierandel (prosent) |
|
|---|---|---|---|---|---|---|---|---|
| 2025-07-28 | FIRST TRUST PORTFOLIOS LP | 11,406,060 | 14,677,593 | 28.68 | 17.82 | -13.91 |
13F- og NPORT-arkiveringer
Detaljer om 13F-arkiveringer er gratis. Detaljer om NP-arkiveringer krever et premium-medlemskap. Grønne rader indikerer nye posisjoner. Røde rader indikerer lukkede posisjoner. Klikk på lenke ikonet for å se hele transaksjonshistorikken.
Oppgrader
for å låse opp premiedata og eksportere til Excel. ![]() .
.
| Fildato | Kilde | Investor | Type | Gjennomsnittlig pris (estimert) |
Aksjer | Δ Aksjer (%) |
Rapportert verdi ($1000) | Verdi (%) | Portallokering (%) | |
|---|---|---|---|---|---|---|---|---|---|---|
| 2025-08-11 | 13F | Rothschild Investment Llc | 4 675 | 0,00 | 116 | 4,55 | ||||
| 2025-07-01 | 13F | Park National Corp /oh/ | 718 063 | 2,55 | 17 743 | 6,83 | ||||
| 2025-08-14 | 13F | Comerica Bank | 9 611 | 106,02 | 237 | 115,45 | ||||
| 2025-07-25 | 13F | Cwm, Llc | 64 942 | 4,53 | 2 | 0,00 | ||||
| 2025-08-12 | 13F | Integrated Advisors Network LLC | 26 019 | 643 | ||||||
| 2025-08-06 | 13F | Wedbush Securities Inc | 75 372 | 9,12 | 2 | 0,00 | ||||
| 2025-05-15 | 13F/A | Orion Portfolio Solutions, LLC | 45 305 | 62,37 | 1 075 | 58,88 | ||||
| 2025-07-11 | 13F | Farther Finance Advisors, LLC | 35 264 | 197,36 | 871 | 208,87 | ||||
| 2025-08-11 | 13F | Nations Financial Group Inc, /ia/ /adv | 34 979 | 36,69 | 864 | 42,34 | ||||
| 2025-08-12 | 13F | Cornerstone Wealth Management, LLC | 8 933 | 221 | ||||||
| 2025-08-11 | 13F | Principal Securities, Inc. | 305 342 | 5 571,29 | 7 545 | 5 703,85 | ||||
| 2025-05-16 | 13F/A | Kestra Investment Management, LLC | 0 | −100,00 | 0 | |||||
| 2025-07-24 | 13F | Endeavor Private Wealth, Inc. | 12 995 | 321 | ||||||
| 2025-07-16 | 13F | Beaumont Financial Advisors, LLC | 508 460 | 12 564 | ||||||
| 2025-07-23 | 13F | Steel Peak Wealth Management LLC | 33 129 | −26,79 | 819 | −23,77 | ||||
| 2025-08-08 | 13F | Comprehensive Financial Planning, Inc./PA | 43 270 | 4,59 | 1 069 | 8,97 | ||||
| 2025-07-08 | 13F | Zrc Wealth Management, Llc | 2 053 | 0,00 | 51 | 4,17 | ||||
| 2025-07-29 | 13F | Kraft, Davis & Associates, LLC | 8 361 | 209 | ||||||
| 2025-07-23 | 13F | RiverTree Advisors, LLC | 106 154 | 2 623 | ||||||
| 2025-08-11 | 13F | Semus Wealth Partners LLC | 119 335 | 3,45 | 2 949 | 7,75 | ||||
| 2025-07-09 | 13F | Triumph Capital Management | 66 303 | 1 638 | ||||||
| 2025-08-08 | 13F | Larson Financial Group LLC | 1 843 | 1,10 | 46 | 4,65 | ||||
| 2025-08-13 | 13F | Truvestments Capital Llc | 69 388 | −14,86 | 1 715 | −11,33 | ||||
| 2025-08-29 | 13F | Centaurus Financial, Inc. | 35 003 | 25,92 | 1 | |||||
| 2025-07-17 | 13F | Nelson, Van Denburg & Campbell Wealth Management Group, LLC | 29 521 | −0,15 | 729 | 3,99 | ||||
| 2025-08-14 | 13F | Qube Research & Technologies Ltd | 0 | −100,00 | 0 | |||||
| 2025-08-14 | 13F | Harvest Investment Services, LLC | 50 633 | −22,18 | 1 251 | −18,92 | ||||
| 2025-07-10 | 13F | Marshall Financial Group LLC | 44 426 | 18,32 | 1 104 | 24,04 | ||||
| 2025-07-25 | 13F | Prostatis Group LLC | 161 224 | 11,27 | 3 984 | 15,89 | ||||
| 2025-05-15 | 13F | Talon Private Wealth, LLC | 0 | −100,00 | 0 | −100,00 | ||||
| 2025-08-06 | 13F | Centerpoint Advisory Group | 26 685 | 659 | ||||||
| 2025-07-30 | 13F/A | KPP Advisory Services LLC | 88 130 | 2,07 | 2 178 | 6,30 | ||||
| 2025-07-10 | 13F | Secure Asset Management, LLC | 0 | −100,00 | 0 | |||||
| 2025-07-28 | 13F | RFG Advisory, LLC | 134 626 | 46,37 | 3 327 | 52,50 | ||||
| 2025-08-11 | 13F | Tidemark, LLC | 34 275 | 72,91 | 847 | 80,00 | ||||
| 2025-08-08 | 13F/A | Prospect Financial Services LLC | 8 578 | 212 | ||||||
| 2025-08-11 | 13F | Plotkin Financial Advisors, LLC | 33 857 | 13,77 | 837 | 18,58 | ||||
| 2025-07-29 | 13F | Balboa Wealth Partners | 81 588 | 59,20 | 2 016 | 65,93 | ||||
| 2025-08-13 | 13F | VestGen Advisors, LLC | 534 906 | 9,70 | 13 218 | 14,28 | ||||
| 2025-08-14 | 13F | CoreCap Advisors, LLC | 37 621 | 32,40 | 930 | 37,83 | ||||
| 2025-05-07 | 13F | Inspire Advisors, LLC | 0 | −100,00 | 0 | |||||
| 2025-07-25 | 13F | We Are One Seven, LLC | 22 160 | 0,14 | 548 | 4,39 | ||||
| 2025-07-16 | 13F | Novem Group | 18 302 | −15,60 | 452 | −12,06 | ||||
| 2025-07-30 | 13F | Brookstone Capital Management | 62 875 | 44,37 | 1 554 | 50,34 | ||||
| 2025-09-09 | 13F | NWF Advisory Services Inc. | 8 500 | 210 | ||||||
| 2025-08-12 | 13F | Founders Financial Alliance, LLC | 0 | −100,00 | 0 | |||||
| 2025-05-13 | 13F | BlackDiamond Wealth Management Inc. | 0 | −100,00 | 0 | |||||
| 2025-08-08 | 13F | Capital Investment Advisory Services, LLC | 148 096 | 7,57 | 3 659 | 12,07 | ||||
| 2025-07-22 | 13F | Luken Investment Analytics, LLC | 476 310 | −28,76 | 11 770 | −25,79 | ||||
| 2025-08-14 | 13F | Fwl Investment Management, Llc | 0 | −100,00 | 0 | |||||
| 2025-08-14 | 13F | Goldman Sachs Group Inc | 0 | −100,00 | 0 | |||||
| 2025-09-04 | 13F/A | Advisor Group Holdings, Inc. | 1 206 446 | 2,94 | 29 812 | 7,24 | ||||
| 2025-08-12 | 13F | LPL Financial LLC | 7 805 040 | 13,29 | 192 863 | 18,02 | ||||
| 2025-04-28 | 13F | Strategic Financial Concepts, LLC | 0 | −100,00 | 0 | −100,00 | ||||
| 2025-08-04 | 13F | Arkadios Wealth Advisors | 45 444 | 16,39 | 1 123 | 21,17 | ||||
| 2025-08-14 | 13F | Ambassador Advisors, LLC | 17 859 | 3,33 | 441 | 7,82 | ||||
| 2025-08-08 | 13F | Foundations Investment Advisors, LLC | 17 081 | −72,67 | 422 | −71,52 | ||||
| 2025-08-12 | 13F | Proequities, Inc. | 0 | 0 | ||||||
| 2025-04-10 | 13F | Key Client Fiduciary Advisors, LLC | 0 | −100,00 | 0 | |||||
| 2025-08-05 | 13F | Atlas Wealth LLC | 113 306 | 0,66 | 2 827 | 5,88 | ||||
| 2025-08-12 | 13F | Insigneo Advisory Services, Llc | 26 716 | 21,35 | 660 | 26,44 | ||||
| 2025-08-01 | 13F | Belvedere Trading LLC | Call | 10 100 | 250 | |||||
| 2025-08-07 | 13F | Kestra Private Wealth Services, Llc | 65 376 | 12,96 | 1 615 | 17,71 | ||||
| 2025-07-17 | 13F | Janney Montgomery Scott LLC | 575 752 | 14,30 | 14 | 27,27 | ||||
| 2025-07-22 | 13F | Wealthcare Advisory Partners LLC | 20 782 | 514 | ||||||
| 2025-08-14 | 13F | Herold Advisors, Inc. | 31 958 | −38,95 | 790 | −36,42 | ||||
| 2025-08-15 | 13F | Morgan Stanley | 12 692 | 0,87 | 314 | 5,03 | ||||
| 2025-08-04 | 13F | Daymark Wealth Partners, Llc | 22 340 | 149,66 | 552 | 160,38 | ||||
| 2025-08-06 | 13F | Commonwealth Equity Services, Llc | 1 826 770 | 7,46 | 45 | 12,50 | ||||
| 2025-08-12 | 13F | Calton & Associates, Inc. | 38 662 | 63,59 | 955 | 70,54 | ||||
| 2025-07-31 | 13F | Oppenheimer & Co Inc | 92 544 | 167,72 | 2 287 | 179,12 | ||||
| 2025-08-14 | 13F | Great Valley Advisor Group, Inc. | 18 138 | 15,36 | 448 | 20,16 | ||||
| 2025-08-15 | 13F | Kestra Advisory Services, LLC | 645 042 | 37,36 | 15 939 | 43,08 | ||||
| 2025-04-25 | 13F | Smallwood Wealth Investment Management, LLC | 2 000 | 47 | ||||||
| 2025-08-11 | 13F | Western Wealth Management, LLC | 44 873 | 0,37 | 1 109 | 4,53 | ||||
| 2025-08-13 | 13F | Virtue Capital Management, LLC | 0 | −100,00 | 0 | |||||
| 2025-08-01 | 13F | Envestnet Asset Management Inc | 613 236 | −62,97 | 15 153 | −61,43 | ||||
| 2025-07-22 | 13F | Comprehensive Financial Consultants Institutional, Inc. | 15 952 | 0,00 | 394 | 4,23 | ||||
| 2025-07-30 | 13F | Rehmann Capital Advisory Group | 97 702 | 11,11 | 2 414 | 15,78 | ||||
| 2025-07-30 | 13F | TFB Advisors LLC | 10 732 | 265 | ||||||
| 2025-08-08 | 13F/A | Ignite Planners, LLC | 10 169 | 10,99 | 252 | 20,00 | ||||
| 2025-08-18 | 13F | Arq Wealth Advisors, Llc | 109 947 | 0,00 | 2 608 | 0,00 | ||||
| 2025-08-14 | 13F | Sequent Planning LLC | 57 286 | 5,88 | 1 416 | 10,29 | ||||
| 2025-07-30 | 13F | Insight Advisors, LLC/ PA | 44 394 | 2,67 | 1 097 | 6,93 | ||||
| 2025-08-04 | 13F | Bay Colony Advisory Group, Inc d/b/a Bay Colony Advisors | 8 263 | 204 | ||||||
| 2025-08-11 | 13F | Synergy Investment Management, LLC | 0 | −100,00 | 0 | |||||
| 2025-07-21 | 13F | Ameritas Advisory Services, LLC | 56 365 | −8,17 | 1 393 | −5,05 | ||||
| 2025-07-10 | 13F | Kozak & Associates, Inc. | 846 | 2,17 | 21 | 16,67 | ||||
| 2025-08-12 | 13F | Steward Partners Investment Advisory, Llc | 105 675 | 23,14 | 2 611 | 28,30 | ||||
| 2025-08-14 | 13F | Stifel Financial Corp | 2 142 991 | 45,52 | 52 953 | 51,59 | ||||
| 2025-08-07 | 13F | Argent Advisors, Inc. | 386 701 | −2,84 | 9 555 | 1,22 | ||||
| 2025-05-07 | 13F | Spectrum Wealth Counsel, LLC | 1 061 445 | 1,05 | 25 177 | −1,12 | ||||
| 2025-08-14 | 13F | Fmr Llc | 0 | −100,00 | 0 | |||||
| 2025-07-16 | 13F | ORG Partners LLC | 5 000 | −37,50 | 125 | −34,74 | ||||
| 2025-08-12 | 13F | Winnow Wealth Llc | 0 | −100,00 | 0 | −100,00 | ||||
| 2025-08-06 | 13F | AE Wealth Management LLC | 19 853 | 32,96 | 491 | 38,42 | ||||
| 2025-07-25 | 13F | Second Half Financial Partners, LLC | 634 190 | 2,22 | 15 671 | 6,48 | ||||
| 2025-08-11 | 13F | Regal Investment Advisors LLC | 29 767 | 736 | ||||||
| 2025-08-14 | 13F | Integrated Wealth Concepts LLC | 315 465 | −1,26 | 7 795 | 2,86 | ||||
| 2025-08-13 | 13F | Smith, Moore & Co. | 14 209 | −0,41 | 351 | 3,85 | ||||
| 2025-07-23 | 13F | Clear Creek Financial Management, LLC | 10 530 | 22,16 | 260 | 27,45 | ||||
| 2025-08-12 | 13F | Resolute Wealth Strategies, LLC | 49 043 | 11,62 | 1 212 | 16,22 | ||||
| 2025-07-18 | 13F | Midwest Financial Group LLC | 108 595 | −53,09 | 2 683 | −51,14 | ||||
| 2025-08-19 | 13F | Newbridge Financial Services Group, Inc. | 43 266 | 1 069 | ||||||
| 2025-08-14 | 13F | Old Mission Capital Llc | 31 007 | 766 | ||||||
| 2025-08-11 | 13F | Mach-1 Financial Group, Inc. | 8 793 | 217 | ||||||
| 2025-08-05 | 13F | Milestone Asset Management, Llc | 40 171 | 47,52 | 993 | 53,80 | ||||
| 2025-07-24 | 13F | Aurora Private Wealth, Inc. | 74 971 | 143,01 | 2 | |||||
| 2025-08-14 | 13F | Harwood Advisory Group, LLC | 14 823 | 36,40 | 366 | 39,16 | ||||
| 2025-07-31 | 13F | Whipplewood Advisors, LLC | 128 883 | 2 526,51 | 3 185 | 10,71 | ||||
| 2025-07-17 | 13F | Global Trust Asset Management, LLC | 0 | −100,00 | 0 | |||||
| 2025-08-06 | 13F | Legacy Investment Solutions, LLC | 27 523 | 65,67 | 680 | 62,29 | ||||
| 2025-08-25 | NP | FTBI - First Trust Balanced Income ETF | 8 319 | 206 | ||||||
| 2025-08-01 | 13F | Delta Investment Management, LLC | 79 777 | 10,97 | 1 971 | 15,60 | ||||
| 2025-08-14 | 13F | Snowden Capital Advisors LLC | 134 011 | 2,48 | 3 311 | 6,77 | ||||
| 2025-04-23 | 13F | Golden State Wealth Management, LLC | 0 | −100,00 | 0 | |||||
| 2025-07-29 | 13F | Stratos Wealth Partners, LTD. | 163 639 | 591,57 | 4 044 | 620,68 | ||||
| 2025-08-04 | 13F | L.m. Kohn & Company | 13 520 | 334 | ||||||
| 2025-08-14 | 13F | IHT Wealth Management, LLC | 75 319 | 115,13 | 1 861 | 124,22 | ||||
| 2025-08-01 | 13F | Chilton Capital Management Llc | 27 862 | 1,76 | 688 | 6,01 | ||||
| 2025-08-01 | 13F | Ashton Thomas Private Wealth, LLC | 49 028 | 0,36 | 1 211 | 4,58 | ||||
| 2025-07-21 | 13F | Patriot Financial Group Insurance Agency, LLC | 144 676 | 18,56 | 3 575 | 23,50 | ||||
| 2025-08-13 | 13F | Cresset Asset Management, LLC | 9 198 | 227 | ||||||
| 2025-07-30 | 13F | Prosperity Financial Group, Inc. | 140 889 | 8,27 | 3 481 | 12,80 | ||||
| 2025-08-12 | 13F | Jpmorgan Chase & Co | 382 | −88,31 | 9 | −88,31 | ||||
| 2025-08-14 | 13F | GWM Advisors LLC | 167 898 | −19,45 | 4 149 | −16,10 | ||||
| 2025-07-22 | 13F | Echo Wealth Management, LLC | 334 806 | −0,20 | 8 273 | 3,97 | ||||
| 2025-07-22 | 13F | Global Assets Advisory, LLC | 34 775 | −67,76 | 868 | −64,22 | ||||
| 2025-07-30 | 13F | Retirement Planning Group | 53 867 | 21,96 | 1 331 | 27,13 | ||||
| 2025-08-05 | 13F | GPS Wealth Strategies Group, LLC | 58 683 | 16,42 | 1 450 | 21,34 | ||||
| 2025-08-08 | 13F | Financial Gravity Companies, Inc. | 0 | −100,00 | 0 | |||||
| 2025-07-23 | 13F | Prime Capital Investment Advisors, LLC | 564 607 | 3 213,42 | 13 951 | 3 353,22 | ||||
| 2025-08-07 | 13F | Allworth Financial LP | 1 617 | 40 | ||||||
| 2025-08-04 | 13F | Hantz Financial Services, Inc. | 163 | 0,00 | 0 | |||||
| 2025-08-12 | 13F | O'shaughnessy Asset Management, Llc | 28 | −85,34 | 1 | −100,00 | ||||
| 2025-07-25 | 13F | Hazlett, Burt & Watson, Inc. | 2 874 | 60,38 | 0 | |||||
| 2025-08-05 | 13F | Sigma Planning Corp | 33 504 | −50,66 | 828 | −48,63 | ||||
| 2025-08-08 | 13F | Cooper Capital Advisors LLC | 291 424 | 7 201 | ||||||
| 2025-08-14 | 13F | Sunbelt Securities, Inc. | 17 037 | −1,89 | 413 | 0,24 | ||||
| 2025-08-18 | 13F | Tyler-Stone Wealth Management | 29 601 | 8,78 | 731 | 13,33 | ||||
| 2025-05-12 | 13F | Simplex Trading, Llc | 0 | −100,00 | 0 | |||||
| 2025-07-24 | 13F | SLT Holdings LLC | 0 | −100,00 | 0 | |||||
| 2025-07-25 | 13F | Envestnet Portfolio Solutions, Inc. | 0 | −100,00 | 0 | |||||
| 2025-08-13 | 13F | WCG Wealth Advisors LLC | 0 | −100,00 | 0 | |||||
| 2025-08-08 | 13F | Hartland & Co., LLC | 1 053 | 0,00 | 26 | 8,33 | ||||
| 2025-07-22 | 13F | Accel Wealth Management | 12 352 | 4,58 | 305 | 8,93 | ||||
| 2025-07-09 | 13F | Tounjian Advisory Partners, Llc | 11 665 | 0,00 | 277 | 0,00 | ||||
| 2025-05-12 | 13F | Independent Advisor Alliance | 0 | −100,00 | 0 | |||||
| 2025-08-04 | 13F | Northwest Financial Advisors | 8 516 | 210 | ||||||
| 2025-08-14 | 13F | Wells Fargo & Company/mn | 2 371 052 | 13,50 | 58 589 | 18,24 | ||||
| 2025-08-12 | 13F | SRS Capital Advisors, Inc. | 685 753 | 30,68 | 16 945 | 36,13 | ||||
| 2025-07-25 | 13F | Apollon Wealth Management, LLC | 15 244 | 0,00 | 377 | 4,16 | ||||
| 2025-05-15 | 13F | Citadel Advisors Llc | 0 | −100,00 | 0 | −100,00 | ||||
| 2025-07-14 | 13F | IronOak Wealth LLC. | 0 | −100,00 | 0 | |||||
| 2025-08-14 | 13F | Raymond James Financial Inc | 2 589 340 | 18,69 | 63 983 | 23,64 | ||||
| 2025-07-24 | 13F | WMG Financial Advisors, LLC | 25 097 | 620 | ||||||
| 2025-08-08 | 13F | Kingsview Wealth Management, LLC | 189 271 | 13,40 | 4 677 | 18,11 | ||||
| 2025-08-04 | 13F | Atria Investments Llc | 13 997 | −9,81 | 346 | −6,25 | ||||
| 2025-08-14 | 13F | Susquehanna International Group, Llp | 121 952 | 107,82 | 3 013 | 116,61 | ||||
| 2025-04-30 | 13F | POM Investment Strategies, LLC | 0 | −100,00 | 0 | |||||
| 2025-07-30 | 13F | D.a. Davidson & Co. | 98 553 | 7,73 | 2 435 | 12,26 | ||||
| 2025-08-08 | 13F | Cetera Investment Advisers | 1 521 561 | 11,69 | 37 598 | 16,35 | ||||
| 2025-07-17 | 13F | Wagner Wealth Management, Llc | 1 745 | 1,99 | 43 | 7,50 | ||||
| 2025-07-29 | 13F | International Assets Investment Management, Llc | 52 300 | 20,65 | 1 292 | 25,68 | ||||
| 2025-08-26 | 13F/A | Thrivent Financial For Lutherans | 35 109 | 4,17 | 1 | |||||
| 2025-07-17 | 13F | G&S Capital LLC | 132 218 | 1,17 | 3 267 | 5,42 | ||||
| 2025-08-14 | 13F/A | Rockefeller Capital Management L.P. | 147 119 | 14,30 | 3 635 | 19,06 | ||||
| 2025-08-14 | 13F | Mariner, LLC | 310 752 | 27,78 | 7 679 | 33,11 | ||||
| 2025-08-14 | 13F | Wiley Bros.-aintree Capital, Llc | 26 522 | −86,85 | 655 | −86,18 | ||||
| 2025-07-21 | 13F | Barrett & Company, Inc. | 4 875 | 120 | ||||||
| 2025-08-06 | 13F | Cherry Creek Investment Advisors, Inc. | 9 674 | −0,30 | 239 | 3,91 | ||||
| 2025-08-14 | 13F | Synovus Financial Corp | 64 967 | 443,43 | 1 605 | 467,14 | ||||
| 2025-07-08 | 13F | Nbc Securities, Inc. | 10 874 | 0,74 | 0 | |||||
| 2025-07-16 | 13F | Maridea Wealth Management LLC | 89 941 | 2 222 | ||||||
| 2025-07-31 | 13F | Cambridge Investment Research Advisors, Inc. | 687 426 | 2,36 | 17 | 6,67 | ||||
| 2025-08-13 | 13F | Level Four Advisory Services, Llc | 14 186 | 11,00 | 351 | 15,51 | ||||
| 2025-07-23 | 13F | REAP Financial Group, LLC | 0 | −100,00 | 0 | |||||
| 2025-07-31 | 13F | Moloney Securities Asset Management, LLC | 58 620 | 3,65 | 1 448 | 7,98 | ||||
| 2025-07-24 | 13F | IFP Advisors, Inc | 74 071 | −7,18 | 1 830 | −3,28 | ||||
| 2025-08-06 | 13F | Prospera Financial Services Inc | 683 304 | 17,67 | 16 890 | 22,58 | ||||
| 2025-08-12 | 13F | Gladstone Institutional Advisory LLC | 13 785 | −18,33 | 341 | −15,00 | ||||
| 2025-07-24 | 13F | Ronald Blue Trust, Inc. | 500 | −77,92 | 12 | −78,18 | ||||
| 2025-08-06 | 13F | Moors & Cabot, Inc. | 17 782 | 2,27 | 439 | 6,55 | ||||
| 2025-08-19 | 13F | Advisory Services Network, LLC | 16 209 | 31,78 | 401 | 37,46 | ||||
| 2025-07-30 | 13F | BlueChip Wealth Advisors LLC | 19 324 | 0,00 | 477 | 4,15 | ||||
| 2025-07-29 | 13F | Private Trust Co Na | 24 036 | −3,03 | 594 | 1,02 | ||||
| 2025-07-16 | 13F | Formidable Asset Management, LLC | 9 475 | 0,00 | 225 | 0,00 | ||||
| 2025-08-14 | 13F | Acorn Wealth Advisors, LLC | 15 174 | 0,46 | 375 | 4,47 | ||||
| 2025-07-28 | 13F | Harbour Investments, Inc. | 564 819 | 10,32 | 13 957 | 14,92 | ||||
| 2025-08-04 | 13F | Spire Wealth Management | 0 | −100,00 | 0 | |||||
| 2025-07-25 | 13F | Atria Wealth Solutions, Inc. | 82 162 | 3,60 | 2 030 | 7,92 | ||||
| 2025-08-14 | 13F | Benjamin Edwards Inc | 9 620 | 238 | ||||||
| 2025-08-12 | 13F | Change Path, LLC | 37 076 | −24,08 | 916 | −20,90 | ||||
| 2025-08-08 | 13F | Avantax Advisory Services, Inc. | 179 318 | −1,36 | 4 431 | 2,74 | ||||
| 2025-08-19 | 13F | National Asset Management, Inc. | 13 986 | −95,77 | 346 | −95,69 | ||||
| 2025-08-04 | 13F | IFG Advisory, LLC | 17 146 | 424 | ||||||
| 2025-08-11 | 13F | Aptus Capital Advisors, LLC | 7 000 | 0,00 | 173 | 3,61 | ||||
| 2025-08-13 | 13F | StoneX Group Inc. | 93 331 | 3,61 | 2 306 | 7,96 | ||||
| 2025-07-18 | 13F | Truist Financial Corp | 187 433 | −85,94 | 4 631 | −85,36 | ||||
| 2025-08-04 | 13F | Creekmur Asset Management LLC | 1 916 | 2,13 | 47 | 6,82 | ||||
| 2025-08-13 | 13F | Capital Analysts, Inc. | 87 484 | −0,61 | 2 | 0,00 | ||||
| 2025-08-06 | 13F | Walkner Condon Financial Advisors LLC | 9 750 | −26,69 | 241 | −23,81 | ||||
| 2025-04-21 | 13F | MN Wealth Advisors, LLC | 0 | −100,00 | 0 | |||||
| 2025-08-15 | 13F | First Heartland Consultants, Inc. | 16 744 | −5,93 | 414 | −2,13 | ||||
| 2025-07-08 | 13F | Next Level Private LLC | 25 106 | −9,84 | 620 | −6,06 | ||||
| 2025-08-05 | 13F | Lifeworks Advisors, LLC | 55 852 | −4,20 | 1 380 | −0,14 | ||||
| 2025-07-02 | 13F | HBW Advisory Services LLC | 12 012 | 0,00 | 297 | 4,23 | ||||
| 2025-07-15 | 13F | Clarus Group, Inc. | 433 007 | 10 700 | ||||||
| 2025-07-28 | 13F | BRYN MAWR TRUST Co | 12 962 | 31,02 | 320 | 36,75 | ||||
| 2025-07-30 | 13F | Avidian Wealth Solutions, LLC | 32 757 | −7,83 | 809 | −3,92 | ||||
| 2025-08-07 | 13F | Pinnacle Wealth Management Advisory Group, LLC | 318 232 | 8,16 | 7 864 | 12,68 | ||||
| 2025-08-11 | 13F | Core Wealth Partners LLC | 25 258 | 74,97 | 624 | 82,46 | ||||
| 2025-08-14 | 13F | Mml Investors Services, Llc | 37 782 | −23,32 | 1 | −100,00 | ||||
| 2025-08-06 | 13F | Stonebridge Financial Planning Group, LLC | 68 696 | 8,28 | 1 697 | 12,83 | ||||
| 2025-08-18 | 13F | N.E.W. Advisory Services LLC | 0 | −100,00 | 0 | |||||
| 2025-07-09 | 13F | Beacon Financial Group | 54 880 | −0,23 | 1 356 | 3,99 | ||||
| 2025-08-11 | 13F | Private Advisor Group, LLC | 142 300 | −9,01 | 3 516 | −5,20 | ||||
| 2025-05-14 | 13F | Triad Wealth Partners, LLC | 0 | −100,00 | 0 | |||||
| 2025-08-14 | 13F | Citadel Advisors Llc | Call | 20 200 | 499 | |||||
| 2025-07-30 | 13F | IMG Wealth Management, Inc. | 2 253 | 31,37 | 56 | 37,50 | ||||
| 2025-08-14 | 13F | Marshall Investment Management, Llc | 0 | −100,00 | 0 | |||||
| 2025-07-23 | 13F | Tcfg Wealth Management, Llc | 16 729 | 0,00 | 413 | 4,29 | ||||
| 2025-04-30 | 13F | Sofos Investments, Inc. | 0 | −100,00 | 0 | |||||
| 2025-07-23 | 13F | Trueblood Wealth Management, LLC | 130 488 | 5,60 | 3 224 | 10,03 | ||||
| 2025-08-14 | 13F | Main Street Financial Solutions, LLC | 20 286 | 0,21 | 501 | 4,38 | ||||
| 2025-07-21 | 13F | Ashton Thomas Securities, Llc | 12 225 | 32,52 | 302 | 38,53 | ||||
| 2025-07-03 | 13F | TrueWealth Advisors, LLC | 37 736 | 2,04 | 932 | 6,27 | ||||
| 2025-07-14 | 13F | U.S. Capital Wealth Advisors, LLC | 16 495 | −0,15 | 408 | 4,09 | ||||
| 2025-08-12 | 13F | J.w. Cole Advisors, Inc. | 118 014 | 34,04 | 2 916 | 39,66 | ||||
| 2025-07-29 | 13F | Stephens Inc /ar/ | 98 235 | 4,96 | 2 427 | 9,32 | ||||
| 2025-05-12 | 13F | Sandy Spring Bank | 56 350 | 0,62 | 1 337 | −1,55 | ||||
| 2025-07-11 | 13F | Quad-Cities Investment Group, LLC | 54 793 | 7,66 | 1 354 | 12,10 | ||||
| 2025-07-17 | 13F | Greenleaf Trust | 0 | −100,00 | 0 | |||||
| 2025-08-13 | 13F | First Trust Advisors Lp | 27 782 | 686 | ||||||
| 2025-08-14 | 13F | Colony Group, LLC | 857 825 | 21 197 | ||||||
| 2025-08-13 | 13F | Gateway Wealth Partners, LLC | 166 853 | 2,72 | 4 123 | 7,01 | ||||
| 2025-08-14 | 13F | Royal Bank Of Canada | 1 849 080 | 10,54 | 45 691 | 15,15 | ||||
| 2025-08-13 | 13F | Baird Financial Group, Inc. | 1 020 175 | 10,32 | 25 209 | 14,93 | ||||
| 2025-07-16 | 13F | Owen LaRue, LLC | 62 136 | −34,78 | 1 535 | −32,05 | ||||
| 2025-08-04 | 13F | Pinnacle Associates Ltd | 772 479 | 5,57 | 19 088 | 9,97 | ||||
| 2025-08-14 | 13F | Warren Averett Asset Management, LLC | 22 251 | 1,35 | 550 | 5,58 | ||||
| 2025-08-13 | 13F | EverSource Wealth Advisors, LLC | 33 125 | 14,31 | 819 | 19,07 | ||||
| 2025-08-15 | 13F | Asset Allocation Strategies LLC | 26 251 | 649 | ||||||
| 2025-08-14 | 13F | EP Wealth Advisors, Inc. | 9 650 | 238 | ||||||
| 2025-08-04 | 13F | Econ Financial Services Corp | 62 530 | −6,04 | 1 545 | −2,09 | ||||
| 2025-07-08 | 13F | Adamsbrown Wealth Consultants Llc | 541 004 | 15,37 | 13 368 | 20,18 | ||||
| 2025-08-18 | 13F | Geneos Wealth Management Inc. | 3 044 | 18,81 | 75 | 25,00 | ||||
| 2025-08-13 | 13F | Transce3nd, LLC | 0 | −100,00 | 0 | |||||
| 2025-07-21 | 13F | DHJJ Financial Advisors, Ltd. | 8 482 | −15,70 | 210 | −12,18 | ||||
| 2025-08-14 | 13F | Ausdal Financial Partners, Inc. | 64 656 | 1,75 | 1 598 | 5,97 | ||||
| 2025-08-01 | 13F | Brookwood Investment Group LLC | 8 813 | 0,40 | 218 | 4,33 | ||||
| 2025-08-13 | 13F | Raab & Moskowitz Asset Management LLC | 20 500 | 0,00 | 507 | 4,12 | ||||
| 2025-08-14 | 13F | Guardian Wealth Advisors, Llc / Nc | 7 000 | 0,00 | 173 | 3,61 | ||||
| 2025-07-10 | 13F | Wealth Enhancement Advisory Services, Llc | 591 620 | 6,81 | 14 814 | 12,76 | ||||
| 2025-08-14 | 13F | Atomi Financial Group, Inc. | 43 266 | −3,79 | 1 069 | 0,28 | ||||
| 2025-07-18 | 13F | QTR Family Wealth, LLC | 24 418 | 4,97 | 603 | 9,44 | ||||
| 2025-07-22 | 13F | Hickory Asset Management, Inc. | 9 769 | −4,61 | 241 | −0,41 | ||||
| 2025-05-14 | 13F | Summit Financial Wealth Advisors, LLC | 347 949 | 9,61 | 8 253 | 2,85 | ||||
| 2025-07-11 | 13F | Seacrest Wealth Management, Llc | 0 | −100,00 | 0 | |||||
| 2025-08-06 | 13F | Legacy Wealth Managment, LLC/ID | 27 523 | 33,41 | 680 | 39,06 | ||||
| 2025-08-06 | 13F | TKG Advisors, LLC | 19 579 | 10,71 | 484 | 15,27 | ||||
| 2025-07-25 | 13F | Total Clarity Wealth Management, Inc. | 16 305 | 0,00 | 403 | 1,77 | ||||
| 2025-05-13 | 13F | Quadrature Capital Ltd | 0 | −100,00 | 0 | |||||
| 2025-08-06 | 13F | Atlantic Union Bankshares Corp | 56 223 | 1 389 | ||||||
| 2025-08-12 | 13F | Global Retirement Partners, LLC | 328 | 8 | ||||||
| 2025-08-27 | 13F/A | Brinker Capital Investments, LLC | 55 708 | 22,96 | 1 377 | 28,12 | ||||
| 2025-07-25 | 13F | Concurrent Investment Advisors, LLC | 228 560 | 19,19 | 5 648 | 24,16 | ||||
| 2025-08-08 | 13F | Creative Planning | 55 758 | 0,00 | 1 378 | 4,16 | ||||
| 2025-08-14 | 13F | Visionary Wealth Advisors | 8 480 | 210 | ||||||
| 2025-08-05 | 13F | Atlas Private Wealth Advisors | 903 006 | 69,69 | 22 313 | 76,78 | ||||
| 2025-08-15 | 13F | Equitable Holdings, Inc. | 56 320 | 26,49 | 1 392 | 31,72 | ||||
| 2025-08-14 | 13F | Garden State Investment Advisory Services LLC | 30 511 | −5,33 | 754 | −1,44 | ||||
| 2025-08-14 | 13F | Bank Of America Corp /de/ | 32 293 | −1,88 | 798 | 2,18 | ||||
| 2025-08-20 | 13F/A | Coppell Advisory Solutions LLC | 135 223 | 628,45 | 3 325 | 684,20 | ||||
| 2025-07-11 | 13F | SILVER OAK SECURITIES, Inc | 344 821 | 30,77 | 8 521 | 37,51 | ||||
| 2025-07-15 | 13F | BKA Wealth Consulting, Inc. | 65 345 | 17,44 | 1 615 | 22,37 | ||||
| 2025-07-16 | 13F | Independent Wealth Network Inc. | 17 254 | 2,01 | 426 | 6,23 | ||||
| 2025-08-08 | 13F | SBI Securities Co., Ltd. | 1 457 | −17,03 | 36 | −12,20 | ||||
| 2025-08-11 | 13F | HighTower Advisors, LLC | 282 398 | 0,77 | 6 978 | 4,98 | ||||
| 2025-08-14 | 13F | Jane Street Group, Llc | 17 163 | −84,51 | 424 | −83,87 | ||||
| 2025-08-08 | 13F | MTM Investment Management, LLC | 49 662 | 0,00 | 1 227 | 3,90 | ||||
| 2025-07-22 | 13F | Ergawealth Advisors, Inc. | 191 905 | −25,00 | 4 742 | −21,88 | ||||
| 2025-05-14 | 13F | Luminist Capital LLC | 0 | −100,00 | 0 | |||||
| 2025-08-08 | 13F | Good Life Advisors, LLC | 296 484 | 11,70 | 7 326 | 16,36 |