Grunnleggende statistikk
| Institusjonelle eiere | 114 total, 114 long only, 0 short only, 0 long/short - change of −1,72% MRQ |
| Gjennomsnittlig porteføljeallokering | 0.0621 % - change of −10,09% MRQ |
| Institusjonelle aksjer (Long) | 6 163 643 (ex 13D/G) - change of 0,14MM shares 2,33% MRQ |
| Institusjonell verdi (Long) | $ 287 368 USD ($1000) |
Institusjonelt eierskap og aksjonærer
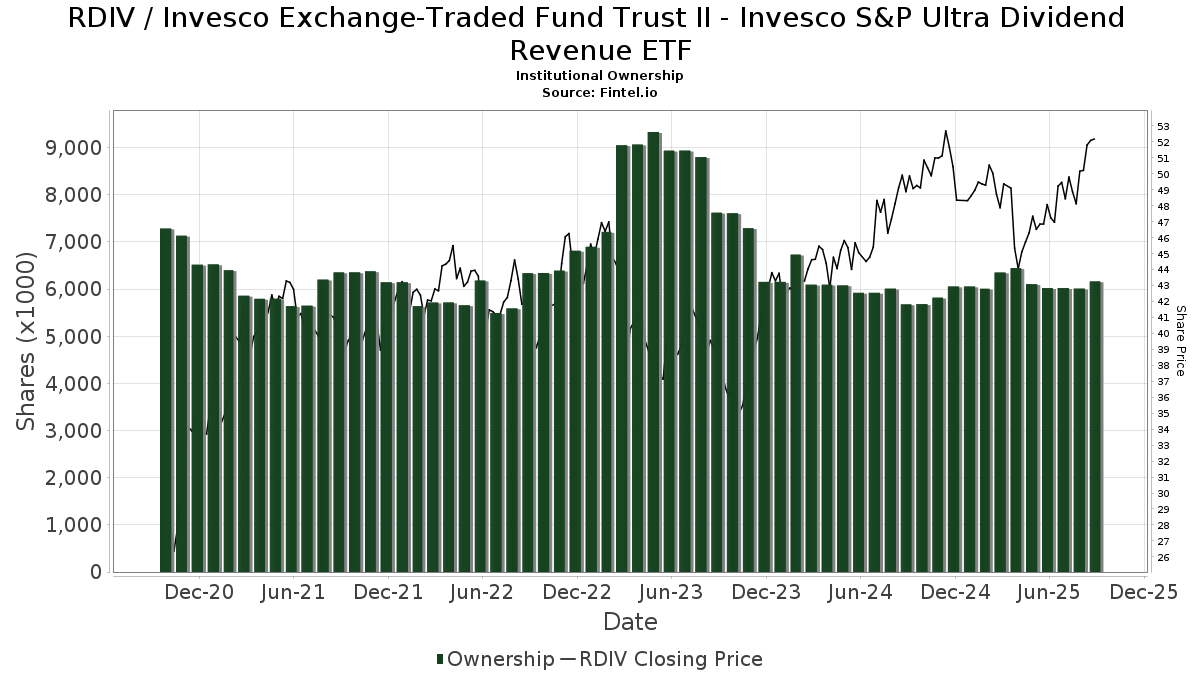
Invesco Exchange-Traded Fund Trust II - Invesco S&P Ultra Dividend Revenue ETF (US:RDIV) har 114 institusjonelle eiere og aksjonærer som har sendt inn 13D/G- eller 13F-skjemaer til Securities Exchange Commission (SEC). Disse institusjonene eier til sammen 6,163,643 aksjer. De største aksjonærene inkluderer Morgan Stanley, Heartwood Wealth Advisors LLC, LPL Financial LLC, Bank Of America Corp /de/, Wells Fargo & Company/mn, Stifel Financial Corp, Ameriprise Financial Inc, Advisor Group Holdings, Inc., Raymond James Financial Inc, and Northwestern Mutual Wealth Management Co .
Invesco Exchange-Traded Fund Trust II - Invesco S&P Ultra Dividend Revenue ETF (ARCA:RDIV) institusjonell eierstruktur viser nåværende posisjoner i selskapet fordelt på institusjoner og fond, samt de siste endringene i posisjonsstørrelse. De største aksjonærene kan være individuelle investorer, verdipapirfond, hedgefond eller institusjoner. Schedule 13D indikerer at investoren eier (eller har eid) mer enn 5 % av selskapet og har til hensikt (eller hadde til hensikt) å aktivt forfølge en endring i forretningsstrategien. Schedule 13G indikerer en passiv investering på over 5 %.
The share price as of September 9, 2025 is 52,25 / share. Previously, on September 10, 2024, the share price was 49,05 / share. This represents an increase of 6,52% over that period.
Fondssentiment-score
Fondssentiment Score (også kjent som akkumulering av eierskap poengsum) viser hvilke aksjer som er mest kjøpt av fond. Den er resultatet av en sofistikert, kvantitativ flerfaktormodell som identifiserer selskaper med de høyeste nivåene av institusjonell akkumulering. Beregningsmodellen for poeng bruker en kombinasjon av den totale økningen i antall offentliggjorte eiere, endringer i porteføljeallokeringen til disse eierne og andre beregninger. Tallet går fra 0 til 100, der høyere tall indikerer en høyere grad av akkumulering i forhold til sammenlignbare selskaper, der 50 er gjennomsnittet.
Oppdateringsfrekvens: Daglig
Sjekk ut Ownership Explorer, som inneholder en liste over de høyest rangerte selskapene.
Institusjonell Put/Call-forhold
I tillegg til å rapportere standard aksje- og gjeldsemisjoner må institusjoner med mer enn 100 millioner kroner i forvaltningskapital også oppgi beholdningen av put- og callopsjoner. Siden put-opsjoner generelt indikerer et negativt sentiment, og call-opsjoner indikerer et positivt sentiment, kan vi få et inntrykk av det generelle institusjonelle sentimentet ved å plotte forholdet mellom put- og call-opsjoner. Diagrammet til høyre viser det historiske forholdet mellom put- og call-opsjoner for dette instrumentet.
Ved å bruke Put/Call-forholdet som en indikator på investorsentimentet kan man overvinne en av de viktigste svakhetene ved å bruke totalt institusjonelt eierskap, nemlig at en betydelig andel av forvaltningskapitalen investeres passivt for å følge indekser. Passivt forvaltede fond kjøper vanligvis ikke opsjoner, slik at indikatoren for put/call-forhold i større grad gjenspeiler stemningen i aktivt forvaltede fond.
13F- og NPORT-arkiveringer
Detaljer om 13F-arkiveringer er gratis. Detaljer om NP-arkiveringer krever et premium-medlemskap. Grønne rader indikerer nye posisjoner. Røde rader indikerer lukkede posisjoner. Klikk på lenke ikonet for å se hele transaksjonshistorikken.
Oppgrader
for å låse opp premiedata og eksportere til Excel. ![]() .
.
| Fildato | Kilde | Investor | Type | Gjennomsnittlig pris (estimert) |
Aksjer | Δ Aksjer (%) |
Rapportert verdi ($1000) | Verdi (%) | Portallokering (%) | |
|---|---|---|---|---|---|---|---|---|---|---|
| 2025-08-06 | 13F | Prospera Financial Services Inc | 5 197 | 249 | ||||||
| 2025-07-17 | 13F | Janney Montgomery Scott LLC | 30 735 | 1,22 | 1 | 0,00 | ||||
| 2025-08-14 | 13F/A | Rockefeller Capital Management L.P. | 120 528 | 8,31 | 5 767 | 6,17 | ||||
| 2025-07-18 | 13F | SOA Wealth Advisors, LLC. | 353 | 1,15 | 17 | −5,88 | ||||
| 2025-08-14 | 13F/A | Skopos Labs, Inc. | 143 | 7 | ||||||
| 2025-08-14 | 13F | Wiley Bros.-aintree Capital, Llc | 39 594 | 0,46 | 1 895 | −0,37 | ||||
| 2025-08-06 | 13F | Commonwealth Equity Services, Llc | 75 579 | 3,88 | 4 | 0,00 | ||||
| 2025-08-14 | 13F | GWM Advisors LLC | 28 302 | 0,18 | 1 354 | −1,81 | ||||
| 2025-04-30 | 13F | Arcadia Investment Management Corp/mi | 0 | −100,00 | 0 | |||||
| 2025-08-14 | 13F | Herold Advisors, Inc. | 12 634 | 2,59 | 605 | 0,50 | ||||
| 2025-05-15 | 13F | D. E. Shaw & Co., Inc. | 0 | −100,00 | 0 | |||||
| 2025-08-04 | 13F | Flagship Harbor Advisors, Llc | 8 401 | −0,05 | 402 | −1,95 | ||||
| 2025-07-10 | 13F | Wealth Enhancement Advisory Services, Llc | 101 929 | −11,80 | 5 036 | −10,74 | ||||
| 2025-08-08 | 13F | Capital Investment Advisory Services, LLC | 2 031 | 0,00 | 97 | −2,02 | ||||
| 2025-07-18 | 13F | Truist Financial Corp | 32 411 | −19,47 | 1 551 | −21,08 | ||||
| 2025-08-15 | 13F | Tower Research Capital LLC (TRC) | 3 339 | 1 666,67 | 160 | 1 666,67 | ||||
| 2025-07-21 | 13F | Ameritas Advisory Services, LLC | 221 | 11 | ||||||
| 2025-08-14 | 13F | Raymond James Financial Inc | 170 858 | −23,18 | 8 176 | −24,71 | ||||
| 2025-08-12 | 13F | Proequities, Inc. | 0 | 0 | ||||||
| 2025-07-28 | 13F | Harbour Investments, Inc. | 342 | −14,71 | 16 | −15,79 | ||||
| 2025-08-07 | 13F | Kestra Private Wealth Services, Llc | 6 745 | 323 | ||||||
| 2025-08-08 | 13F | Cetera Investment Advisers | 33 843 | −13,09 | 1 619 | −14,83 | ||||
| 2025-08-14 | 13F | Mml Investors Services, Llc | 24 955 | −17,88 | 1 | 0,00 | ||||
| 2025-07-30 | 13F | Prosperity Financial Group, Inc. | 9 585 | 39,22 | 459 | 36,31 | ||||
| 2025-08-13 | 13F | EverSource Wealth Advisors, LLC | 1 290 | 0,00 | 62 | −1,61 | ||||
| 2025-08-07 | 13F | Allworth Financial LP | 51 756 | 0,32 | 2 477 | 4,69 | ||||
| 2025-08-14 | 13F | BancorpSouth Bank | 87 435 | −1,58 | 4 184 | −3,53 | ||||
| 2025-08-13 | 13F | Gateway Wealth Partners, LLC | 24 078 | 5,46 | 1 152 | 3,41 | ||||
| 2025-07-08 | 13F | Heartwood Wealth Advisors LLC | 711 039 | 1,15 | 34 023 | −0,86 | ||||
| 2025-08-11 | 13F | Perennial Investment Advisors, LLC | 7 084 | 3,37 | 339 | 1,20 | ||||
| 2025-07-23 | 13F | Kingswood Wealth Advisors, Llc | 22 866 | 0,00 | 1 094 | −1,97 | ||||
| 2025-08-18 | 13F | Geneos Wealth Management Inc. | 5 156 | −5,72 | 247 | −7,87 | ||||
| 2025-08-04 | 13F | Hantz Financial Services, Inc. | 143 | 0 | ||||||
| 2025-05-13 | 13F | Bokf, Na | 0 | −100,00 | 0 | −100,00 | ||||
| 2025-08-11 | 13F | Elite Financial, Inc. | 5 169 | 0,78 | 0 | |||||
| 2025-08-14 | 13F | Money Concepts Capital Corp | 7 669 | 11,06 | 367 | 8,61 | ||||
| 2025-08-15 | 13F | Kestra Advisory Services, LLC | 11 199 | −4,39 | 536 | −6,30 | ||||
| 2025-08-14 | 13F | Comerica Bank | 7 838 | 0,26 | 375 | −1,57 | ||||
| 2025-07-21 | 13F | Future Financial Wealth Managment LLC | 135 | 1,50 | 6 | 0,00 | ||||
| 2025-07-29 | 13F | International Assets Investment Management, Llc | 9 374 | 1,59 | 449 | −0,44 | ||||
| 2025-08-15 | 13F | Captrust Financial Advisors | 16 663 | −10,56 | 797 | −12,32 | ||||
| 2025-07-30 | 13F | Onyx Bridge Wealth Group LLC | 59 129 | −3,42 | 2 829 | −5,32 | ||||
| 2025-07-21 | 13F | Crews Bank & Trust | 2 250 | 0,00 | 108 | −1,83 | ||||
| 2025-08-14 | 13F | Mission Creek Capital Partners, Inc. | 5 341 | 0,00 | 256 | −1,92 | ||||
| 2025-08-14 | 13F | Royal Bank Of Canada | 44 894 | −14,20 | 2 148 | −15,90 | ||||
| 2025-08-04 | 13F | Integrity Alliance, Llc. | 16 704 | 236,10 | 799 | 230,17 | ||||
| 2025-08-11 | 13F | Wealthspire Advisors, LLC | 38 796 | 0,00 | 1 856 | −2,01 | ||||
| 2025-07-31 | 13F | Whipplewood Advisors, LLC | 0 | −100,00 | 0 | |||||
| 2025-08-12 | 13F | Jpmorgan Chase & Co | 57 153 | 0,95 | 2 735 | −1,09 | ||||
| 2025-08-13 | 13F | Capital Analysts, Inc. | 404 | 0,00 | 0 | |||||
| 2025-07-24 | 13F | IFP Advisors, Inc | 6 665 | 12 968,63 | 319 | 15 800,00 | ||||
| 2025-08-13 | 13F | Summit Financial, LLC | 6 578 | 8,91 | 315 | 6,80 | ||||
| 2025-08-06 | 13F | AE Wealth Management LLC | 41 302 | −2,22 | 1 976 | −4,17 | ||||
| 2025-08-04 | 13F | Assetmark, Inc | 0 | −100,00 | 0 | |||||
| 2025-08-08 | 13F | Tanglewood Legacy Advisors, LLC | 6 390 | −0,67 | 306 | −2,87 | ||||
| 2025-08-12 | 13F | Steward Partners Investment Advisory, Llc | 6 886 | 177,33 | 329 | 171,90 | ||||
| 2025-08-12 | 13F | J.w. Cole Advisors, Inc. | 43 674 | 1,49 | 2 090 | −0,52 | ||||
| 2025-08-06 | 13F | Atlas Legacy Advisors, LLC | 7 388 | −0,50 | 354 | −2,49 | ||||
| 2025-08-14 | 13F | Snowden Capital Advisors LLC | 4 809 | −9,49 | 230 | −11,20 | ||||
| 2025-04-16 | 13F | Hoey Investments, Inc | 0 | −100,00 | 0 | |||||
| 2025-04-14 | 13F | Patriot Financial Group Insurance Agency, LLC | 0 | −100,00 | 0 | −100,00 | ||||
| 2025-08-08 | 13F | Creative Planning | 4 980 | −9,16 | 238 | −10,86 | ||||
| 2025-08-19 | 13F | Cape Investment Advisory, Inc. | 2 285 | −9,86 | 109 | −11,38 | ||||
| 2025-08-13 | 13F/A | StoneX Group Inc. | 0 | −100,00 | 0 | −100,00 | ||||
| 2025-07-28 | 13F | Mutual Advisors, LLC | 8 370 | 416 | ||||||
| 2025-07-31 | 13F | Sage Mountain Advisors LLC | 573 | 0,00 | 27 | 0,00 | ||||
| 2025-08-14 | 13F | Goldman Sachs Group Inc | 16 131 | −46,13 | 772 | −47,23 | ||||
| 2025-08-12 | 13F | LPL Financial LLC | 582 399 | 12,65 | 27 868 | 10,41 | ||||
| 2025-07-16 | 13F | ORG Partners LLC | 0 | −100,00 | 0 | |||||
| 2025-08-12 | 13F | Global Retirement Partners, LLC | 100 | 0,00 | 5 | 0,00 | ||||
| 2025-05-13 | 13F | Bridgewealth Advisory Group, LLC | 0 | −100,00 | 0 | |||||
| 2025-08-14 | 13F | Mercer Global Advisors Inc /adv | 34 550 | −3,88 | 1 653 | −5,76 | ||||
| 2025-07-14 | 13F | Golden State Equity Partners | 61 077 | 2,21 | 2 923 | 0,17 | ||||
| 2025-08-13 | 13F | WCG Wealth Advisors LLC | 25 287 | 1,01 | 1 210 | −1,06 | ||||
| 2025-08-14 | 13F | Wells Fargo & Company/mn | 340 466 | 4,65 | 16 291 | 2,57 | ||||
| 2025-07-25 | 13F | Concurrent Investment Advisors, LLC | 14 516 | 695 | ||||||
| 2025-08-05 | 13F | Tsfg, Llc | 1 055 | 0,00 | 0 | |||||
| 2025-08-14 | 13F | Citadel Advisors Llc | 0 | −100,00 | 0 | |||||
| 2025-07-29 | 13F | Stratos Wealth Partners, LTD. | 17 790 | −7,37 | 851 | −9,18 | ||||
| 2025-08-08 | 13F | Pnc Financial Services Group, Inc. | 1 096 | 0,00 | 52 | −1,89 | ||||
| 2025-08-12 | 13F | SRS Capital Advisors, Inc. | 376 | 1,08 | 18 | −5,56 | ||||
| 2025-07-08 | 13F | Rise Advisors, LLC | 3 110 | 0,81 | 149 | −1,33 | ||||
| 2025-07-11 | 13F | Farther Finance Advisors, LLC | 135 | 6 | ||||||
| 2025-08-11 | 13F | Citigroup Inc | 1 000 | 0,00 | 48 | −2,08 | ||||
| 2025-08-12 | 13F | CIBC Private Wealth Group, LLC | 13 534 | 0,00 | 648 | 12,72 | ||||
| 2025-08-13 | 13F | Northwestern Mutual Wealth Management Co | 161 039 | −14,72 | 7 706 | −16,42 | ||||
| 2025-08-15 | 13F | Morgan Stanley | 1 048 296 | 2,29 | 50 161 | 0,26 | ||||
| 2025-08-13 | 13F | Jones Financial Companies Lllp | 55 961 | 43,76 | 2 667 | 41,96 | ||||
| 2025-07-29 | 13F | Stephens Inc /ar/ | 15 000 | 0,00 | 718 | −2,05 | ||||
| 2025-08-14 | 13F | Susquehanna International Group, Llp | 0 | −100,00 | 0 | |||||
| 2025-08-13 | 13F | Colonial Trust Advisors | 850 | 0,00 | 41 | −2,44 | ||||
| 2025-08-14 | 13F | Bank Of America Corp /de/ | 550 790 | 1,88 | 26 355 | −0,14 | ||||
| 2025-08-14 | 13F | Stifel Financial Corp | 253 000 | 611,93 | 12 106 | 598,15 | ||||
| 2025-08-11 | 13F | Principal Securities, Inc. | 300 | 50,00 | 14 | 55,56 | ||||
| 2025-08-04 | 13F | IFG Advisory, LLC | 10 317 | −0,40 | 494 | −2,38 | ||||
| 2025-04-29 | 13F | Callan Capital, LLC | 0 | −100,00 | 0 | |||||
| 2025-07-07 | 13F | First Community Trust Na | 1 100 | 0,00 | 53 | −1,89 | ||||
| 2025-07-31 | 13F | Cambridge Investment Research Advisors, Inc. | 13 122 | 9,26 | 1 | |||||
| 2025-07-07 | 13F | Thurston, Springer, Miller, Herd & Titak, Inc. | 725 | 0,00 | 35 | −2,86 | ||||
| 2025-08-08 | 13F | ProVise Management Group, LLC | 4 784 | −3,65 | 229 | −5,79 | ||||
| 2025-05-13 | 13F | Bank Of Montreal /can/ | 0 | −100,00 | 0 | |||||
| 2025-07-21 | 13F | Ashton Thomas Securities, Llc | 15 101 | 0,19 | 723 | −1,77 | ||||
| 2025-08-12 | 13F | Running Point Capital Advisors, LLC | 144 | 1,41 | 7 | 0,00 | ||||
| 2025-05-12 | 13F | Independent Advisor Alliance | 0 | −100,00 | 0 | |||||
| 2025-09-04 | 13F/A | Advisor Group Holdings, Inc. | 174 013 | 0,25 | 8 328 | −1,73 | ||||
| 2025-08-05 | 13F | Lifeworks Advisors, LLC | 0 | −100,00 | 0 | |||||
| 2025-08-14 | 13F | Ameriprise Financial Inc | 218 614 | 11,38 | 10 454 | 9,12 | ||||
| 2025-08-05 | 13F | Carson Advisory Inc. | 5 100 | 0,00 | 244 | −1,61 | ||||
| 2025-08-13 | 13F | Providence Capital Advisors, LLC | 133 | 6 | ||||||
| 2025-08-13 | 13F | Rsm Us Wealth Management Llc | 0 | −100,00 | 0 | |||||
| 2025-08-01 | 13F | Envestnet Asset Management Inc | 32 075 | −27,44 | 1 535 | −28,92 | ||||
| 2025-08-11 | 13F | HighTower Advisors, LLC | 74 950 | −21,38 | 3 586 | −22,93 | ||||
| 2025-08-14 | 13F | Fmr Llc | 2 145 | −22,67 | 103 | −24,44 | ||||
| 2025-07-15 | 13F | North Star Investment Management Corp. | 500 | 0,00 | 24 | −4,17 | ||||
| 2025-08-08 | 13F | Intrua Financial, LLC | 14 522 | 1,83 | 695 | −0,29 | ||||
| 2025-08-19 | 13F | Anchor Investment Management, LLC | 570 | 0,00 | 27 | 0,00 | ||||
| 2025-08-19 | 13F | Newbridge Financial Services Group, Inc. | 2 050 | 0,00 | 98 | −2,00 | ||||
| 2025-05-15 | 13F | Ameriflex Group, Inc. | 0 | −100,00 | 0 | |||||
| 2025-07-24 | 13F | Aurora Private Wealth, Inc. | 6 991 | 1,00 | 0 | |||||
| 2025-08-11 | 13F | Private Advisor Group, LLC | 133 579 | −35,10 | 6 392 | −36,39 | ||||
| 2025-07-25 | 13F | Cwm, Llc | 2 108 | 27,14 | 0 | |||||
| 2025-08-06 | 13F | Soltis Investment Advisors LLC | 0 | −100,00 | 0 | |||||
| 2025-07-25 | 13F | Atria Wealth Solutions, Inc. | 0 | −100,00 | 0 | |||||
| 2025-07-29 | 13F | Private Trust Co Na | 2 565 | 4,27 | 123 | 1,67 | ||||
| 2025-04-21 | 13F | Beacon Capital Management, LLC | 0 | −100,00 | 0 | |||||
| 2025-07-25 | 13F | Envestnet Portfolio Solutions, Inc. | 5 266 | −29,62 | 252 | −31,23 | ||||
| 2025-08-26 | 13F/A | Thrivent Financial For Lutherans | 0 | −100,00 | 0 | |||||
| 2025-07-22 | 13F | Simplicity Wealth,LLC | 30 066 | 200,00 | 1 439 | 194,07 | ||||
| 2025-04-29 | 13F | Byrne Financial Freedom, Llc | 0 | −100,00 | 0 | |||||
| 2025-08-14 | 13F | UBS Group AG | 85 350 | −4,88 | 4 084 | −6,78 | ||||
| 2025-08-01 | 13F | Rossby Financial, LCC | 225 | 0,00 | 11 | 0,00 | ||||
| 2025-07-30 | 13F | Bogart Wealth, LLC | 288 | 0,00 | 14 | −7,14 | ||||
| 2025-07-21 | 13F | Qrg Capital Management, Inc. | 9 458 | 453 | ||||||
| 2025-08-15 | 13F | Equitable Holdings, Inc. | 27 106 | 0,67 | 1 297 | −1,29 | ||||
| 2025-08-13 | 13F | Colonial Trust Co / SC | 300 | 0,00 | 14 | 0,00 | ||||
| 2025-08-08 | 13F | Avantax Advisory Services, Inc. | 44 181 | −8,21 | 2 114 | −10,00 | ||||
| 2025-08-08 | 13F | Gts Securities Llc | 7 047 | 18,46 | 337 | 16,21 | ||||
| 2025-08-05 | 13F | GPS Wealth Strategies Group, LLC | 100 | −33,33 | 5 | −42,86 |