Grunnleggende statistikk
| Institusjonelle eiere | 130 total, 124 long only, 1 short only, 5 long/short - change of −5,11% MRQ |
| Gjennomsnittlig porteføljeallokering | 0.1287 % - change of −13,89% MRQ |
| Institusjonelle aksjer (Long) | 7 681 297 (ex 13D/G) - change of 1,90MM shares 32,97% MRQ |
| Institusjonell verdi (Long) | $ 641 159 USD ($1000) |
Institusjonelt eierskap og aksjonærer
VanEck ETF Trust - VanEck Pharmaceutical ETF (US:PPH) har 130 institusjonelle eiere og aksjonærer som har sendt inn 13D/G- eller 13F-skjemaer til Securities Exchange Commission (SEC). Disse institusjonene eier til sammen 7,681,297 aksjer. De største aksjonærene inkluderer Goldman Sachs Group Inc, Morgan Stanley, Healthcare Of Ontario Pension Plan Trust Fund, Wells Fargo & Company/mn, Clal Insurance Enterprises Holdings Ltd, Jane Street Group, Llc, Avalon Trust Co, J.Safra Asset Management Corp, Jpmorgan Chase & Co, and Susquehanna International Group, Llp .
VanEck ETF Trust - VanEck Pharmaceutical ETF (NasdaqGM:PPH) institusjonell eierstruktur viser nåværende posisjoner i selskapet fordelt på institusjoner og fond, samt de siste endringene i posisjonsstørrelse. De største aksjonærene kan være individuelle investorer, verdipapirfond, hedgefond eller institusjoner. Schedule 13D indikerer at investoren eier (eller har eid) mer enn 5 % av selskapet og har til hensikt (eller hadde til hensikt) å aktivt forfølge en endring i forretningsstrategien. Schedule 13G indikerer en passiv investering på over 5 %.
The share price as of September 10, 2025 is 89,14 / share. Previously, on September 11, 2024, the share price was 97,10 / share. This represents a decline of 8,20% over that period.

Fondssentiment-score
Fondssentiment Score (også kjent som akkumulering av eierskap poengsum) viser hvilke aksjer som er mest kjøpt av fond. Den er resultatet av en sofistikert, kvantitativ flerfaktormodell som identifiserer selskaper med de høyeste nivåene av institusjonell akkumulering. Beregningsmodellen for poeng bruker en kombinasjon av den totale økningen i antall offentliggjorte eiere, endringer i porteføljeallokeringen til disse eierne og andre beregninger. Tallet går fra 0 til 100, der høyere tall indikerer en høyere grad av akkumulering i forhold til sammenlignbare selskaper, der 50 er gjennomsnittet.
Oppdateringsfrekvens: Daglig
Sjekk ut Ownership Explorer, som inneholder en liste over de høyest rangerte selskapene.
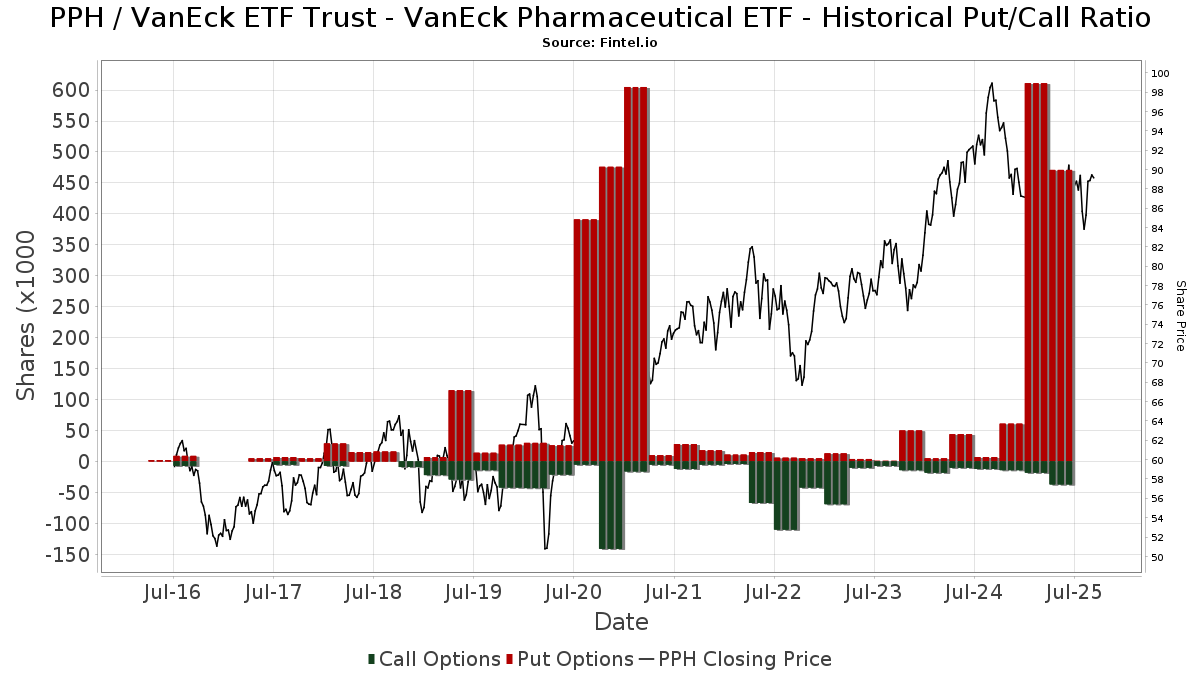
Institusjonell Put/Call-forhold
I tillegg til å rapportere standard aksje- og gjeldsemisjoner må institusjoner med mer enn 100 millioner kroner i forvaltningskapital også oppgi beholdningen av put- og callopsjoner. Siden put-opsjoner generelt indikerer et negativt sentiment, og call-opsjoner indikerer et positivt sentiment, kan vi få et inntrykk av det generelle institusjonelle sentimentet ved å plotte forholdet mellom put- og call-opsjoner. Diagrammet til høyre viser det historiske forholdet mellom put- og call-opsjoner for dette instrumentet.
Ved å bruke Put/Call-forholdet som en indikator på investorsentimentet kan man overvinne en av de viktigste svakhetene ved å bruke totalt institusjonelt eierskap, nemlig at en betydelig andel av forvaltningskapitalen investeres passivt for å følge indekser. Passivt forvaltede fond kjøper vanligvis ikke opsjoner, slik at indikatoren for put/call-forhold i større grad gjenspeiler stemningen i aktivt forvaltede fond.
13F- og NPORT-arkiveringer
Detaljer om 13F-arkiveringer er gratis. Detaljer om NP-arkiveringer krever et premium-medlemskap. Grønne rader indikerer nye posisjoner. Røde rader indikerer lukkede posisjoner. Klikk på lenke ikonet for å se hele transaksjonshistorikken.
Oppgrader
for å låse opp premiedata og eksportere til Excel. ![]() .
.
| Fildato | Kilde | Investor | Type | Gjennomsnittlig pris (estimert) |
Aksjer | Δ Aksjer (%) |
Rapportert verdi ($1000) | Verdi (%) | Portallokering (%) | |
|---|---|---|---|---|---|---|---|---|---|---|
| 2025-08-13 | 13F | Beacon Pointe Advisors, LLC | 2 428 | 0,00 | 214 | −3,62 | ||||
| 2025-08-12 | 13F | Jpmorgan Chase & Co | 255 837 | 2 852,19 | 22 503 | 2 752,09 | ||||
| 2025-08-13 | 13F | Level Four Advisory Services, Llc | 37 495 | 3,11 | 3 298 | −0,45 | ||||
| 2025-08-08 | 13F | SBI Securities Co., Ltd. | 284 | −16,22 | 25 | −20,00 | ||||
| 2025-08-12 | 13F | Steward Partners Investment Advisory, Llc | 16 161 | 0,00 | 1 422 | −3,46 | ||||
| 2025-07-28 | 13F | Mutual Advisors, LLC | 0 | −100,00 | 0 | |||||
| 2025-05-08 | 13F | Private Advisory Group LLC | 0 | −100,00 | 0 | −100,00 | ||||
| 2025-07-22 | 13F | IMC-Chicago, LLC | 0 | −100,00 | 0 | |||||
| 2025-07-15 | 13F | North Star Investment Management Corp. | 1 109 | 0,09 | 98 | −3,96 | ||||
| 2025-08-07 | 13F | Allworth Financial LP | 385 | 10,32 | 34 | 10,00 | ||||
| 2025-05-20 | 13F/A | Colony Group, LLC | 0 | −100,00 | 0 | −100,00 | ||||
| 2025-08-13 | 13F | Jones Financial Companies Lllp | 3 240 | 13,68 | 283 | 9,69 | ||||
| 2025-05-14 | 13F | Oarsman Capital, Inc. | 0 | −100,00 | 0 | −100,00 | ||||
| 2025-07-29 | 13F | Stratos Wealth Advisors, LLC | 4 066 | −0,76 | 358 | −4,29 | ||||
| 2025-08-11 | 13F | Aptus Capital Advisors, LLC | 524 | 0,58 | 46 | −2,13 | ||||
| 2025-08-14 | 13F | DeepCurrents Investment Group LLC | Put | 0 | −100,00 | 0 | ||||
| 2025-07-31 | 13F | Conservest Capital Advisors, Inc. | 5 059 | 0,16 | 445 | −3,48 | ||||
| 2025-08-05 | 13F | Bank Of Montreal /can/ | 11 398 | −26,88 | 1 003 | −29,44 | ||||
| 2025-08-14 | 13F | Two Sigma Investments, Lp | 0 | −100,00 | 0 | |||||
| 2025-08-12 | 13F | MAI Capital Management | 938 | −6,11 | 82 | −9,89 | ||||
| 2025-08-14 | 13F | D. E. Shaw & Co., Inc. | 30 254 | 2 661 | ||||||
| 2025-08-14 | 13F | Stifel Financial Corp | 11 456 | −0,05 | 1 008 | −3,54 | ||||
| 2025-07-22 | 13F | Bank Hapoalim Bm | 3 948 | −2,35 | 0 | |||||
| 2025-08-05 | 13F | Dunhill Financial, LLC | 2 833 | 249 | ||||||
| 2025-08-08 | 13F | Cetera Investment Advisers | 36 017 | 4,01 | 3 168 | 0,41 | ||||
| 2025-08-13 | 13F | Capital Analysts, Inc. | 232 | 0,00 | 0 | |||||
| 2025-08-19 | 13F | Anchor Investment Management, LLC | 58 | 0,00 | 5 | 0,00 | ||||
| 2025-04-29 | 13F | Hm Payson & Co | 99 | 0,00 | 9 | 12,50 | ||||
| 2025-07-25 | 13F | Cwm, Llc | 375 | 167,86 | 0 | |||||
| 2025-08-14 | 13F | Goldman Sachs Group Inc | 2 762 770 | 138,13 | 243 013 | 129,85 | ||||
| 2025-07-14 | 13F | Buska Wealth Management, LLC | 3 297 | −18,11 | 290 | −20,77 | ||||
| 2025-08-04 | 13F | Creative Financial Designs Inc /adv | 2 129 | 18,15 | 187 | 14,02 | ||||
| 2025-04-23 | 13F | Spirepoint Private Client, Llc | 0 | −100,00 | 0 | |||||
| 2025-07-28 | 13F | Harbour Investments, Inc. | 4 450 | 9,71 | 391 | 5,96 | ||||
| 2025-08-11 | 13F | Independent Advisor Alliance | 51 519 | 11,24 | 4 532 | 7,37 | ||||
| 2025-08-14 | 13F | UBS Group AG | 163 718 | −26,26 | 14 401 | −28,82 | ||||
| 2025-07-16 | 13F | Twelve Points Wealth Management LLC | 0 | −100,00 | 0 | |||||
| 2025-08-13 | 13F | Renaissance Technologies Llc | 14 400 | 1 267 | ||||||
| 2025-05-12 | 13F | Pura Vida Investments, Llc | Put | 0 | −100,00 | 0 | ||||
| 2025-08-14 | 13F | Jane Street Group, Llc | Put | 98 100 | 174,79 | 8 629 | 165,23 | |||
| 2025-08-14 | 13F | Jane Street Group, Llc | Call | 2 600 | −10,34 | 229 | −13,64 | |||
| 2025-08-04 | 13F | Canton Hathaway, LLC | 10 000 | 0,00 | 1 | |||||
| 2025-08-14 | 13F | Jane Street Group, Llc | 299 380 | 927,84 | 26 333 | 892,20 | ||||
| 2025-03-12 | 13F | Centaurus Financial, Inc. | 0 | −100,00 | 0 | |||||
| 2025-08-15 | 13F | Tower Research Capital LLC (TRC) | 34 624 | 346 140,00 | 3 046 | |||||
| 2025-07-23 | 13F | Elm3 Financial Group, LLC | 2 439 | −22,08 | 215 | −24,91 | ||||
| 2025-07-28 | 13F | Copia Wealth Management | 5 429 | −11,90 | 478 | −14,97 | ||||
| 2025-08-08 | 13F | Avalon Trust Co | 280 477 | −1,13 | 24 671 | −4,57 | ||||
| 2025-09-10 | 13F | WT Wealth Management | 46 597 | −9,86 | 4 099 | −12,99 | ||||
| 2025-07-08 | 13F | Arlington Trust Co LLC | 85 | 0,00 | 7 | 0,00 | ||||
| 2025-08-12 | 13F | Inscription Capital, LLC | 0 | −100,00 | 0 | |||||
| 2025-05-13 | 13F | SFI Advisors, LLC | 0 | −100,00 | 0 | |||||
| 2025-08-12 | 13F | Park Square Financial Group, LLC | 600 | 0,00 | 53 | −3,70 | ||||
| 2025-08-11 | 13F | Banque Cantonale Vaudoise | 629 | 0,00 | 0 | |||||
| 2025-08-14 | 13F | Wells Fargo & Company/mn | 402 987 | 35 447 | ||||||
| 2025-08-12 | 13F | Accredited Wealth Management, LLC | 100 | 0,00 | 9 | −11,11 | ||||
| 2025-08-12 | 13F | Proequities, Inc. | 0 | 0 | ||||||
| 2025-07-16 | 13F | Signaturefd, Llc | 0 | −100,00 | 0 | |||||
| 2025-08-06 | 13F | Kcm Investment Advisors Llc | 2 893 | −1,03 | 254 | −4,51 | ||||
| 2025-07-28 | 13F | J.Safra Asset Management Corp | 271 620 | 1,71 | 23 759 | −2,38 | ||||
| 2025-08-13 | 13F | Continuum Advisory, LLC | 0 | −100,00 | 0 | |||||
| 2025-08-06 | 13F | AE Wealth Management LLC | 1 004 | −4,02 | 88 | −7,37 | ||||
| 2025-08-11 | 13F | Principal Securities, Inc. | 353 | 38,98 | 31 | 47,62 | ||||
| 2025-07-31 | 13F | Oppenheimer & Co Inc | 11 111 | 2,10 | 977 | −1,41 | ||||
| 2025-08-14 | 13F | Bank Of America Corp /de/ | 59 637 | −66,51 | 5 246 | −67,68 | ||||
| 2025-08-14 | 13F | Wells Fargo & Company/mn | Put | 8 200 | 721 | |||||
| 2025-08-13 | 13F | Fisher Asset Management, LLC | 15 001 | −98,83 | 1 319 | −98,87 | ||||
| 2025-08-14 | 13F | Two Sigma Securities, Llc | 4 480 | 40,09 | 394 | 35,40 | ||||
| 2025-05-30 | NP | ERNZ - TrueShares Active Yield ETF | 5 579 | 508 | ||||||
| 2025-08-14 | 13F | Raymond James Financial Inc | 22 417 | 11,78 | 1 972 | 7,88 | ||||
| 2025-08-14 | 13F | Hrt Financial Lp | 0 | −100,00 | 0 | |||||
| 2025-08-14 | 13F | Aspen Grove Capital, LLC | 25 844 | 0,58 | 2 273 | −2,90 | ||||
| 2025-08-07 | 13F | Montag A & Associates Inc | 660 | 0,00 | 58 | −3,33 | ||||
| 2025-08-12 | 13F | Jefferies Financial Group Inc. | 3 262 | 287 | ||||||
| 2025-09-04 | 13F/A | Advisor Group Holdings, Inc. | 22 125 | 82,35 | 1 946 | 75,95 | ||||
| 2025-07-29 | 13F | TrueMark Investments, LLC | 0 | −100,00 | 0 | |||||
| 2025-08-11 | 13F | Citigroup Inc | 66 024 | 5 807 | ||||||
| 2025-07-23 | 13F | Fluent Financial, LLC | 0 | −100,00 | 0 | |||||
| 2025-07-11 | 13F | Farther Finance Advisors, LLC | 434 | −20,37 | 38 | −20,83 | ||||
| 2025-08-14 | 13F | GWM Advisors LLC | 102 | −98,85 | 9 | −99,01 | ||||
| 2025-08-06 | 13F | Miller Investment Management, LP | 181 536 | −4,27 | 15 968 | −7,60 | ||||
| 2025-07-23 | 13F | Prime Capital Investment Advisors, LLC | 96 870 | −26,43 | 8 521 | −28,99 | ||||
| 2025-08-05 | 13F | Telos Capital Management, Inc. | 4 516 | 2,08 | 397 | −1,49 | ||||
| 2025-04-24 | 13F | Nadler Financial Group, Inc. | 0 | −100,00 | 0 | |||||
| 2025-05-15 | 13F | Old Mission Capital Llc | 0 | −100,00 | 0 | −100,00 | ||||
| 2025-07-21 | 13F | Ntv Asset Management Llc | 7 957 | −13,25 | 700 | −16,29 | ||||
| 2025-05-15 | 13F | Marshall Wace, Llp | 0 | −100,00 | 0 | |||||
| 2025-08-14 | 13F | Sunbelt Securities, Inc. | 1 000 | 86 | ||||||
| 2025-07-07 | 13F | Nova Wealth Management, Inc. | 3 097 | −21,26 | 272 | −24,02 | ||||
| 2025-07-24 | 13F | Us Bancorp \de\ | 414 | −48,64 | 36 | −50,68 | ||||
| 2025-08-14 | 13F | Headlands Technologies LLC | 0 | −100,00 | 0 | −100,00 | ||||
| 2025-04-16 | 13F | Wealth Enhancement Advisory Services, Llc | Put | 0 | −100,00 | 0 | ||||
| 2025-08-14 | 13F | CoreFirst Bank & Trust | 200 | 18 | ||||||
| 2025-08-04 | 13F | Assetmark, Inc | 16 | −76,12 | 1 | −83,33 | ||||
| 2025-08-08 | 13F | Hartland & Co., LLC | 500 | 44 | ||||||
| 2025-04-16 | 13F | Hoey Investments, Inc | 0 | −100,00 | 0 | |||||
| 2025-08-11 | 13F | Blue Bell Private Wealth Management, Llc | 0 | −100,00 | 0 | |||||
| 2025-08-25 | 13F/A | Neuberger Berman Group LLC | 3 593 | 0,00 | 316 | −3,36 | ||||
| 2025-08-15 | 13F | Morgan Stanley | 538 398 | 489,05 | 47 358 | 468,58 | ||||
| 2025-07-09 | 13F | Dynamic Advisor Solutions LLC | 0 | −100,00 | 0 | |||||
| 2025-07-15 | 13F | Capital Investment Advisors, LLC | 0 | −100,00 | 0 | |||||
| 2025-07-31 | 13F | Cambridge Investment Research Advisors, Inc. | 3 153 | −6,96 | 0 | |||||
| 2025-08-12 | 13F | LPL Financial LLC | 48 228 | −0,53 | 4 242 | −3,98 | ||||
| 2025-08-15 | 13F | Equitable Holdings, Inc. | 14 241 | 1,61 | 1 253 | −1,96 | ||||
| 2025-08-11 | 13F | Tidemark, LLC | 486 | 8,00 | 43 | 2,44 | ||||
| 2025-08-14 | 13F | CIBC World Markets Inc. | 4 075 | −8,39 | 358 | −11,60 | ||||
| 2025-07-14 | 13F | U.S. Capital Wealth Advisors, LLC | 2 750 | 5,77 | 242 | 2,12 | ||||
| 2025-07-17 | 13F | Janney Montgomery Scott LLC | 4 805 | −1,03 | 0 | |||||
| 2025-07-30 | 13F | Phoenix Holdings Ltd. | 61 276 | 13,77 | 5 390 | 7,97 | ||||
| 2025-08-11 | 13F | HHM Wealth Advisors, LLC | 1 350 | 0,00 | 119 | −4,07 | ||||
| 2025-08-11 | 13F | TD Waterhouse Canada Inc. | 170 | 0,00 | 15 | 0,00 | ||||
| 2025-08-14 | 13F | DecisionPoint Financial, LLC | 1 000 | 0,00 | 88 | −3,30 | ||||
| 2025-08-26 | NP | LCR - Leuthold Core ETF | 0 | −100,00 | 0 | −100,00 | ||||
| 2025-08-12 | 13F | Tradition Wealth Management, LLC | 6 064 | −6,19 | 533 | −9,51 | ||||
| 2025-04-17 | 13F | Grimes & Company, Inc. | 0 | −100,00 | 0 | |||||
| 2025-07-22 | 13F | Gsa Capital Partners Llp | 2 510 | −11,96 | 0 | |||||
| 2025-08-13 | 13F | Leuthold Group, Llc | 0 | −100,00 | 0 | |||||
| 2025-04-28 | 13F | Lansing Street Advisors | 0 | −100,00 | 0 | −100,00 | ||||
| 2025-07-28 | 13F | Mowery & Schoenfeld Wealth Management, LLC | 13 | 0,00 | 1 | 0,00 | ||||
| 2025-08-12 | 13F | Verity & Verity, LLC | 131 320 | 11 551 | ||||||
| 2025-04-18 | 13F | Edge Financial Advisors LLC | 0 | −100,00 | 0 | |||||
| 2025-08-26 | 13F/A | Thrivent Financial For Lutherans | 20 681 | 2 | ||||||
| 2025-07-24 | 13F | Blair William & Co/il | 12 295 | 34,30 | 1 081 | 29,62 | ||||
| 2025-08-12 | 13F | Trexquant Investment LP | 3 151 | 277 | ||||||
| 2025-05-05 | 13F | Mivtachim The Workers Social Insurance Fund Ltd. (Under Special Management) | 0 | −100,00 | 0 | −100,00 | ||||
| 2025-07-28 | 13F | Axxcess Wealth Management, Llc | 9 114 | 4,78 | 802 | 1,14 | ||||
| 2025-08-05 | 13F | GPS Wealth Strategies Group, LLC | 459 | 0,00 | 40 | −2,44 | ||||
| 2025-05-07 | 13F | Investment Management Corp /va/ /adv | 0 | −100,00 | 0 | |||||
| 2025-07-16 | 13F | AAFMAA Wealth Management & Trust LLC | 39 081 | −6,85 | 3 438 | −10,10 | ||||
| 2025-04-21 | 13F | SILVER OAK SECURITIES, Inc | 0 | −100,00 | 0 | |||||
| 2025-08-14 | 13F | Ameriprise Financial Inc | 3 364 | −1,38 | 296 | −4,84 | ||||
| 2025-07-23 | 13F | Vontobel Holding Ltd. | 3 800 | 0,00 | 334 | −3,47 | ||||
| 2025-08-01 | 13F | Envestnet Asset Management Inc | 4 275 | −14,45 | 376 | −17,36 | ||||
| 2025-08-27 | 13F/A | Brinker Capital Investments, LLC | 33 513 | −5,57 | 2 948 | −8,87 | ||||
| 2025-08-08 | 13F | Hudock, Inc. | 9 217 | 811 | ||||||
| 2025-08-13 | 13F | Healthcare Of Ontario Pension Plan Trust Fund | 512 000 | 0,00 | 45 036 | −3,48 | ||||
| 2025-08-14 | 13F | Verition Fund Management LLC | 4 044 | −20,06 | 356 | −22,99 | ||||
| 2025-07-09 | 13F | Sapient Capital Llc | 2 588 | 0,00 | 228 | −3,40 | ||||
| 2025-08-06 | 13F | Commonwealth Equity Services, Llc | 13 287 | −28,66 | 1 | 0,00 | ||||
| 2025-08-13 | 13F | Quadrature Capital Ltd | 0 | −100,00 | 0 | |||||
| 2025-08-14 | 13F | Royal Bank Of Canada | 35 163 | −47,98 | 3 093 | −49,79 | ||||
| 2025-08-12 | 13F | Global Retirement Partners, LLC | 270 | −7,85 | 24 | −8,00 | ||||
| 2025-08-14 | 13F | Fmr Llc | 1 461 | −2,60 | 129 | −5,88 | ||||
| 2025-08-14 | 13F | Federation des caisses Desjardins du Quebec | 400 | 0,00 | 35 | −2,78 | ||||
| 2025-08-13 | 13F | Flow Traders U.s. Llc | 0 | −100,00 | 0 | |||||
| 2025-08-14 | 13F | Mml Investors Services, Llc | 2 511 | 2,11 | 0 | |||||
| 2025-08-13 | 13F | StoneX Group Inc. | 0 | −100,00 | 0 | −100,00 | ||||
| 2025-08-14 | 13F | J. Goldman & Co LP | Put | 131 800 | −29,44 | 11 593 | −31,90 | |||
| 2025-08-04 | 13F | Arkadios Wealth Advisors | 7 780 | 684 | ||||||
| 2025-07-22 | 13F | Belpointe Asset Management LLC | 5 704 | −1,60 | 502 | −5,11 | ||||
| 2025-05-02 | 13F | Apollon Wealth Management, LLC | 0 | −100,00 | 0 | |||||
| 2025-08-14 | 13F | Citadel Advisors Llc | Put | 13 000 | −77,89 | 1 143 | −78,67 | |||
| 2025-08-14 | 13F | Susquehanna International Group, Llp | Put | 214 400 | −34,81 | 18 859 | −37,08 | |||
| 2025-08-05 | 13F | Westside Investment Management, Inc. | 2 351 | 208 | ||||||
| 2025-08-14 | 13F | Susquehanna International Group, Llp | 53 664 | 105,52 | 4 720 | 98,40 | ||||
| 2025-08-14 | 13F | Susquehanna International Group, Llp | Call | 23 300 | 77,86 | 2 049 | 71,75 | |||
| 2025-07-31 | 13F | Burke & Herbert Bank & Trust Co | 8 865 | 0,00 | 780 | −3,47 | ||||
| 2025-08-14 | 13F | Citadel Advisors Llc | Call | 6 100 | 165,22 | 537 | 156,46 | |||
| 2025-07-16 | 13F | Investment Partners Asset Management, Inc. | 4 219 | −0,28 | 371 | −3,64 | ||||
| 2025-08-14 | 13F | Citadel Advisors Llc | 31 277 | −24,47 | 2 751 | −27,09 | ||||
| 2025-07-24 | 13F | CarsonAllaria Wealth Management, Ltd. | 0 | −100,00 | 0 | |||||
| 2025-07-24 | 13F | IFP Advisors, Inc | 285 | 0,00 | 25 | −3,85 | ||||
| 2025-08-13 | 13F | D L Carlson Investment Group Inc | 0 | −100,00 | 0 | |||||
| 2025-07-21 | 13F | Warner Financial, Inc | 4 636 | 0,61 | 0 | |||||
| 2025-08-08 | 13F | Pnc Financial Services Group, Inc. | 250 | 0,00 | 22 | −4,55 | ||||
| 2025-07-29 | 13F | Activest Wealth Management | 74 | 0,00 | 7 | 0,00 | ||||
| 2025-08-14 | 13F | Comerica Bank | 430 | −21,39 | 38 | −24,49 | ||||
| 2025-08-13 | 13F | Barclays Plc | 0 | −100,00 | 0 | |||||
| 2025-04-16 | 13F | Wealth Enhancement Advisory Services, Llc | 0 | −100,00 | 0 | |||||
| 2025-08-14 | 13F | Camden Capital, LLC | 2 807 | 0,57 | 247 | −3,15 | ||||
| 2025-08-27 | 13F/A | Squarepoint Ops LLC | Call | 5 700 | 501 | |||||
| 2025-08-13 | 13F | Financial Freedom, LLC | 9 006 | 0,17 | 792 | −3,30 | ||||
| 2025-08-27 | 13F/A | Squarepoint Ops LLC | Put | 5 700 | 501 | |||||
| 2025-03-28 | 13F/A | Berkeley, Inc | 0 | −100,00 | 0 | |||||
| 2025-07-10 | 13F | Global Financial Private Client, LLC | 0 | −100,00 | 0 | |||||
| 2025-08-14 | 13F | Bnp Paribas Arbitrage, Sa | 108 629 | 0,00 | 9 555 | −3,48 | ||||
| 2025-05-15 | 13F | Blue Chip Partners, Inc. | 0 | −100,00 | 0 | |||||
| 2025-04-25 | 13F | Almanack Investment Partners, LLC. | 0 | −100,00 | 0 | |||||
| 2025-08-13 | 13F | Northwestern Mutual Wealth Management Co | 12 790 | 76,73 | 1 125 | 70,71 | ||||
| 2025-08-18 | 13F/A | National Bank Of Canada /fi/ | 513 | 0,00 | 45 | −2,17 | ||||
| 2025-08-14 | 13F | Qube Research & Technologies Ltd | 16 190 | 13 856,90 | 1 424 | 14 140,00 | ||||
| 2025-08-12 | 13F | Clal Insurance Enterprises Holdings Ltd | 325 000 | 29 | ||||||
| 2025-05-15 | 13F | Millennium Management Llc | 0 | −100,00 | 0 | −100,00 | ||||
| 2025-07-08 | 13F | Adamsbrown Wealth Consultants Llc | 195 976 | 12,05 | 17 238 | 8,16 | ||||
| 2025-08-06 | 13F | Nvwm, Llc | 38 | 3 | ||||||
| 2025-07-25 | 13F | Atria Wealth Solutions, Inc. | 2 739 | 0,00 | 241 | −3,61 | ||||
| 2025-05-15 | 13F/A | Orion Portfolio Solutions, LLC | 35 490 | 18,78 | 3 234 | 25,45 | ||||
| 2025-07-18 | 13F | SOA Wealth Advisors, LLC. | 0 | −100,00 | 0 |