Grunnleggende statistikk
| Institusjonelle eiere | 190 total, 190 long only, 0 short only, 0 long/short - change of 0,00% MRQ |
| Gjennomsnittlig porteføljeallokering | 0.2355 % - change of −1,77% MRQ |
| Institusjonelle aksjer (Long) | 13 221 596 (ex 13D/G) - change of 1,13MM shares 9,39% MRQ |
| Institusjonell verdi (Long) | $ 467 695 USD ($1000) |
Institusjonelt eierskap og aksjonærer
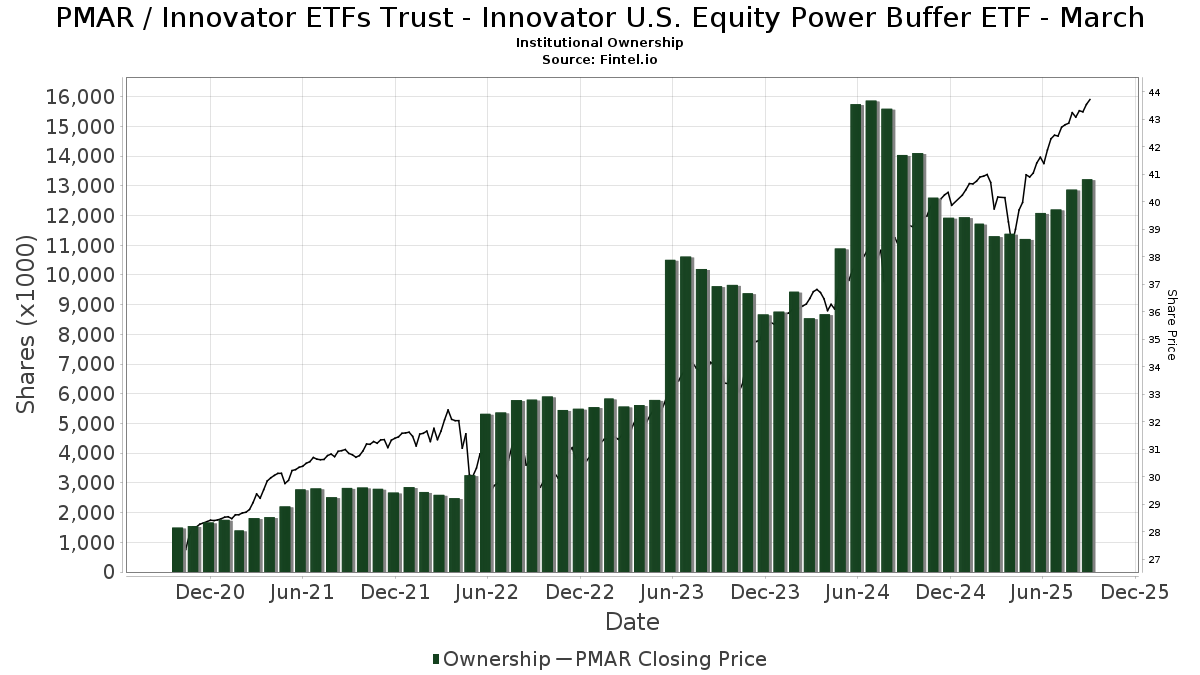
Innovator ETFs Trust - Innovator U.S. Equity Power Buffer ETF - March (US:PMAR) har 190 institusjonelle eiere og aksjonærer som har sendt inn 13D/G- eller 13F-skjemaer til Securities Exchange Commission (SEC). Disse institusjonene eier til sammen 13,221,596 aksjer. De største aksjonærene inkluderer Alliancebernstein L.p., Penserra Capital Management LLC, Innovator ETFs Trust - Innovator Laddered Fund of U.S. Equity Power Buffer ETFs, Brookstone Capital Management, Southland Equity Partners LLC, Advisor Group Holdings, Inc., Commonwealth Equity Services, Llc, Colony Group, LLC, Kovitz Investment Group Partners, LLC, and Raymond James Financial Inc .
Innovator ETFs Trust - Innovator U.S. Equity Power Buffer ETF - March (BATS:PMAR) institusjonell eierstruktur viser nåværende posisjoner i selskapet fordelt på institusjoner og fond, samt de siste endringene i posisjonsstørrelse. De største aksjonærene kan være individuelle investorer, verdipapirfond, hedgefond eller institusjoner. Schedule 13D indikerer at investoren eier (eller har eid) mer enn 5 % av selskapet og har til hensikt (eller hadde til hensikt) å aktivt forfølge en endring i forretningsstrategien. Schedule 13G indikerer en passiv investering på over 5 %.
The share price as of September 12, 2025 is 43,67 / share. Previously, on September 13, 2024, the share price was 38,82 / share. This represents an increase of 12,48% over that period.
Fondssentiment-score
Fondssentiment Score (også kjent som akkumulering av eierskap poengsum) viser hvilke aksjer som er mest kjøpt av fond. Den er resultatet av en sofistikert, kvantitativ flerfaktormodell som identifiserer selskaper med de høyeste nivåene av institusjonell akkumulering. Beregningsmodellen for poeng bruker en kombinasjon av den totale økningen i antall offentliggjorte eiere, endringer i porteføljeallokeringen til disse eierne og andre beregninger. Tallet går fra 0 til 100, der høyere tall indikerer en høyere grad av akkumulering i forhold til sammenlignbare selskaper, der 50 er gjennomsnittet.
Oppdateringsfrekvens: Daglig
Sjekk ut Ownership Explorer, som inneholder en liste over de høyest rangerte selskapene.
Institusjonell Put/Call-forhold
I tillegg til å rapportere standard aksje- og gjeldsemisjoner må institusjoner med mer enn 100 millioner kroner i forvaltningskapital også oppgi beholdningen av put- og callopsjoner. Siden put-opsjoner generelt indikerer et negativt sentiment, og call-opsjoner indikerer et positivt sentiment, kan vi få et inntrykk av det generelle institusjonelle sentimentet ved å plotte forholdet mellom put- og call-opsjoner. Diagrammet til høyre viser det historiske forholdet mellom put- og call-opsjoner for dette instrumentet.
Ved å bruke Put/Call-forholdet som en indikator på investorsentimentet kan man overvinne en av de viktigste svakhetene ved å bruke totalt institusjonelt eierskap, nemlig at en betydelig andel av forvaltningskapitalen investeres passivt for å følge indekser. Passivt forvaltede fond kjøper vanligvis ikke opsjoner, slik at indikatoren for put/call-forhold i større grad gjenspeiler stemningen i aktivt forvaltede fond.
13F- og NPORT-arkiveringer
Detaljer om 13F-arkiveringer er gratis. Detaljer om NP-arkiveringer krever et premium-medlemskap. Grønne rader indikerer nye posisjoner. Røde rader indikerer lukkede posisjoner. Klikk på lenke ikonet for å se hele transaksjonshistorikken.
Oppgrader
for å låse opp premiedata og eksportere til Excel. ![]() .
.
| Fildato | Kilde | Investor | Type | Gjennomsnittlig pris (estimert) |
Aksjer | Δ Aksjer (%) |
Rapportert verdi ($1000) | Verdi (%) | Portallokering (%) | |
|---|---|---|---|---|---|---|---|---|---|---|
| 2025-07-22 | 13F | Siligmueller & Norvid Wealth Advisors LLC | 6 443 | 0,00 | 273 | 6,23 | ||||
| 2025-07-09 | 13F | HFG Wealth Management, LLC | 28 035 | −2,25 | 1 120 | −2,86 | ||||
| 2025-08-06 | 13F | Penserra Capital Management LLC | 1 385 567 | 14,03 | 59 | 20,83 | ||||
| 2025-07-22 | 13F | Merit Financial Group, LLC | 11 465 | 484 | ||||||
| 2025-07-23 | 13F | Valmark Advisers, Inc. | 54 498 | 0,00 | 2 301 | 5,74 | ||||
| 2025-07-30 | 13F | Strategic Blueprint, LLC | 14 135 | 47,36 | 597 | 55,61 | ||||
| 2025-08-11 | 13F | Summit Wealth Partners, LLC | 7 962 | 0,00 | 336 | 5,99 | ||||
| 2025-05-08 | 13F | Certified Advisory Corp | 0 | −100,00 | 0 | |||||
| 2025-08-13 | 13F | BCJ Capital Management, LLC | 44 465 | −0,15 | 1 878 | 5,57 | ||||
| 2025-07-11 | 13F | SILVER OAK SECURITIES, Inc | 17 673 | 86,21 | 746 | 97,35 | ||||
| 2025-07-10 | 13F | Oliver Lagore Vanvalin Investment Group | 0 | −100,00 | 0 | |||||
| 2025-07-31 | 13F | Gill Capital Partners, Llc | 63 632 | 13,31 | 2 687 | 19,85 | ||||
| 2025-08-05 | 13F | Smith Shellnut Wilson Llc /adv | 10 000 | 0,00 | 422 | 5,76 | ||||
| 2025-08-11 | 13F | Blue Bell Private Wealth Management, Llc | 40 147 | −2,54 | 1 695 | 3,10 | ||||
| 2025-08-13 | 13F | Townsquare Capital Llc | 0 | −100,00 | 0 | |||||
| 2025-08-18 | 13F | Hollencrest Capital Management | 0 | −100,00 | 0 | |||||
| 2025-04-08 | 13F | Parallel Advisors, LLC | 0 | −100,00 | 0 | |||||
| 2025-08-14 | 13F | CoreCap Advisors, LLC | 129 298 | 3,44 | 5 460 | 9,38 | ||||
| 2025-08-11 | 13F | Annis Gardner Whiting Capital Advisors, LLC | 500 | 21 | ||||||
| 2025-07-25 | 13F | Atria Wealth Solutions, Inc. | 35 971 | 10,40 | 1 520 | 16,76 | ||||
| 2025-08-08 | 13F | Avantax Advisory Services, Inc. | 16 632 | 0,00 | 702 | 5,72 | ||||
| 2025-04-25 | 13F | Crown Wealth Group, LLC | 0 | −100,00 | 0 | |||||
| 2025-08-12 | 13F | Steward Partners Investment Advisory, Llc | 47 933 | 0,52 | 2 024 | 6,30 | ||||
| 2025-07-10 | 13F | Marshall Financial Group LLC | 5 367 | 0,00 | 227 | 6,07 | ||||
| 2025-07-30 | 13F | Schnieders Capital Management Llc | 11 600 | 0,00 | 490 | 5,62 | ||||
| 2025-08-11 | 13F | Nations Financial Group Inc, /ia/ /adv | 5 338 | 4,77 | 225 | 10,84 | ||||
| 2025-08-12 | 13F | Ascent Wealth Partners, LLC | 28 048 | 7,14 | 1 184 | 13,30 | ||||
| 2025-07-15 | 13F | First City Capital Management, Inc. | 6 750 | 0,00 | 285 | 5,95 | ||||
| 2025-08-15 | 13F | Morgan Stanley | 4 644 | −34,23 | 196 | −30,25 | ||||
| 2025-08-12 | 13F | Jacobi Capital Management LLC | 10 745 | 0,00 | 454 | 5,59 | ||||
| 2025-08-14 | 13F | Royal Bank Of Canada | 0 | −100,00 | 0 | |||||
| 2025-07-30 | 13F | LifeWealth Investments, LLC | 25 205 | 0,00 | 1 064 | 5,77 | ||||
| 2025-04-18 | 13F | Global Trust Asset Management, LLC | 0 | −100,00 | 0 | |||||
| 2025-08-12 | 13F | Proequities, Inc. | 0 | 0 | ||||||
| 2025-08-14 | 13F | Main Street Financial Solutions, LLC | 37 681 | 0,00 | 1 591 | 5,78 | ||||
| 2025-07-28 | 13F | Cypress Wealth Services, LLC | 46 429 | 0,00 | 1 961 | 5,72 | ||||
| 2025-08-05 | 13F | C2P Capital Advisory Group, LLC d.b.a. Prosperity Capital Advisors | 11 065 | 0,00 | 467 | 5,66 | ||||
| 2025-07-09 | 13F | Keystone Wealth Services, LLC | 46 000 | 0,00 | 1 943 | 5,72 | ||||
| 2025-08-06 | 13F | AE Wealth Management LLC | 30 907 | −6,88 | 1 305 | −1,51 | ||||
| 2025-07-24 | 13F | Weaver Capital Management LLC | 35 080 | 0,00 | 1 481 | 5,79 | ||||
| 2025-07-16 | 13F | Perigon Wealth Management, LLC | 5 204 | 0,00 | 220 | 5,80 | ||||
| 2025-07-22 | 13F | Global Strategic Investment Solutions, LLC | 6 967 | 0,00 | 294 | 5,76 | ||||
| 2025-09-04 | 13F | Beacon Capital Management, Inc. | 556 | 23 | ||||||
| 2025-08-14 | 13F | Jane Street Group, Llc | 10 926 | −64,64 | 461 | −62,61 | ||||
| 2025-08-13 | 13F | VestGen Advisors, LLC | 38 432 | 648,87 | 1 684 | 725,00 | ||||
| 2025-08-14 | 13F | Ausdal Financial Partners, Inc. | 9 574 | −0,30 | 404 | 5,48 | ||||
| 2025-08-01 | 13F | Advisory Alpha, LLC | 17 782 | 0,00 | 751 | 5,63 | ||||
| 2025-06-24 | NP | Innovator ETFs Trust - Innovator Laddered Fund of U.S. Equity Power Buffer ETFs | 1 210 653 | 10,70 | 48 063 | 7,88 | ||||
| 2025-08-12 | 13F | Leigh Baldwin & Co., Llc | 5 300 | −15,87 | 224 | −11,16 | ||||
| 2025-07-22 | 13F | MBL Wealth, LLC | 64 095 | −3,75 | 2 707 | 1,77 | ||||
| 2025-07-18 | 13F | Truist Financial Corp | 126 825 | −2,96 | 5 356 | 2,61 | ||||
| 2025-07-11 | 13F | Cypress Financial Planning Llc | 5 361 | −26,01 | 226 | −21,80 | ||||
| 2025-07-21 | 13F | DHJJ Financial Advisors, Ltd. | 10 783 | 0,00 | 455 | 5,81 | ||||
| 2025-08-04 | 13F | Spire Wealth Management | 51 966 | −4,61 | 2 195 | 0,87 | ||||
| 2025-08-14 | 13F | Talon Private Wealth, LLC | 45 654 | 1 928 | ||||||
| 2025-08-08 | 13F | Hartland & Co., LLC | 0 | −100,00 | 0 | |||||
| 2025-07-15 | 13F | Optima Capital Llc | 19 118 | 807 | ||||||
| 2025-07-07 | 13F | Vishria Bird Financial Group, LLC | 17 086 | −2,37 | 722 | 3,30 | ||||
| 2025-07-31 | 13F | Orion Capital Management LLC | 15 665 | 0,00 | 662 | 5,76 | ||||
| 2025-08-14 | 13F | Susquehanna International Group, Llp | 70 554 | 294,00 | 2 979 | 316,64 | ||||
| 2025-08-06 | 13F | Commonwealth Equity Services, Llc | 380 834 | 2,94 | 16 | 14,29 | ||||
| 2025-08-14 | 13F | Raymond James Financial Inc | 288 179 | 2,01 | 12 170 | 7,87 | ||||
| 2025-07-29 | 13F | Koshinski Asset Management, Inc. | 5 250 | −7,49 | 222 | −2,21 | ||||
| 2025-08-14 | 13F | Citadel Advisors Llc | 0 | −100,00 | 0 | |||||
| 2025-08-07 | 13F | Fidelis Capital Partners, LLC | 12 200 | 0,00 | 523 | 8,30 | ||||
| 2025-08-05 | 13F | Integrity Financial Corp /WA | 1 572 | 0,00 | 66 | 6,45 | ||||
| 2025-07-17 | 13F | City Holding Co | 59 382 | −0,53 | 2 507 | 5,20 | ||||
| 2025-07-10 | 13F | Wealth Enhancement Advisory Services, Llc | 59 388 | −8,56 | 2 520 | −2,82 | ||||
| 2025-05-01 | 13F | Quest 10 Wealth Builders, Inc. | 12 928 | 12,65 | 524 | 13,45 | ||||
| 2025-07-17 | 13F | Wolff Wiese Magana Llc | 51 | 0,00 | 2 | 0,00 | ||||
| 2025-07-25 | 13F | Yarger Wealth Strategies, Llc | 60 250 | −10,86 | 2 544 | −5,74 | ||||
| 2025-08-08 | 13F | Gts Securities Llc | 6 133 | 0,00 | 259 | 5,74 | ||||
| 2025-08-12 | 13F | Bedel Financial Consulting, Inc. | 9 074 | 0,00 | 383 | 6,09 | ||||
| 2025-08-19 | 13F | National Asset Management, Inc. | 0 | −100,00 | 0 | |||||
| 2025-07-28 | 13F | RFG Advisory, LLC | 18 485 | −37,48 | 781 | −33,90 | ||||
| 2025-08-14 | 13F | Wells Fargo & Company/mn | 0 | −100,00 | 0 | |||||
| 2025-07-10 | 13F | Focus Financial Network, Inc. | 7 685 | −13,51 | 325 | −8,47 | ||||
| 2025-07-24 | 13F | Stonebridge Financial Group, LLC | 0 | −100,00 | 0 | |||||
| 2025-08-13 | 13F | JT Stratford LLC | 7 520 | 0,00 | 318 | 5,67 | ||||
| 2025-08-19 | 13F | Cape Investment Advisory, Inc. | 7 560 | −1,31 | 319 | 4,59 | ||||
| 2025-07-31 | 13F | Pinnacle Wealth Management Group, Inc. | 37 910 | −0,79 | 1 601 | 4,92 | ||||
| 2025-08-12 | 13F | SRS Capital Advisors, Inc. | 7 647 | −0,29 | 323 | 5,23 | ||||
| 2025-08-05 | 13F | Jessup Wealth Management, Inc | 18 515 | −10,24 | 782 | −5,10 | ||||
| 2025-07-17 | 13F | Clay Northam Wealth Management, LLC | 6 170 | 0,00 | 261 | 5,69 | ||||
| 2025-08-06 | 13F | ORBA Wealth Advisors, L.L.C. | 19 643 | −4,38 | 830 | 1,10 | ||||
| 2025-08-01 | 13F | Envestnet Asset Management Inc | 110 148 | 2,26 | 4 652 | 8,14 | ||||
| 2025-07-31 | 13F | Blue Sky Capital Consultants Group, Inc. | 12 313 | 520 | ||||||
| 2025-08-04 | 13F | Assetmark, Inc | 290 | 308,45 | 12 | 500,00 | ||||
| 2025-08-01 | 13F | FSA Advisors, Inc. | 22 317 | 0,19 | 942 | 5,96 | ||||
| 2025-08-14 | 13F | GWM Advisors LLC | 55 393 | 0,22 | 2 339 | 5,98 | ||||
| 2025-05-15 | 13F | Hrt Financial Lp | 0 | −100,00 | 0 | |||||
| 2025-07-29 | 13F | AssuredPartners Investment Advisors, LLC | 0 | −100,00 | 0 | |||||
| 2025-07-28 | 13F | Cornerstone Wealth Group, LLC | 30 056 | 0,00 | 1 269 | 5,75 | ||||
| 2025-07-08 | 13F | Ptm Wealth Management, Llc | 8 055 | −19,99 | 342 | −8,82 | ||||
| 2025-08-04 | 13F | Pensionmark Financial Group, Llc | 6 700 | 31,37 | 283 | 38,92 | ||||
| 2025-07-22 | 13F | Macroview Investment Management Llc | 30 285 | 0,00 | 1 279 | 5,71 | ||||
| 2025-05-13 | 13F | UBS Group AG | 0 | −100,00 | 0 | |||||
| 2025-05-07 | 13F | Keystone Financial Group, Inc. | 0 | −100,00 | 0 | |||||
| 2025-07-25 | 13F | Cwm, Llc | 6 223 | 0,00 | 0 | |||||
| 2025-08-08 | 13F | Foundations Investment Advisors, LLC | 38 180 | 6,69 | 1 612 | 12,81 | ||||
| 2025-08-27 | 13F/A | Brinker Capital Investments, LLC | 19 550 | 248,80 | 826 | 269,96 | ||||
| 2025-07-22 | 13F | Diligent Investors, LLC | 89 536 | 0,56 | 3 781 | 6,36 | ||||
| 2025-05-09 | 13F | Pnc Financial Services Group, Inc. | 0 | −100,00 | 0 | |||||
| 2025-08-11 | 13F | Brown Wealth Management, Llc | 28 157 | −22,06 | 1 189 | −17,55 | ||||
| 2025-07-21 | 13F | Patriot Financial Group Insurance Agency, LLC | 33 301 | 7,07 | 1 406 | 13,20 | ||||
| 2025-07-16 | 13F | PFS Partners, LLC | 1 329 | 210,51 | 56 | 229,41 | ||||
| 2025-08-14 | 13F | Old Mission Capital Llc | 63 762 | 2 693 | ||||||
| 2025-07-22 | 13F | Belpointe Asset Management LLC | 13 971 | −0,04 | 590 | 5,56 | ||||
| 2025-07-28 | 13F | Sagespring Wealth Partners, Llc | 15 881 | 68,20 | 671 | 77,72 | ||||
| 2025-08-13 | 13F | SageView Advisory Group, LLC | 24 201 | 0,00 | 1 039 | 7,45 | ||||
| 2025-08-07 | 13F | Lakeridge Wealth Management LLC | 34 651 | 3,59 | 1 463 | 9,59 | ||||
| 2025-08-08 | 13F | Capital Investment Advisory Services, LLC | 655 | 1 210,00 | 28 | 2 600,00 | ||||
| 2025-07-09 | 13F | Lineweaver Wealth Advisors, LLC | 21 131 | 0,00 | 892 | 5,81 | ||||
| 2025-07-29 | 13F | Stratos Wealth Advisors, LLC | 17 720 | 4,27 | 748 | 10,32 | ||||
| 2025-07-31 | 13F | Cambridge Investment Research Advisors, Inc. | 107 754 | 0,53 | 5 | 0,00 | ||||
| 2025-08-14 | 13F | First Commonwealth Financial Corp /pa/ | 45 053 | −0,33 | 1 903 | 5,37 | ||||
| 2025-08-13 | 13F | Cresset Asset Management, LLC | 82 011 | 0,00 | 3 463 | 5,74 | ||||
| 2025-07-15 | 13F | Vestment Financial LLC | 13 893 | 0,00 | 587 | 5,58 | ||||
| 2025-07-25 | 13F | Hazlett, Burt & Watson, Inc. | 800 | 0,00 | 0 | |||||
| 2025-07-14 | 13F | Buska Wealth Management, LLC | 8 484 | −11,65 | 358 | −6,53 | ||||
| 2025-08-12 | 13F | LPL Financial LLC | 171 387 | 7,20 | 7 238 | 13,36 | ||||
| 2025-08-08 | 13F | Wealth Alliance | 83 745 | −0,18 | 3 537 | 5,55 | ||||
| 2025-08-15 | 13F | Kestra Advisory Services, LLC | 207 744 | 11,48 | 8 773 | 17,90 | ||||
| 2025-07-30 | 13F | Brookstone Capital Management | 846 204 | 360,08 | 35 735 | 386,59 | ||||
| 2025-07-28 | 13F | Harbour Investments, Inc. | 12 833 | 7,31 | 542 | 13,42 | ||||
| 2025-07-30 | 13F | Retirement Planning Group | 19 905 | 0,00 | 841 | 5,79 | ||||
| 2025-07-14 | 13F | AdvisorNet Financial, Inc | 9 395 | −7,44 | 397 | −2,22 | ||||
| 2025-05-05 | 13F | Riverchase Wealth Management, Llc | 0 | −100,00 | 0 | |||||
| 2025-08-13 | 13F | Millstone Evans Group, LLC | 4 230 | 0,00 | 179 | 5,95 | ||||
| 2025-07-25 | 13F | We Are One Seven, LLC | 6 424 | 271 | ||||||
| 2025-08-07 | 13F | Resources Investment Advisors, LLC. | 78 662 | 169,19 | 3 322 | 184,82 | ||||
| 2025-08-01 | 13F | Corrado Advisors, Llc | 50 804 | −0,20 | 2 145 | 5,56 | ||||
| 2025-08-11 | 13F | Bellwether Advisors, LLC | 104 429 | 0,00 | 4 410 | 5,76 | ||||
| 2025-08-04 | 13F | Arkadios Wealth Advisors | 22 975 | 152,03 | 970 | 166,48 | ||||
| 2025-08-15 | 13F | Sugar Maple Asset Management, LLC | 10 579 | −6,99 | 447 | −1,76 | ||||
| 2025-08-12 | 13F | MAI Capital Management | 82 494 | −5,98 | 3 484 | −0,57 | ||||
| 2025-05-15 | 13F | Barclays Plc | 0 | −100,00 | 0 | |||||
| 2025-04-23 | 13F | Vantage Point Financial LLC | 0 | −100,00 | 0 | |||||
| 2025-07-10 | 13F | Atticus Wealth Management, Llc | 65 615 | 0,00 | 2 771 | 5,73 | ||||
| 2025-08-05 | 13F | WorthPointe, LLC | 31 319 | −0,06 | 1 323 | 5,68 | ||||
| 2025-08-07 | 13F | Runnymede Capital Advisors, Inc. | 0 | −100,00 | 0 | |||||
| 2025-07-03 | 13F | Fiduciary Financial Group, Llc | 15 661 | 0,00 | 661 | 10,35 | ||||
| 2025-07-16 | 13F | Signaturefd, Llc | 17 277 | 0,00 | 730 | 5,81 | ||||
| 2025-05-15 | 13F/A | Orion Portfolio Solutions, LLC | 5 605 | −8,70 | 224 | −9,35 | ||||
| 2025-04-15 | 13F | Noble Wealth Management PBC | 2 000 | 80 | ||||||
| 2025-07-17 | 13F | Wagner Wealth Management, Llc | 1 990 | 0,00 | 84 | 6,33 | ||||
| 2025-08-14 | 13F | Visionary Wealth Advisors | 8 847 | −1,94 | 374 | 3,61 | ||||
| 2025-08-06 | 13F | Rps Advisory Solutions Llc | 5 819 | −68,74 | 246 | −67,03 | ||||
| 2025-07-30 | 13F | Phillips Financial Management, Llc | 1 825 | 77 | ||||||
| 2025-08-04 | 13F | Creative Financial Designs Inc /adv | 3 000 | 14,55 | 127 | 21,15 | ||||
| 2025-08-14 | 13F | Kovitz Investment Group Partners, LLC | 297 489 | 3,23 | 12 563 | 9,16 | ||||
| 2025-08-11 | 13F | WPWealth LLP | 53 104 | −37,52 | 2 243 | −33,94 | ||||
| 2025-08-05 | 13F | Sigma Planning Corp | 10 710 | −13,71 | 452 | −8,69 | ||||
| 2025-07-09 | 13F | Fiduciary Alliance LLC | 7 494 | 0,00 | 316 | 5,69 | ||||
| 2025-07-14 | 13F | Kfg Wealth Management, Llc | 142 477 | 8,35 | 6 017 | 14,57 | ||||
| 2025-07-23 | 13F | Castle Rock Wealth Management, LLC | 33 281 | −8,86 | 1 420 | −2,67 | ||||
| 2025-08-14 | 13F | Mercer Global Advisors Inc /adv | 26 387 | −1,02 | 1 114 | 4,70 | ||||
| 2025-08-18 | 13F | Geneos Wealth Management Inc. | 2 850 | 0,00 | 120 | 6,19 | ||||
| 2025-07-09 | 13F | Fragasso Group Inc. | 7 923 | 0,00 | 335 | 5,70 | ||||
| 2025-07-24 | 13F | Ronald Blue Trust, Inc. | 4 996 | 0,00 | 211 | 5,53 | ||||
| 2025-08-14 | 13F | Mml Investors Services, Llc | 54 753 | 1,33 | 2 | 0,00 | ||||
| 2025-08-05 | 13F | Bank Of Montreal /can/ | 543 | 0,00 | 23 | 4,76 | ||||
| 2025-08-14 | 13F | Aqr Capital Management Llc | 13 800 | −0,06 | 583 | 5,63 | ||||
| 2025-08-13 | 13F | Virtue Capital Management, LLC | 0 | −100,00 | 0 | |||||
| 2025-08-13 | 13F | Continuum Advisory, LLC | 12 581 | −31,61 | 531 | −27,66 | ||||
| 2025-07-25 | 13F | Sequoia Financial Advisors, LLC | 9 320 | 0,00 | 394 | 5,65 | ||||
| 2025-08-12 | 13F | Jpmorgan Chase & Co | 6 959 | −36,34 | 294 | −32,80 | ||||
| 2025-08-13 | 13F | Beacon Pointe Advisors, LLC | 89 250 | −17,32 | 3 769 | −12,55 | ||||
| 2025-07-18 | 13F | Consolidated Portfolio Review Corp | 16 062 | 7,78 | 678 | 13,95 | ||||
| 2025-07-17 | 13F | Janney Montgomery Scott LLC | 50 452 | −2,77 | 2 | 0,00 | ||||
| 2025-08-08 | 13F | Kingsview Wealth Management, LLC | 42 227 | 152,00 | 1 783 | 166,52 | ||||
| 2025-07-24 | 13F | IFP Advisors, Inc | 43 013 | 83,52 | 1 816 | 94,22 | ||||
| 2025-07-10 | 13F | ARS Wealth Advisors Group, LLC | 7 268 | −35,87 | 307 | −32,30 | ||||
| 2025-08-14 | 13F | Alliancebernstein L.p. | 1 667 939 | −2,77 | 70 437 | 2,82 | ||||
| 2025-08-13 | 13F | Capital Analysts, Inc. | 2 878 | 0,00 | 0 | |||||
| 2025-08-04 | 13F | Impact Partnership Wealth, LLC | 5 878 | 13,39 | 248 | 19,81 | ||||
| 2025-05-15 | 13F | Captrust Financial Advisors | 0 | −100,00 | 0 | |||||
| 2025-08-19 | 13F | Advisory Services Network, LLC | 17 813 | 0,00 | 762 | 7,03 | ||||
| 2025-08-14 | 13F | Financial Network Wealth Advisors LLC | 4 518 | 0,00 | 191 | 5,56 | ||||
| 2025-07-14 | 13F | Chris Bulman Inc | 34 665 | 15,09 | 1 464 | 21,71 | ||||
| 2025-08-11 | 13F | HighTower Advisors, LLC | 137 896 | −12,30 | 5 823 | −7,25 | ||||
| 2025-08-13 | 13F | Cerity Partners LLC | 28 033 | −9,08 | 1 184 | −3,90 | ||||
| 2025-08-14 | 13F | Diversify Advisory Services, LLC | 89 896 | −0,76 | 3 881 | 7,90 | ||||
| 2025-08-14 | 13F | Mariner, LLC | 15 556 | 0,00 | 657 | 5,64 | ||||
| 2025-08-12 | 13F | Wood Tarver Financial Group, LLC | 12 732 | 3,67 | 1 | −100,00 | ||||
| 2025-07-14 | 13F | Southland Equity Partners LLC | 730 584 | −0,70 | 30 853 | 5,01 | ||||
| 2025-07-24 | 13F | Bernard Wealth Management Corp. | 319 | 0,00 | 13 | 8,33 | ||||
| 2025-07-29 | 13F | Chicago Partners Investment Group LLC | 12 132 | 0,00 | 518 | 7,02 | ||||
| 2025-08-08 | 13F | Cetera Investment Advisers | 272 471 | 10,53 | 11 506 | 16,88 | ||||
| 2025-07-15 | 13F | BCS Wealth Management | 60 018 | 1,52 | 3 | 0,00 | ||||
| 2025-07-29 | 13F | Straight Path Wealth Management | 17 175 | 0,00 | 725 | 5,84 | ||||
| 2025-08-14 | 13F | Frisch Financial Group, Inc. | 12 896 | 1,89 | 1 | |||||
| 2025-07-21 | 13F | Ascent Group, LLC | 9 187 | 0,00 | 388 | 5,74 | ||||
| 2025-07-29 | 13F | BKD Wealth Advisors, LLC | 65 318 | −13,25 | 2 758 | −8,25 | ||||
| 2025-04-01 | 13F/A | Family Wealth Group, LLC | 0 | −100,00 | 0 | −100,00 | ||||
| 2025-08-14 | 13F | Sunbelt Securities, Inc. | 300 | 12 | ||||||
| 2025-04-22 | 13F | Castleview Partners, Llc | 0 | −100,00 | 0 | |||||
| 2025-08-14 | 13F | Colony Group, LLC | 310 752 | 1,51 | 13 123 | 7,35 | ||||
| 2025-07-11 | 13F | Farther Finance Advisors, LLC | 22 952 | −35,26 | 969 | −31,62 | ||||
| 2025-08-12 | 13F | Change Path, LLC | 32 776 | −0,80 | 1 384 | 4,93 | ||||
| 2025-08-01 | 13F | Stuart Chaussee & Associates, Inc. | 42 000 | 22,91 | 1 774 | 29,99 | ||||
| 2025-07-17 | 13F | Smith Anglin Financial, LLC | 11 130 | −7,62 | 470 | −2,29 | ||||
| 2025-07-21 | 13F | Ameritas Advisory Services, LLC | 2 105 | 89 | ||||||
| 2025-05-16 | 13F | Coppell Advisory Solutions LLC | 0 | −100,00 | 0 | |||||
| 2025-08-06 | 13F | Bullseye Investment Management, LLC | 23 600 | 0,00 | 942 | 0,00 | ||||
| 2025-08-15 | 13F | Nikulski Financial, Inc. | 6 865 | 0,00 | 290 | 5,47 | ||||
| 2025-08-11 | 13F | Principal Securities, Inc. | 2 262 | 208,17 | 96 | 227,59 | ||||
| 2025-08-14 | 13F | Benjamin Edwards Inc | 9 904 | 0,00 | 418 | 5,82 | ||||
| 2025-07-30 | 13F | Phoenix Holdings Ltd. | 13 755 | 0,00 | 581 | 5,65 | ||||
| 2025-07-28 | 13F | Axxcess Wealth Management, Llc | 6 208 | 1,64 | 262 | 7,82 | ||||
| 2025-08-08 | 13F | Firestone Capital Management | 8 287 | 0,00 | 350 | 5,76 | ||||
| 2025-08-12 | 13F | Winnow Wealth Llc | 0 | 0 | ||||||
| 2025-05-14 | 13F | Heritage Wealth Partners, LLC | 7 055 | 282 | ||||||
| 2025-07-24 | 13F | Blair William & Co/il | 35 895 | −53,54 | 1 516 | −50,89 | ||||
| 2025-09-04 | 13F/A | Advisor Group Holdings, Inc. | 691 542 | 5,38 | 29 204 | 11,45 | ||||
| 2025-08-11 | 13F | Anfield Capital Management, LLC | 313 | 13 | ||||||
| 2025-08-12 | 13F | Weaver Consulting Group | 9 473 | −1,72 | 400 | 4,17 | ||||
| 2025-07-14 | 13F | CRA Financial Services, LLC | 58 032 | 2,88 | 2 451 | 8,79 | ||||
| 2025-08-14 | 13F | FC Advisory LLC | 4 887 | 206 |