Grunnleggende statistikk
| Institusjonelle eiere | 151 total, 150 long only, 0 short only, 1 long/short - change of −0,66% MRQ |
| Gjennomsnittlig porteføljeallokering | 0.1955 % - change of −10,62% MRQ |
| Institusjonelle aksjer (Long) | 11 944 231 (ex 13D/G) - change of −0,06MM shares −0,48% MRQ |
| Institusjonell verdi (Long) | $ 327 556 USD ($1000) |
Institusjonelt eierskap og aksjonærer
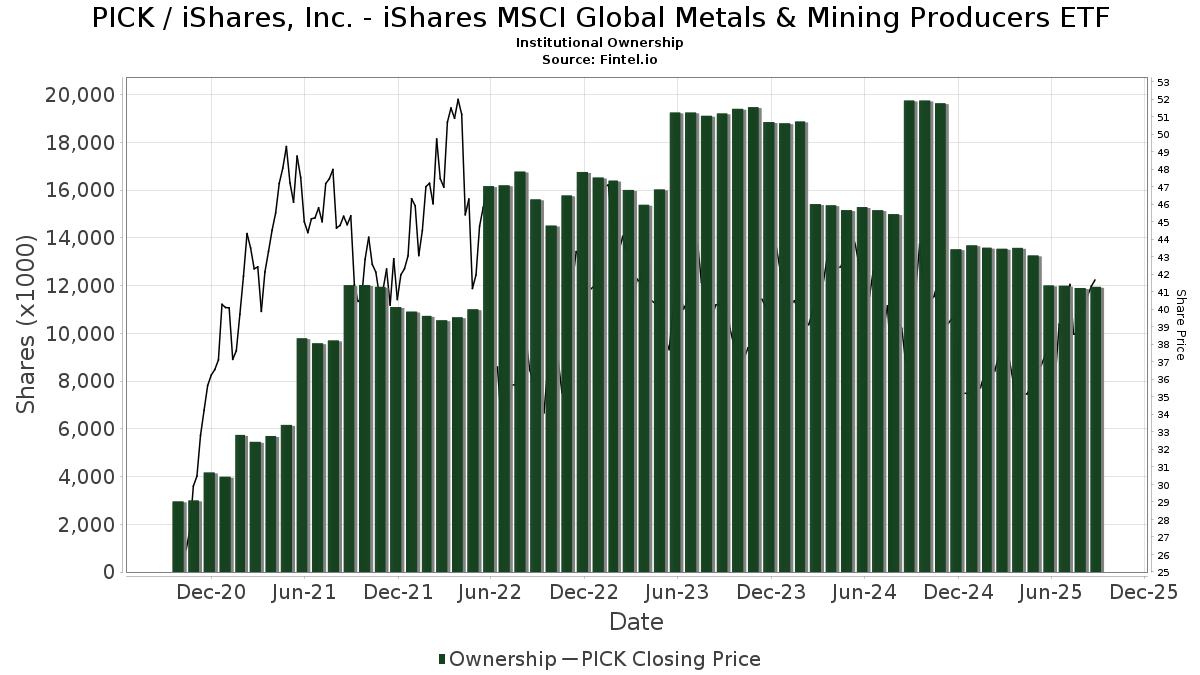
iShares, Inc. - iShares MSCI Global Metals & Mining Producers ETF (US:PICK) har 151 institusjonelle eiere og aksjonærer som har sendt inn 13D/G- eller 13F-skjemaer til Securities Exchange Commission (SEC). Disse institusjonene eier til sammen 11,944,231 aksjer. De største aksjonærene inkluderer Fisher Asset Management, LLC, Municipal Employees' Retirement System of Michigan, Greenline Partners, LLC, Bank Of America Corp /de/, Raymond James Financial Inc, Morgan Stanley, RAA - SMI 3Fourteen Real Asset Allocation ETF SMI 3Fourteen REAL Asset Allocation ETF, Jane Street Group, Llc, Goldman Sachs Group Inc, and AMTAX - AB All Market Real Return Portfolio Class A .
iShares, Inc. - iShares MSCI Global Metals & Mining Producers ETF (BATS:PICK) institusjonell eierstruktur viser nåværende posisjoner i selskapet fordelt på institusjoner og fond, samt de siste endringene i posisjonsstørrelse. De største aksjonærene kan være individuelle investorer, verdipapirfond, hedgefond eller institusjoner. Schedule 13D indikerer at investoren eier (eller har eid) mer enn 5 % av selskapet og har til hensikt (eller hadde til hensikt) å aktivt forfølge en endring i forretningsstrategien. Schedule 13G indikerer en passiv investering på over 5 %.
The share price as of September 12, 2025 is 42,36 / share. Previously, on September 13, 2024, the share price was 38,23 / share. This represents an increase of 10,80% over that period.
Fondssentiment-score
Fondssentiment Score (også kjent som akkumulering av eierskap poengsum) viser hvilke aksjer som er mest kjøpt av fond. Den er resultatet av en sofistikert, kvantitativ flerfaktormodell som identifiserer selskaper med de høyeste nivåene av institusjonell akkumulering. Beregningsmodellen for poeng bruker en kombinasjon av den totale økningen i antall offentliggjorte eiere, endringer i porteføljeallokeringen til disse eierne og andre beregninger. Tallet går fra 0 til 100, der høyere tall indikerer en høyere grad av akkumulering i forhold til sammenlignbare selskaper, der 50 er gjennomsnittet.
Oppdateringsfrekvens: Daglig
Sjekk ut Ownership Explorer, som inneholder en liste over de høyest rangerte selskapene.
Institusjonell Put/Call-forhold
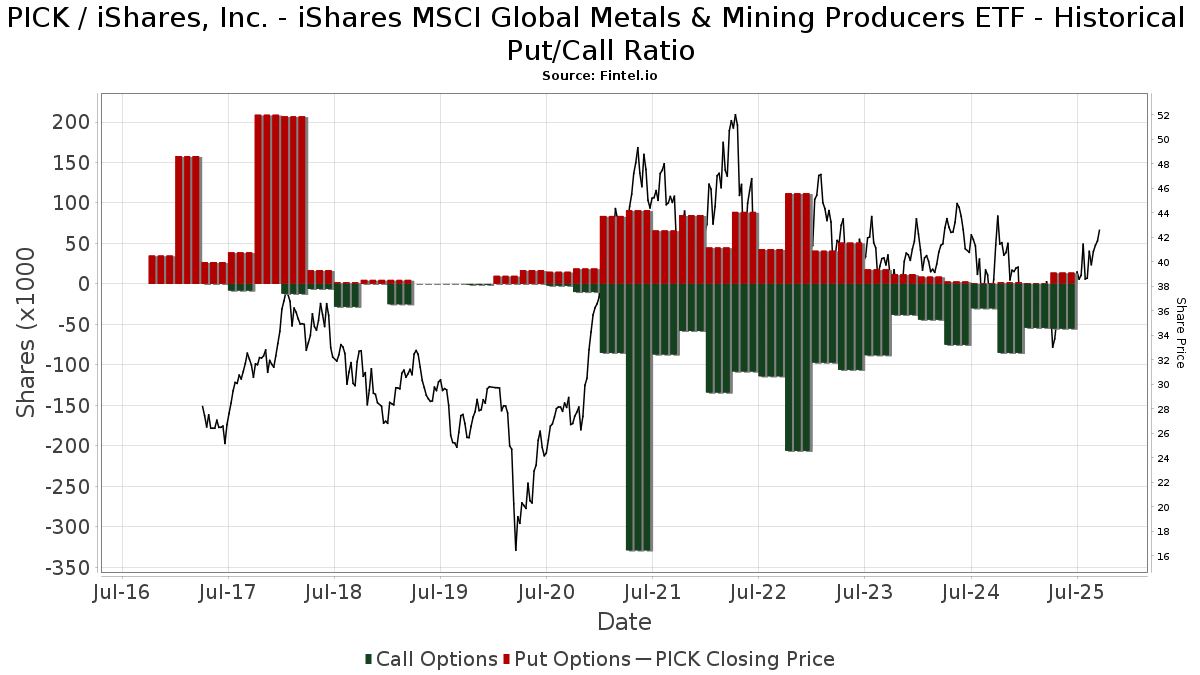
I tillegg til å rapportere standard aksje- og gjeldsemisjoner må institusjoner med mer enn 100 millioner kroner i forvaltningskapital også oppgi beholdningen av put- og callopsjoner. Siden put-opsjoner generelt indikerer et negativt sentiment, og call-opsjoner indikerer et positivt sentiment, kan vi få et inntrykk av det generelle institusjonelle sentimentet ved å plotte forholdet mellom put- og call-opsjoner. Diagrammet til høyre viser det historiske forholdet mellom put- og call-opsjoner for dette instrumentet.
Ved å bruke Put/Call-forholdet som en indikator på investorsentimentet kan man overvinne en av de viktigste svakhetene ved å bruke totalt institusjonelt eierskap, nemlig at en betydelig andel av forvaltningskapitalen investeres passivt for å følge indekser. Passivt forvaltede fond kjøper vanligvis ikke opsjoner, slik at indikatoren for put/call-forhold i større grad gjenspeiler stemningen i aktivt forvaltede fond.
13F- og NPORT-arkiveringer
Detaljer om 13F-arkiveringer er gratis. Detaljer om NP-arkiveringer krever et premium-medlemskap. Grønne rader indikerer nye posisjoner. Røde rader indikerer lukkede posisjoner. Klikk på lenke ikonet for å se hele transaksjonshistorikken.
Oppgrader
for å låse opp premiedata og eksportere til Excel. ![]() .
.
| Fildato | Kilde | Investor | Type | Gjennomsnittlig pris (estimert) |
Aksjer | Δ Aksjer (%) |
Rapportert verdi ($1000) | Verdi (%) | Portallokering (%) | |
|---|---|---|---|---|---|---|---|---|---|---|
| 2025-08-14 | 13F | Principia Wealth Advisory, LLC | 3 280 | 123 | ||||||
| 2025-08-08 | 13F | Emerald Investment Partners, Llc | 129 | 5 | ||||||
| 2025-08-06 | 13F | Rialto Wealth Management, LLC | 669 | 0,00 | 25 | 4,17 | ||||
| 2025-08-12 | 13F | MAI Capital Management | 313 | 0,00 | 12 | 0,00 | ||||
| 2025-08-13 | 13F | Tls Advisors Llc | 100 994 | −49,38 | 4 | −57,14 | ||||
| 2025-07-21 | 13F | Synergy Financial Management, LLC | 5 549 | 209 | ||||||
| 2025-08-14 | 13F | CoreCap Advisors, LLC | 55 455 | −34,53 | 2 085 | −31,39 | ||||
| 2025-07-14 | 13F | U.S. Capital Wealth Advisors, LLC | 27 936 | −12,59 | 1 050 | −8,38 | ||||
| 2025-08-14 | 13F | Financial Advisory Service, Inc. | 1 649 | 1,41 | 62 | 5,17 | ||||
| 2025-08-13 | 13F | Northwestern Mutual Wealth Management Co | 2 560 | −73,85 | 96 | −72,65 | ||||
| 2025-07-15 | 13F | Fifth Third Bancorp | 250 | 0,00 | 9 | 12,50 | ||||
| 2025-07-14 | 13F | Opal Wealth Advisors, LLC | 841 | 32 | ||||||
| 2025-07-28 | 13F | Axxcess Wealth Management, Llc | 5 328 | 200 | ||||||
| 2025-08-11 | 13F | Strategic Wealth Partners, Ltd. | 360 | 14 | ||||||
| 2025-08-14 | 13F | Fmr Llc | 623 | −46,57 | 23 | −43,90 | ||||
| 2025-05-14 | 13F | Lionshead Wealth Management, LLC | 0 | −100,00 | 0 | |||||
| 2025-04-28 | 13F | Pinnacle Financial Partners Inc | 2 571 | 0,00 | 90 | −19,82 | ||||
| 2025-07-18 | 13F | Union Bancaire Privee, UBP SA | 5 347 | 0,00 | 202 | 4,12 | ||||
| 2025-07-24 | 13F | Ronald Blue Trust, Inc. | 195 | 0,00 | 7 | 16,67 | ||||
| 2025-07-08 | 13F | Parallel Advisors, LLC | 351 | 0,00 | 13 | 8,33 | ||||
| 2025-08-14 | 13F | State Street Corp | 5 600 | −37,78 | 211 | −34,78 | ||||
| 2025-08-13 | 13F | Fort Sheridan Advisors Llc | 9 408 | −2,43 | 354 | 2,32 | ||||
| 2025-08-14 | 13F | Synovus Financial Corp | 65 658 | 0,00 | 2 469 | 4,80 | ||||
| 2025-07-31 | 13F | Wealthfront Advisers Llc | 43 404 | 5,68 | 1 632 | 10,73 | ||||
| 2025-08-08 | 13F | Pnc Financial Services Group, Inc. | 3 006 | 0,00 | 113 | 5,61 | ||||
| 2025-08-14 | 13F | Toroso Investments, LLC | 116 268 | −41,41 | 4 372 | −38,61 | ||||
| 2025-08-14 | 13F | Stamos Capital Partners, L.p. | 41 223 | 50,42 | 1 550 | 57,58 | ||||
| 2025-07-08 | 13F | Webster Bank, N. A. | 318 | 0,00 | 12 | 0,00 | ||||
| 2025-08-12 | 13F | LPL Financial LLC | 92 203 | −0,08 | 3 467 | 4,71 | ||||
| 2025-08-13 | 13F | Quadrature Capital Ltd | 0 | −100,00 | 0 | |||||
| 2025-08-14 | 13F | GWM Advisors LLC | 433 | 0,93 | 16 | 6,67 | ||||
| 2025-08-08 | 13F | Hartland & Co., LLC | 0 | −100,00 | 0 | |||||
| 2025-08-11 | 13F | HighTower Advisors, LLC | 31 940 | 29,43 | 1 201 | 35,59 | ||||
| 2025-08-11 | 13F | Aptus Capital Advisors, LLC | 357 | 37,31 | 13 | 44,44 | ||||
| 2025-08-12 | 13F | TCTC Holdings, LLC | 2 825 | 0,00 | 106 | 4,95 | ||||
| 2025-07-23 | 13F | Meitav Dash Investments Ltd | 7 692 | 0,00 | 289 | 5,09 | ||||
| 2025-08-12 | 13F | Choate Investment Advisors | 2 378 | 89 | ||||||
| 2025-08-11 | 13F | Rothschild Investment Llc | 0 | −100,00 | 0 | |||||
| 2025-07-03 | 13F | JBGlobal.com LLC | 0 | −100,00 | 0 | |||||
| 2025-07-25 | 13F | Retirement Planning Group, Llc / Ny | 15 690 | −8,09 | 590 | −3,76 | ||||
| 2025-08-14 | 13F | Hrt Financial Lp | 6 763 | 0 | ||||||
| 2025-05-05 | 13F | Lindbrook Capital, Llc | 0 | −100,00 | 0 | |||||
| 2025-05-16 | 13F/A | Kestra Investment Management, LLC | 0 | −100,00 | 0 | |||||
| 2025-07-22 | 13F | Valley National Advisers Inc | 155 | −52,74 | 0 | |||||
| 2025-04-22 | 13F | Verde Servicos Internacionais S.A. | 0 | −100,00 | 0 | |||||
| 2025-08-12 | 13F | Founders Financial Alliance, LLC | 50 | −16,67 | 2 | −50,00 | ||||
| 2025-07-25 | 13F | Northwest Capital Management Inc | 459 | 0,00 | 17 | 6,25 | ||||
| 2025-08-12 | 13F | O'shaughnessy Asset Management, Llc | 1 | −96,97 | 0 | −100,00 | ||||
| 2025-08-14 | 13F | D. E. Shaw & Co., Inc. | 9 766 | −29,53 | 367 | −26,16 | ||||
| 2025-07-14 | 13F | Abound Wealth Management | 1 152 | 1,95 | 43 | 7,50 | ||||
| 2025-08-14 | 13F | Raymond James Financial Inc | 283 792 | 2,54 | 10 671 | 7,45 | ||||
| 2025-08-12 | 13F | Steward Partners Investment Advisory, Llc | 5 943 | 0,85 | 223 | 5,69 | ||||
| 2025-07-25 | 13F | Stonehage Fleming Financial Services Holdings Ltd | 0 | −100,00 | 0 | |||||
| 2025-08-11 | 13F | Nomura Asset Management Co Ltd | 15 523 | 0,00 | 584 | 4,86 | ||||
| 2025-08-13 | 13F | Baird Financial Group, Inc. | 12 738 | −47,62 | 479 | −45,18 | ||||
| 2025-03-24 | 13F/A | Wellington Management Group Llp | 0 | −100,00 | 0 | |||||
| 2025-08-12 | 13F | Pathstone Holdings, LLC | 12 295 | 0,00 | 462 | 4,76 | ||||
| 2025-07-14 | 13F | Clear Harbor Asset Management, LLC | 51 348 | 0,65 | 1 931 | 5,46 | ||||
| 2025-07-17 | 13F | Elwood & Goetz Wealth Advisory Group, LLC | 17 496 | 13,89 | 658 | 19,24 | ||||
| 2025-08-14 | 13F | Ameriprise Financial Inc | 87 253 | 3,86 | 3 281 | 8,83 | ||||
| 2025-07-21 | 13F | Ameritas Advisory Services, LLC | 371 | 14 | ||||||
| 2025-08-04 | 13F | Mesirow Financial Investment Management, Inc. | 40 538 | −51,46 | 1 524 | −49,13 | ||||
| 2025-08-07 | 13F | Resolute Advisors LLC | 7 836 | 12,15 | 295 | 17,60 | ||||
| 2025-07-24 | 13F | Us Bancorp \de\ | 11 109 | 7 835,00 | 418 | 8 240,00 | ||||
| 2025-08-14 | 13F | Bnp Paribas Arbitrage, Sa | 17 979 | −28,34 | 676 | −24,89 | ||||
| 2025-07-31 | 13F | Cambridge Investment Research Advisors, Inc. | 14 112 | −69,09 | 1 | −100,00 | ||||
| 2025-05-12 | 13F | Hirtle Callaghan & Co LLC | 0 | −100,00 | 0 | |||||
| 2025-08-08 | 13F | IMA Wealth, Inc. | 13 | 0,00 | 0 | |||||
| 2025-08-08 | 13F | Cetera Investment Advisers | 14 990 | −34,41 | 564 | −31,26 | ||||
| 2025-08-14 | 13F | Susquehanna International Group, Llp | 86 428 | 3 250 | ||||||
| 2025-08-08 | 13F | Gts Securities Llc | 146 052 | 5 492 | ||||||
| 2025-07-29 | 13F | Angeles Wealth Management, Llc | 0 | −100,00 | 0 | |||||
| 2025-08-14 | 13F | Susquehanna International Group, Llp | Call | 6 400 | −49,21 | 241 | −46,90 | |||
| 2025-05-15 | 13F | Two Sigma Securities, Llc | 0 | −100,00 | 0 | |||||
| 2025-08-07 | 13F | Nwam Llc | 0 | −100,00 | 0 | |||||
| 2025-08-14 | 13F | Federation des caisses Desjardins du Quebec | 503 | −34,08 | 19 | −33,33 | ||||
| 2025-07-15 | 13F | Colonial River Wealth Management, LLC | 5 328 | 210 | ||||||
| 2025-08-12 | 13F | Jpmorgan Chase & Co | 6 535 | −3,36 | 246 | 1,24 | ||||
| 2025-08-15 | 13F | CI Private Wealth, LLC | 44 315 | −49,69 | 1 666 | −47,28 | ||||
| 2025-09-04 | 13F/A | Advisor Group Holdings, Inc. | 22 345 | −4,21 | 841 | 0,36 | ||||
| 2025-07-28 | 13F | Harbour Investments, Inc. | 223 | −23,10 | 8 | −20,00 | ||||
| 2025-08-12 | 13F | CIBC Private Wealth Group, LLC | 1 700 | −59,85 | 64 | −50,78 | ||||
| 2025-08-13 | 13F | Northern Trust Corp | 17 285 | 0,00 | 650 | 4,68 | ||||
| 2025-07-18 | 13F | PFG Investments, LLC | 7 034 | 1,34 | 264 | 6,02 | ||||
| 2025-07-31 | 13F | City State Bank | 800 | 0,00 | 30 | 7,14 | ||||
| 2025-08-14 | 13F | Stifel Financial Corp | 25 620 | −16,56 | 963 | −12,53 | ||||
| 2025-08-14 | 13F | Comerica Bank | 1 655 | −28,20 | 62 | −24,39 | ||||
| 2025-08-11 | 13F | Heritage Wealth Advisors | 11 700 | 0,00 | 440 | 4,77 | ||||
| 2025-08-04 | 13F | Savvy Advisors, Inc. | 32 105 | −2,45 | 1 207 | 2,29 | ||||
| 2025-05-08 | 13F | Strategic Advocates LLC | 0 | −100,00 | 0 | |||||
| 2025-08-14 | 13F | Old Mission Capital Llc | 31 093 | −22,64 | 1 169 | −18,93 | ||||
| 2025-07-28 | 13F | BRYN MAWR TRUST Co | 0 | −100,00 | 0 | |||||
| 2025-08-13 | 13F | Continuum Advisory, LLC | 0 | −100,00 | 0 | |||||
| 2025-07-17 | 13F | BFI Infinity Ltd. | 10 342 | 0,00 | 389 | 4,58 | ||||
| 2025-08-14 | 13F | Bank Of America Corp /de/ | 544 102 | 83,58 | 20 458 | 92,38 | ||||
| 2025-05-12 | 13F | Townsquare Capital Llc | 0 | −100,00 | 0 | |||||
| 2025-08-12 | 13F | Insigneo Advisory Services, Llc | 6 840 | 0,59 | 257 | 5,76 | ||||
| 2025-08-13 | 13F | ASB Consultores, LLC | 0 | −100,00 | 0 | |||||
| 2025-08-13 | 13F | Fisher Asset Management, LLC | 3 332 961 | −4,75 | 125 319 | −0,19 | ||||
| 2025-07-25 | 13F | Cwm, Llc | 1 310 | 7,73 | 0 | |||||
| 2025-08-14 | 13F | Citadel Advisors Llc | Call | 41 100 | 183,45 | 1 545 | 197,12 | |||
| 2025-08-14 | 13F | Citadel Advisors Llc | 102 815 | 534,00 | 3 866 | 565,23 | ||||
| 2025-08-14 | 13F | Citadel Advisors Llc | Put | 14 700 | 673,68 | 553 | 711,76 | |||
| 2025-08-01 | 13F | Envestnet Asset Management Inc | 36 684 | 5,28 | 1 379 | 10,32 | ||||
| 2025-08-13 | 13F | Scotia Capital Inc. | 26 921 | −38,87 | 1 012 | −35,95 | ||||
| 2025-07-16 | 13F | ORG Wealth Partners, LLC | 49 | 0,00 | 2 | 0,00 | ||||
| 2025-05-14 | 13F | Barometer Capital Management Inc. | 0 | −100,00 | 0 | |||||
| 2025-07-08 | 13F | Arlington Trust Co LLC | 1 500 | 0,00 | 56 | 5,66 | ||||
| 2025-08-06 | 13F | Black Swift Group, LLC | 8 800 | 0,00 | 331 | 4,76 | ||||
| 2025-05-07 | 13F | Phoenix Holdings Ltd. | 0 | −100,00 | 0 | −100,00 | ||||
| 2025-07-29 | 13F | Stratos Wealth Advisors, LLC | 58 627 | −61,85 | 2 204 | −60,02 | ||||
| 2025-07-25 | 13F | Almanack Investment Partners, LLC. | 144 807 | 8,54 | 5 445 | 13,72 | ||||
| 2025-05-12 | 13F | Simplex Trading, Llc | 0 | −100,00 | 0 | |||||
| 2025-08-29 | NP | GDMA - Gadsden Dynamic Multi-Asset ETF | 98 312 | −21,10 | 3 697 | −17,32 | ||||
| 2025-04-28 | 13F | Clarity Capital Partners LLC | 0 | −100,00 | 0 | |||||
| 2025-08-14 | 13F | Wealth Preservation Advisors, LLC | 53 | 0,00 | 2 | 0,00 | ||||
| 2025-07-31 | 13F | Allied Investment Advisors, LLC | 67 916 | 109,44 | 2 554 | 119,52 | ||||
| 2025-08-08 | 13F | Avantax Advisory Services, Inc. | 19 270 | 47,23 | 725 | 54,37 | ||||
| 2025-05-07 | 13F | Second Half Financial Partners, LLC | 0 | −100,00 | 0 | |||||
| 2025-08-14 | 13F | UBS Group AG | 84 144 | 6,22 | 3 164 | 11,29 | ||||
| 2025-07-17 | 13F | Barry Investment Advisors, LLC | 96 317 | −2,36 | 3 622 | 2,32 | ||||
| 2025-08-01 | 13F | Motco | 200 | 8 | ||||||
| 2025-08-11 | 13F | Empowered Funds, LLC | 98 579 | −20,88 | 3 707 | −17,09 | ||||
| 2025-08-11 | 13F | Principal Securities, Inc. | 803 | −8,12 | 30 | 0,00 | ||||
| 2025-07-25 | 13F | Endowment Wealth Management, Inc. | 11 408 | −0,91 | 429 | 3,63 | ||||
| 2025-07-28 | 13F | Kiker Wealth Management, LLC | 851 | 32 | ||||||
| 2025-08-11 | 13F | Citigroup Inc | 1 | 0,00 | 0 | |||||
| 2025-08-14 | 13F | Daiwa Securities Group Inc. | 20 100 | 0,00 | 1 | |||||
| 2025-08-04 | 13F | Municipal Employees' Retirement System of Michigan | 3 032 992 | 0,00 | 114 | 5,56 | ||||
| 2025-08-13 | 13F | Schroder Investment Management Group | 0 | −100,00 | 0 | |||||
| 2025-07-11 | 13F | Farther Finance Advisors, LLC | 98 | 0,00 | 4 | 0,00 | ||||
| 2025-08-12 | 13F | Trans-Canada Capital Inc. | 90 250 | 0,00 | 3 393 | 4,79 | ||||
| 2025-07-24 | 13F | IFP Advisors, Inc | 600 | 0,00 | 23 | 4,76 | ||||
| 2025-07-07 | 13F | Thurston, Springer, Miller, Herd & Titak, Inc. | 210 | 0,00 | 8 | 0,00 | ||||
| 2025-08-06 | 13F | AE Wealth Management LLC | 1 957 | 6,30 | 74 | 10,61 | ||||
| 2025-08-08 | 13F | Family Firm, Inc. | 37 064 | 7,62 | 1 394 | 12,79 | ||||
| 2025-08-12 | 13F | Howe & Rusling Inc | 106 | 0,00 | 4 | 0,00 | ||||
| 2025-07-18 | 13F | Parsons Capital Management Inc/ri | 7 840 | 0,00 | 295 | 4,63 | ||||
| 2025-07-14 | 13F | Sowell Financial Services LLC | 10 811 | 0,68 | 406 | 5,45 | ||||
| 2025-07-17 | 13F | Smith Anglin Financial, LLC | 0 | −100,00 | 0 | |||||
| 2025-08-14 | 13F | CIBC World Markets Inc. | 33 827 | 248,80 | 1 272 | 266,28 | ||||
| 2025-08-06 | 13F | Commonwealth Equity Services, Llc | 21 851 | −21,84 | 1 | −100,00 | ||||
| 2025-08-14 | 13F | Goldman Sachs Group Inc | 218 703 | −19,78 | 8 223 | −15,94 | ||||
| 2025-08-15 | 13F | Tower Research Capital LLC (TRC) | 149 | 413,79 | 6 | 400,00 | ||||
| 2025-03-27 | NP | AMTAX - AB All Market Real Return Portfolio Class A | 168 830 | 0,00 | 5 988 | −11,63 | ||||
| 2025-05-07 | 13F | Evermay Wealth Management Llc | 0 | −100,00 | 0 | −100,00 | ||||
| 2025-07-10 | 13F | Wealth Enhancement Advisory Services, Llc | 7 428 | −22,59 | 291 | −15,70 | ||||
| 2025-08-14 | 13F | Jane Street Group, Llc | Call | 0 | −100,00 | 0 | ||||
| 2025-07-31 | 13F | Oppenheimer & Co Inc | 17 393 | 654 | ||||||
| 2025-08-11 | 13F | Bedell Frazier Investment Counseling, LLC | 76 157 | 2 864 | ||||||
| 2025-08-18 | 13F/A | National Bank Of Canada /fi/ | 950 | −3,26 | 36 | 0,00 | ||||
| 2025-08-06 | 13F | Prospera Financial Services Inc | 0 | −100,00 | 0 | |||||
| 2025-04-30 | 13F | Banque Pictet & Cie Sa | 0 | −100,00 | 0 | |||||
| 2025-07-08 | 13F | Nbc Securities, Inc. | 0 | −100,00 | 0 | |||||
| 2025-07-23 | 13F | Vontobel Holding Ltd. | 30 750 | 0,00 | 1 156 | 4,81 | ||||
| 2025-08-11 | 13F | CBIZ Investment Advisory Services, LLC | 246 | 1,65 | 9 | 12,50 | ||||
| 2025-08-13 | 13F | Greenwich Wealth Management LLC | 17 219 | −0,43 | 1 | |||||
| 2025-04-10 | 13F | SMI Advisory Services, LLC | 0 | −100,00 | 0 | |||||
| 2025-07-17 | 13F | Vermillion Wealth Management, Inc. | 15 770 | 13,10 | 593 | 18,40 | ||||
| 2025-07-09 | 13F | Breakwater Capital Group | 0 | −100,00 | 0 | |||||
| 2025-08-14 | 13F | Glenmede Investment Management, LP | 2 524 | 95 | ||||||
| 2025-08-14 | 13F | Mml Investors Services, Llc | 8 355 | 2,72 | 0 | |||||
| 2025-04-29 | 13F | Capital Investment Advisory Services, LLC | 0 | −100,00 | 0 | |||||
| 2025-08-13 | 13F | Argyle Capital Partners, LLC | 9 838 | 13,30 | 370 | 18,65 | ||||
| 2025-08-13 | 13F | Ted Buchan & Co | 6 680 | −13,58 | 251 | −9,39 | ||||
| 2025-08-14 | 13F/A | Rockefeller Capital Management L.P. | 30 257 | −29,97 | 1 138 | −26,65 | ||||
| 2025-07-16 | 13F | Essex Financial Services, Inc. | 10 455 | −75,38 | 393 | −74,20 | ||||
| 2025-08-14 | 13F | Royal Bank Of Canada | 125 471 | 1 088,51 | 4 718 | 1 144,85 | ||||
| 2025-08-13 | 13F | Transce3nd, LLC | 23 | 360,00 | 1 | |||||
| 2025-05-14 | 13F | Renaissance Technologies Llc | 0 | −100,00 | 0 | |||||
| 2025-07-18 | 13F | Truist Financial Corp | 19 460 | 4,53 | 732 | 9,60 | ||||
| 2025-08-12 | 13F | Running Point Capital Advisors, LLC | 0 | −100,00 | 0 | |||||
| 2025-08-12 | 13F | Proequities, Inc. | 0 | 0 | ||||||
| 2025-08-05 | 13F | Bank Of Montreal /can/ | 11 645 | 2,79 | 438 | 7,64 | ||||
| 2025-05-15 | 13F | Alliancebernstein L.p. | 0 | −100,00 | 0 | −100,00 | ||||
| 2025-07-24 | 13F | Comprehensive Money Management Services LLC | 21 902 | −4,04 | 824 | 0,61 | ||||
| 2025-06-30 | NP | SMILX - SMI 50/40/10 Fund | 2 890 | −55,74 | 102 | −61,45 | ||||
| 2025-07-24 | 13F | Stonebridge Financial Group, LLC | 0 | −100,00 | 0 | |||||
| 2025-08-29 | NP | RAA - SMI 3Fourteen Real Asset Allocation ETF SMI 3Fourteen REAL Asset Allocation ETF | 263 601 | 22,94 | 9 911 | 28,85 | ||||
| 2025-05-15 | 13F | Glenmede Trust Co Na | 1 129 | 0,00 | 41 | 2,56 | ||||
| 2025-08-08 | 13F | Creative Planning | 15 263 | 10,49 | 574 | 15,76 | ||||
| 2025-08-13 | 13F | Jones Financial Companies Lllp | 4 089 | −9,33 | 155 | −6,10 | ||||
| 2025-08-18 | 13F | Wolverine Trading, Llc | Call | 8 200 | 310 | |||||
| 2025-08-14 | 13F | Jane Street Group, Llc | 262 488 | 73,40 | 9 870 | 81,72 | ||||
| 2025-07-21 | 13F | J. Safra Sarasin Holding AG | 6 000 | 0,00 | 226 | 4,65 | ||||
| 2025-04-28 | 13F | Fedenia Advisers LLC | 0 | −100,00 | 0 | |||||
| 2025-08-14 | 13F | Wells Fargo & Company/mn | 22 951 | −44,23 | 863 | −41,60 | ||||
| 2025-06-30 | NP | SMIDX - SMI Dynamic Allocation Fund | 7 690 | −25,27 | 270 | −25,82 | ||||
| 2025-08-07 | 13F | Allworth Financial LP | 97 | −70,78 | 4 | −72,73 | ||||
| 2025-07-30 | 13F | Whittier Trust Co Of Nevada Inc | 110 | 0,00 | 4 | 33,33 | ||||
| 2025-05-12 | 13F | Kohmann Bosshard Financial Services, LLC | 0 | −100,00 | 0 | |||||
| 2025-08-14 | 13F | Erste Asset Management GmbH | 2 000 | 0,00 | 75 | 5,63 | ||||
| 2025-07-16 | 13F | Strategic Investment Solutions, Inc. /IL | 0 | −100,00 | 0 | |||||
| 2025-05-09 | 13F/A | Oversea-Chinese Banking CORP Ltd | 0 | −100,00 | 0 | −100,00 | ||||
| 2025-08-14 | 13F | Greenline Partners, LLC | 555 538 | 147,29 | 20 888 | 159,16 | ||||
| 2025-08-11 | 13F | TD Waterhouse Canada Inc. | 629 | −8,31 | 24 | −4,17 | ||||
| 2025-08-15 | 13F | Morgan Stanley | 283 027 | −1,81 | 10 642 | 2,89 |