Grunnleggende statistikk
| Institusjonelle eiere | 163 total, 163 long only, 0 short only, 0 long/short - change of −1,81% MRQ |
| Gjennomsnittlig porteføljeallokering | 0.0514 % - change of −3,49% MRQ |
| Institusjonelle aksjer (Long) | 10 540 940 (ex 13D/G) - change of −0,05MM shares −0,51% MRQ |
| Institusjonell verdi (Long) | $ 143 851 USD ($1000) |
Institusjonelt eierskap og aksjonærer
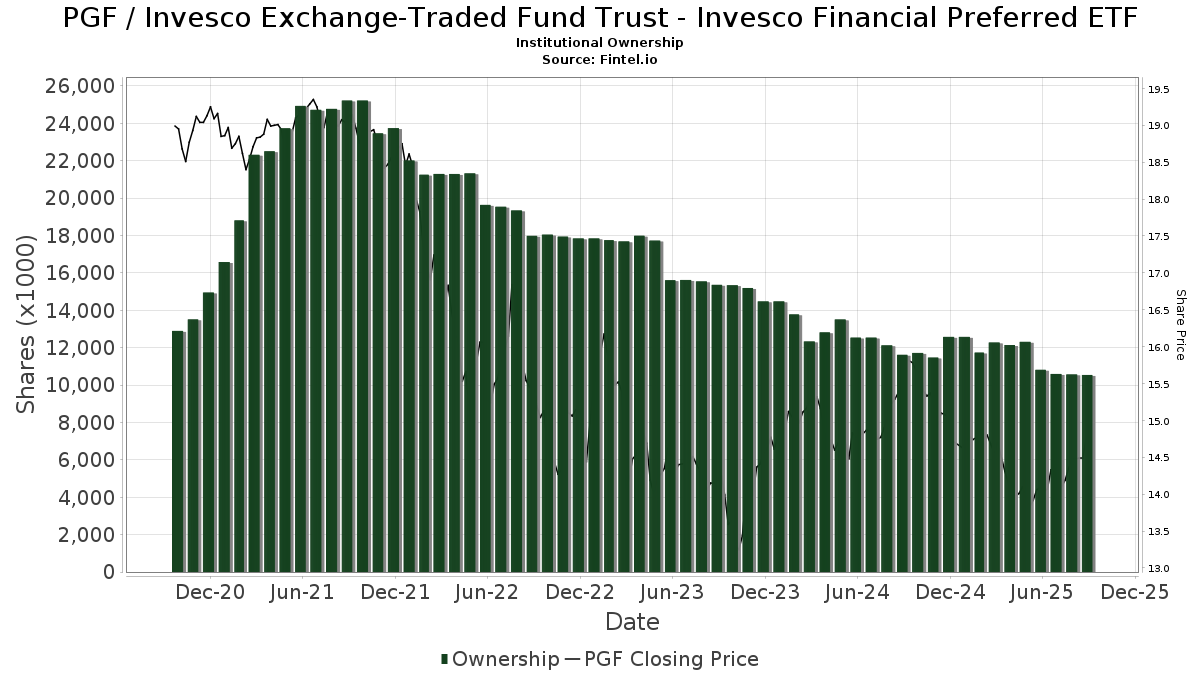
Invesco Exchange-Traded Fund Trust - Invesco Financial Preferred ETF (US:PGF) har 163 institusjonelle eiere og aksjonærer som har sendt inn 13D/G- eller 13F-skjemaer til Securities Exchange Commission (SEC). Disse institusjonene eier til sammen 10,540,940 aksjer. De største aksjonærene inkluderer Morgan Stanley, UBS Group AG, LPL Financial LLC, Wells Fargo & Company/mn, Bank Of America Corp /de/, Private Advisor Group, LLC, Evoke Wealth, Llc, North Star Investment Management Corp., Investors Research Corp, and Orion Portfolio Solutions, LLC .
Invesco Exchange-Traded Fund Trust - Invesco Financial Preferred ETF (ARCA:PGF) institusjonell eierstruktur viser nåværende posisjoner i selskapet fordelt på institusjoner og fond, samt de siste endringene i posisjonsstørrelse. De største aksjonærene kan være individuelle investorer, verdipapirfond, hedgefond eller institusjoner. Schedule 13D indikerer at investoren eier (eller har eid) mer enn 5 % av selskapet og har til hensikt (eller hadde til hensikt) å aktivt forfølge en endring i forretningsstrategien. Schedule 13G indikerer en passiv investering på over 5 %.
The share price as of September 10, 2025 is 14,78 / share. Previously, on September 11, 2024, the share price was 15,57 / share. This represents a decline of 5,07% over that period.
Fondssentiment-score
Fondssentiment Score (også kjent som akkumulering av eierskap poengsum) viser hvilke aksjer som er mest kjøpt av fond. Den er resultatet av en sofistikert, kvantitativ flerfaktormodell som identifiserer selskaper med de høyeste nivåene av institusjonell akkumulering. Beregningsmodellen for poeng bruker en kombinasjon av den totale økningen i antall offentliggjorte eiere, endringer i porteføljeallokeringen til disse eierne og andre beregninger. Tallet går fra 0 til 100, der høyere tall indikerer en høyere grad av akkumulering i forhold til sammenlignbare selskaper, der 50 er gjennomsnittet.
Oppdateringsfrekvens: Daglig
Sjekk ut Ownership Explorer, som inneholder en liste over de høyest rangerte selskapene.
Institusjonell Put/Call-forhold
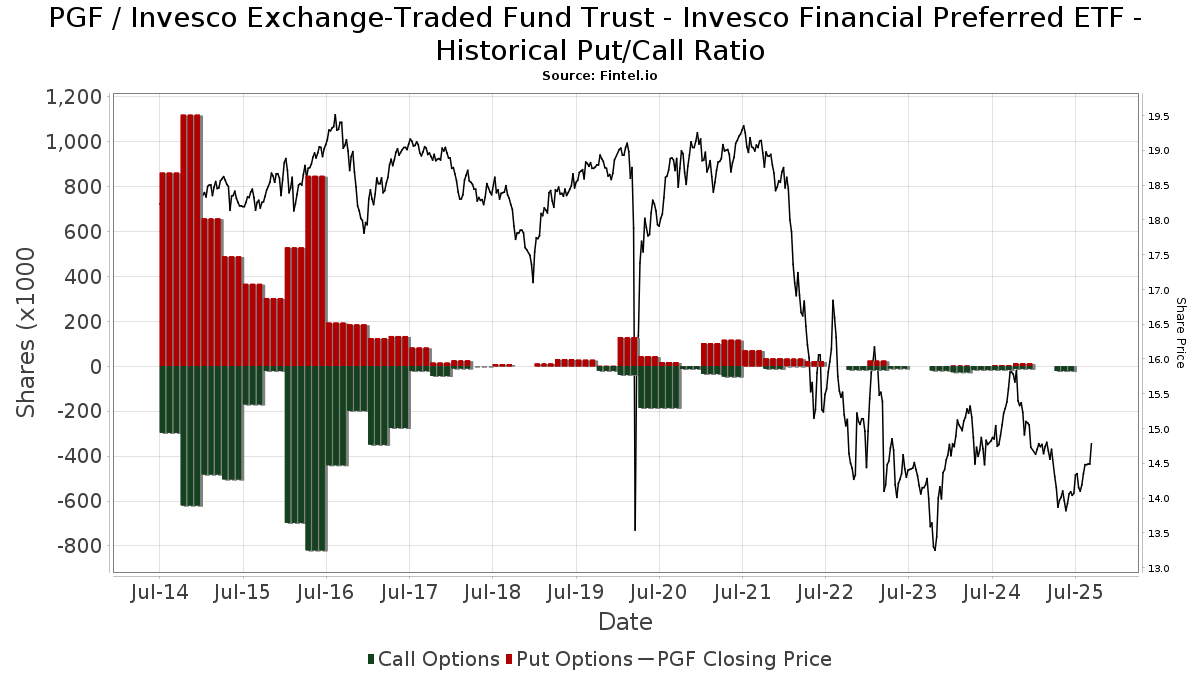
I tillegg til å rapportere standard aksje- og gjeldsemisjoner må institusjoner med mer enn 100 millioner kroner i forvaltningskapital også oppgi beholdningen av put- og callopsjoner. Siden put-opsjoner generelt indikerer et negativt sentiment, og call-opsjoner indikerer et positivt sentiment, kan vi få et inntrykk av det generelle institusjonelle sentimentet ved å plotte forholdet mellom put- og call-opsjoner. Diagrammet til høyre viser det historiske forholdet mellom put- og call-opsjoner for dette instrumentet.
Ved å bruke Put/Call-forholdet som en indikator på investorsentimentet kan man overvinne en av de viktigste svakhetene ved å bruke totalt institusjonelt eierskap, nemlig at en betydelig andel av forvaltningskapitalen investeres passivt for å følge indekser. Passivt forvaltede fond kjøper vanligvis ikke opsjoner, slik at indikatoren for put/call-forhold i større grad gjenspeiler stemningen i aktivt forvaltede fond.
13F- og NPORT-arkiveringer
Detaljer om 13F-arkiveringer er gratis. Detaljer om NP-arkiveringer krever et premium-medlemskap. Grønne rader indikerer nye posisjoner. Røde rader indikerer lukkede posisjoner. Klikk på lenke ikonet for å se hele transaksjonshistorikken.
Oppgrader
for å låse opp premiedata og eksportere til Excel. ![]() .
.
| Fildato | Kilde | Investor | Type | Gjennomsnittlig pris (estimert) |
Aksjer | Δ Aksjer (%) |
Rapportert verdi ($1000) | Verdi (%) | Portallokering (%) | |
|---|---|---|---|---|---|---|---|---|---|---|
| 2025-08-14 | 13F | Comerica Bank | 27 096 | −10,41 | 382 | −11,37 | ||||
| 2025-08-14 | 13F | Susquehanna International Group, Llp | 78 246 | 56,62 | 1 104 | 54,84 | ||||
| 2025-08-08 | 13F | Cetera Investment Advisers | 49 445 | −6,76 | 698 | −7,93 | ||||
| 2025-08-15 | 13F | Kestra Advisory Services, LLC | 29 614 | 3,09 | 418 | 1,71 | ||||
| 2025-05-15 | 13F | Citadel Advisors Llc | 0 | −100,00 | 0 | −100,00 | ||||
| 2025-04-25 | 13F | Essex Financial Services, Inc. | 0 | −100,00 | 0 | |||||
| 2025-08-08 | 13F | Emerald Investment Partners, Llc | 145 | −88,92 | 2 | −88,89 | ||||
| 2025-08-12 | 13F | Global Retirement Partners, LLC | 300 | 0,00 | 4 | 0,00 | ||||
| 2025-08-11 | 13F | HighTower Advisors, LLC | 72 147 | 0,21 | 1 018 | −1,07 | ||||
| 2025-08-08 | 13F | Fiera Capital Corp | 17 275 | 0,00 | 244 | −1,22 | ||||
| 2025-07-22 | 13F | Wealthcare Advisory Partners LLC | 29 994 | 0,08 | 423 | −0,94 | ||||
| 2025-08-06 | 13F | Mcrae Capital Management Inc | 16 203 | 0,00 | 229 | −1,30 | ||||
| 2025-07-10 | 13F | Triangle Securities Wealth Management | 10 147 | −5,00 | 143 | −5,92 | ||||
| 2025-07-24 | 13F | IFP Advisors, Inc | 0 | −100,00 | 0 | −100,00 | ||||
| 2025-08-11 | 13F | Delta Asset Management Llc/tn | 124 | 0,00 | 2 | 0,00 | ||||
| 2025-08-12 | 13F | Ameritas Investment Partners, Inc. | 665 | 1,53 | 9 | 0,00 | ||||
| 2025-07-17 | 13F | Alpine Bank Wealth Management | 0 | −100,00 | 0 | |||||
| 2025-08-01 | 13F | Envestnet Asset Management Inc | 52 277 | −15,77 | 738 | −16,82 | ||||
| 2025-08-08 | 13F | Advisors Capital Management, LLC | 12 938 | 1,55 | 183 | 0,55 | ||||
| 2025-08-11 | 13F | Principal Securities, Inc. | 4 260 | −25,24 | 60 | −26,83 | ||||
| 2025-07-21 | 13F | Ameritas Advisory Services, LLC | 5 948 | 84 | ||||||
| 2025-08-13 | 13F | Northwestern Mutual Wealth Management Co | 15 366 | −14,17 | 217 | −15,29 | ||||
| 2025-07-11 | 13F | Farther Finance Advisors, LLC | 11 685 | 1,71 | 165 | 0,00 | ||||
| 2025-04-22 | 13F | Synergy Financial Management, LLC | 0 | −100,00 | 0 | |||||
| 2025-08-14 | 13F | Abbot Financial Management, Inc. | 13 792 | 0,12 | 195 | −1,02 | ||||
| 2025-07-24 | 13F | Blair William & Co/il | 150 | −88,89 | 2 | −89,47 | ||||
| 2025-09-04 | 13F/A | Advisor Group Holdings, Inc. | 88 414 | 12,50 | 1 248 | 11,14 | ||||
| 2025-07-18 | 13F | Rogco, Lp | 3 619 | 147,71 | 51 | 155,00 | ||||
| 2025-08-18 | 13F | Wolverine Trading, Llc | 0 | −100,00 | 0 | |||||
| 2025-08-12 | 13F | Prudential Plc | 3 900 | 0,00 | 55 | 0,00 | ||||
| 2025-05-14 | 13F | Guggenheim Capital Llc | 0 | −100,00 | 0 | |||||
| 2025-08-12 | 13F | Boreal Capital Management LLC | 5 846 | 82 | ||||||
| 2025-08-14 | 13F | Bank Of America Corp /de/ | 676 150 | 10,69 | 9 540 | 9,38 | ||||
| 2025-05-15 | 13F | Citadel Advisors Llc | Put | 0 | −100,00 | 0 | −100,00 | |||
| 2025-08-07 | 13F | McClarren Financial Advisors, Inc. | 0 | −100,00 | 0 | |||||
| 2025-08-14 | 13F | Wealth Preservation Advisors, LLC | 500 | 0,00 | 7 | 0,00 | ||||
| 2025-08-11 | 13F | Aptus Capital Advisors, LLC | 8 194 | 47,53 | 116 | 45,57 | ||||
| 2025-08-06 | 13F | Prospera Financial Services Inc | 101 268 | −0,88 | 1 429 | −2,12 | ||||
| 2025-04-21 | 13F | Nelson, Van Denburg & Campbell Wealth Management Group, LLC | 0 | −100,00 | 0 | |||||
| 2025-07-03 | 13F | City Center Advisors, LLC | 10 052 | 142 | ||||||
| 2025-04-25 | 13F | Westside Investment Management, Inc. | 0 | −100,00 | 0 | |||||
| 2025-07-08 | 13F | Nbc Securities, Inc. | 850 | 16,44 | 0 | |||||
| 2025-08-07 | 13F | Evoke Wealth, Llc | 318 111 | 5,72 | 4 489 | 4,47 | ||||
| 2025-07-21 | 13F | Matauro, Llc | 10 008 | 141 | ||||||
| 2025-08-04 | 13F | Spire Wealth Management | 0 | −100,00 | 0 | |||||
| 2025-08-12 | 13F | CIBC Private Wealth Group, LLC | 1 | 0,00 | 0 | |||||
| 2025-07-29 | 13F | Private Trust Co Na | 11 330 | 0,00 | 160 | −1,24 | ||||
| 2025-07-10 | 13F | Signal Advisors Wealth, LLC | 177 919 | 73,82 | 2 510 | 71,80 | ||||
| 2025-08-13 | 13F/A | StoneX Group Inc. | 0 | −100,00 | 0 | −100,00 | ||||
| 2025-08-14 | 13F | Jane Street Group, Llc | 0 | −100,00 | 0 | |||||
| 2025-07-14 | 13F | Wealth Advisory Solutions, LLC | 127 078 | 1,69 | 1 793 | 0,50 | ||||
| 2025-08-05 | 13F | Garrison Bradford & Associates Inc | 5 000 | 0,00 | 71 | −1,41 | ||||
| 2025-08-08 | 13F | WASHINGTON TRUST Co | 0 | −100,00 | 0 | |||||
| 2025-08-14 | 13F | UBS Group AG | 1 111 940 | 73,32 | 15 689 | 71,26 | ||||
| 2025-08-11 | 13F | Novak & Powell Financial Services, Inc. | 12 974 | −2,44 | 183 | −3,17 | ||||
| 2025-05-09 | 13F | GeoWealth Management, LLC | 0 | −100,00 | 0 | |||||
| 2025-08-12 | 13F | Jpmorgan Chase & Co | 6 | −86,05 | 0 | |||||
| 2025-05-15 | 13F | Bank Of America Corp /de/ | Call | 0 | −100,00 | 0 | −100,00 | |||
| 2025-08-05 | 13F | Dunhill Financial, LLC | 25 | 0,00 | 0 | |||||
| 2025-08-13 | 13F | Brown Advisory Inc | 13 758 | −37,06 | 194 | −37,82 | ||||
| 2025-08-12 | 13F | Running Point Capital Advisors, LLC | 8 506 | 9,67 | 120 | 9,09 | ||||
| 2025-07-29 | 13F | Stephens Inc /ar/ | 10 971 | −10,11 | 155 | −11,49 | ||||
| 2025-08-12 | 13F | Integrated Advisors Network LLC | 81 734 | −50,64 | 1 153 | −51,23 | ||||
| 2025-08-12 | 13F | Proequities, Inc. | 0 | 0 | ||||||
| 2025-07-09 | 13F | Byrne Asset Management LLC | 1 350 | 0,00 | 19 | 0,00 | ||||
| 2025-08-14 | 13F | Mariner, LLC | 0 | −100,00 | 0 | |||||
| 2025-07-31 | 13F | Optimum Investment Advisors | 1 350 | 0,00 | 19 | 0,00 | ||||
| 2025-07-17 | 13F | Independence Bank of Kentucky | 0 | −100,00 | 0 | |||||
| 2025-08-04 | 13F | Field & Main Bank | 106 852 | −0,29 | 1 508 | −1,50 | ||||
| 2025-07-17 | 13F | Sound Income Strategies, LLC | 178 | 0,00 | 3 | 0,00 | ||||
| 2025-08-13 | 13F | Rosenblum Silverman Sutton S F Inc /ca | 57 850 | 13,61 | 816 | 12,24 | ||||
| 2025-07-31 | 13F | Avory & Company, LLC | 30 990 | −24,56 | 437 | −25,43 | ||||
| 2025-08-01 | 13F | Motco | 2 700 | 39 | ||||||
| 2025-04-30 | 13F | M&t Bank Corp | 0 | −100,00 | 0 | |||||
| 2025-08-04 | 13F | Arkadios Wealth Advisors | 10 356 | 146 | ||||||
| 2025-08-13 | 13F | Jones Financial Companies Lllp | 30 904 | 0,67 | 435 | −1,36 | ||||
| 2025-08-06 | 13F | Wedbush Securities Inc | 13 827 | −38,69 | 0 | |||||
| 2025-08-04 | 13F | JDM Financial Group LLC | 1 805 | 1,52 | 25 | 0,00 | ||||
| 2025-07-31 | 13F/A | Avion Wealth | 9 063 | 0 | ||||||
| 2025-07-14 | 13F | Farmers & Merchants Investments Inc | 0 | −100,00 | 0 | |||||
| 2025-08-11 | 13F | Heritage Wealth Advisors | 484 | 0,00 | 7 | 0,00 | ||||
| 2025-08-26 | 13F/A | Thrivent Financial For Lutherans | 16 522 | 0 | ||||||
| 2025-07-11 | 13F | Pinnacle Bancorp, Inc. | 1 000 | 0,00 | 14 | 0,00 | ||||
| 2025-07-30 | 13F | Rehmann Capital Advisory Group | 16 838 | 31,34 | 238 | 29,51 | ||||
| 2025-08-12 | 13F | Maripau Wealth Management Llc | 58 141 | 50,63 | 823 | 49,18 | ||||
| 2025-08-08 | 13F | Capital Investment Advisory Services, LLC | 562 | 1,63 | 8 | 0,00 | ||||
| 2025-08-06 | 13F | AE Wealth Management LLC | 2 350 | −2,97 | 33 | −2,94 | ||||
| 2025-07-28 | 13F | Cushing Capital Partners, LLC | 43 862 | 8,07 | 619 | 6,74 | ||||
| 2025-07-10 | 13F | Wealth Enhancement Advisory Services, Llc | 52 779 | 10,14 | 755 | 10,38 | ||||
| 2025-08-04 | 13F | Assetmark, Inc | 14 | 0 | ||||||
| 2025-07-15 | 13F | North Star Investment Management Corp. | 286 523 | −1,22 | 4 043 | −2,39 | ||||
| 2025-07-18 | 13F | Bartlett & Co. Wealth Management Llc | 950 | 0,00 | 13 | 0,00 | ||||
| 2025-08-12 | 13F | SRS Capital Advisors, Inc. | 5 185 | −7,16 | 73 | −7,59 | ||||
| 2025-07-18 | 13F | Truist Financial Corp | 23 812 | −23,20 | 332 | −25,11 | ||||
| 2025-08-01 | 13F | Vision Financial Markets Llc | 4 000 | 0,00 | 56 | −1,75 | ||||
| 2025-08-13 | 13F | Quadrant Capital Group Llc | 0 | −100,00 | 0 | |||||
| 2025-08-14 | 13F | Oxford Financial Group Ltd | 252 | 1,61 | 4 | 0,00 | ||||
| 2025-08-14 | 13F | Kovitz Investment Group Partners, LLC | 15 350 | 217 | ||||||
| 2025-07-21 | 13F | Credential Securities Inc. | 0 | −100,00 | 0 | |||||
| 2025-08-18 | 13F | Geneos Wealth Management Inc. | 150 | 0,00 | 2 | 0,00 | ||||
| 2025-07-22 | 13F | Accel Wealth Management | 52 637 | −0,60 | 743 | −1,85 | ||||
| 2025-08-12 | 13F | Steward Partners Investment Advisory, Llc | 1 122 | 0,00 | 16 | −6,25 | ||||
| 2025-08-14 | 13F | Qube Research & Technologies Ltd | 439 | 0,00 | 6 | 0,00 | ||||
| 2025-08-14 | 13F | Dearborn Partners Llc | 17 647 | −3,97 | 249 | −5,34 | ||||
| 2025-07-22 | 13F | Financial Insights, Inc. | 10 000 | 0,00 | 141 | −0,70 | ||||
| 2025-08-11 | 13F | Private Advisor Group, LLC | 370 136 | −17,15 | 5 223 | −18,14 | ||||
| 2025-07-23 | 13F | Friedenthal Financial | 5 120 | 1,55 | 72 | 0,00 | ||||
| 2025-07-25 | 13F | Valley Brook Capital Group, Inc. | 12 600 | 0,00 | 178 | −1,12 | ||||
| 2025-07-28 | 13F | Duncker Streett & Co Inc | 272 | 0,00 | 4 | 0,00 | ||||
| 2025-07-24 | 13F | MSH Capital Advisors LLC | 10 566 | −2,72 | 149 | −3,87 | ||||
| 2025-08-11 | 13F | Rothschild Investment Llc | 1 169 | 0,00 | 16 | 0,00 | ||||
| 2025-08-08 | 13F | Capital Investment Counsel, Inc | 0 | −100,00 | 0 | |||||
| 2025-05-15 | 13F | Two Sigma Securities, Llc | 0 | −100,00 | 0 | −100,00 | ||||
| 2025-08-01 | 13F | Brinker Capital Investments, LLC | 0 | −100,00 | 0 | −100,00 | ||||
| 2025-08-18 | 13F/A | National Bank Of Canada /fi/ | 7 873 | 0,00 | 111 | −0,89 | ||||
| 2025-07-22 | 13F | Appleton Partners Inc/ma | 0 | −100,00 | 0 | |||||
| 2025-08-05 | 13F | Lord & Richards Wealth Management, LLC | 83 216 | 127,49 | 1 174 | 124,90 | ||||
| 2025-05-14 | 13F | Orion Portfolio Solutions, LLC | 185 065 | 0,00 | 2 134 | 0,00 | ||||
| 2025-07-21 | 13F | Empirical Financial Services, LLC d.b.a. Empirical Wealth Management | 0 | −100,00 | 0 | |||||
| 2025-07-31 | 13F | Cambridge Investment Research Advisors, Inc. | 83 919 | −6,19 | 1 | 0,00 | ||||
| 2025-07-10 | 13F | HF Advisory Group, LLC | 21 079 | 4,66 | 297 | 3,48 | ||||
| 2025-08-06 | 13F | Nvwm, Llc | 2 431 | 34 | ||||||
| 2025-05-14 | 13F | Van Hulzen Asset Management, LLC | 0 | −100,00 | 0 | −100,00 | ||||
| 2025-07-07 | 13F | Investors Research Corp | 275 264 | 11,99 | 3 884 | 10,66 | ||||
| 2025-08-19 | 13F | Cim, Llc | 29 181 | 0,00 | 412 | −1,20 | ||||
| 2025-07-29 | 13F | International Assets Investment Management, Llc | 77 042 | 9,38 | 1 087 | 8,16 | ||||
| 2025-08-12 | 13F | AlphaCore Capital LLC | 500 | 0,00 | 7 | 0,00 | ||||
| 2025-07-25 | 13F | Cwm, Llc | 276 | −72,97 | 0 | |||||
| 2025-04-03 | 13F | Central Pacific Bank - Trust Division | 0 | −100,00 | 0 | |||||
| 2025-05-12 | 13F | Founders Financial Alliance, LLC | 0 | −100,00 | 0 | |||||
| 2025-07-14 | 13F | Sowell Financial Services LLC | 49 229 | 0,10 | 695 | −1,14 | ||||
| 2025-07-25 | 13F | Concord Wealth Partners | 695 | 1,61 | 10 | 0,00 | ||||
| 2025-07-17 | 13F | Sterneck Capital Management, LLC | 120 520 | −0,18 | 1 701 | −1,39 | ||||
| 2025-08-14 | 13F | MGB Wealth Management, LLC | 27 764 | 0,00 | 392 | −1,26 | ||||
| 2025-07-22 | 13F | Kessler Investment Group, LLC | 1 508 | 0,00 | 21 | 0,00 | ||||
| 2025-08-14 | 13F | Wells Fargo & Company/mn | 820 396 | −0,28 | 11 576 | −1,47 | ||||
| 2025-08-04 | 13F | Integrity Alliance, Llc. | 14 638 | 4,33 | 207 | 3,00 | ||||
| 2025-08-06 | 13F | Commonwealth Equity Services, Llc | 92 725 | 1,35 | 1 | 0,00 | ||||
| 2025-08-14 | 13F | GWM Advisors LLC | 26 979 | 26,04 | 381 | 24,59 | ||||
| 2025-07-18 | 13F | Institute for Wealth Management, LLC. | 18 847 | −1,84 | 266 | −3,28 | ||||
| 2025-08-19 | 13F | Anchor Investment Management, LLC | 4 000 | 0,00 | 56 | −1,75 | ||||
| 2025-08-25 | 13F/A | Promus Capital, LLC | 2 117 | 0,00 | 30 | −3,33 | ||||
| 2025-08-04 | 13F | Premier Path Wealth Partners, LLC | 10 245 | 0,00 | 145 | −1,37 | ||||
| 2025-07-30 | 13F | Bogart Wealth, LLC | 1 060 | 0,00 | 15 | −6,67 | ||||
| 2025-07-31 | 13F | Richards, Merrill & Peterson, Inc. | 1 942 | 0,00 | 27 | 0,00 | ||||
| 2025-08-14 | 13F | Guardian Wealth Advisors, Llc / Nc | 2 881 | 9,92 | 41 | 8,11 | ||||
| 2025-08-14 | 13F | Ameriprise Financial Inc | 67 225 | 27,54 | 949 | 26,06 | ||||
| 2025-07-24 | 13F | Costello Asset Management, INC | 252 | 1,61 | 4 | 0,00 | ||||
| 2025-08-05 | 13F | Bank Of Montreal /can/ | 22 259 | −9,51 | 314 | −10,54 | ||||
| 2025-08-15 | 13F | Morgan Stanley | 1 707 295 | −7,94 | 24 090 | −9,04 | ||||
| 2025-07-16 | 13F | Leading Edge Financial Planning LLC | 14 572 | −13,24 | 206 | −14,23 | ||||
| 2025-07-07 | 13F | Thurston, Springer, Miller, Herd & Titak, Inc. | 325 | 0,00 | 5 | 0,00 | ||||
| 2025-07-29 | 13F | Ballast, Inc. | 20 276 | 286 | ||||||
| 2025-07-30 | 13F | D.a. Davidson & Co. | 76 101 | −1,97 | 1 074 | −3,16 | ||||
| 2025-05-15 | 13F | Creative Planning | 0 | −100,00 | 0 | |||||
| 2025-08-14 | 13F | Citadel Advisors Llc | Call | 21 100 | 298 | |||||
| 2025-05-12 | 13F | Independent Advisor Alliance | 0 | −100,00 | 0 | |||||
| 2025-08-07 | 13F | Palouse Capital Management, Inc. | 2 588 | 0,00 | 37 | 0,00 | ||||
| 2025-08-07 | 13F | Allworth Financial LP | 275 | 0,00 | 4 | 0,00 | ||||
| 2025-07-16 | 13F | Signaturefd, Llc | 0 | −100,00 | 0 | |||||
| 2025-07-31 | 13F | Oppenheimer & Co Inc | 22 860 | 0,43 | 323 | −0,92 | ||||
| 2025-08-04 | 13F | Joseph P. Lucia & Associates, LLC | 20 276 | 1,08 | 286 | 0,00 | ||||
| 2025-07-14 | 13F | GAMMA Investing LLC | 2 180 | 0,00 | 31 | −3,23 | ||||
| 2025-08-08 | 13F | ProVise Management Group, LLC | 25 042 | 0,00 | 353 | −1,12 | ||||
| 2025-08-14 | 13F | Royal Bank Of Canada | 159 796 | 13,67 | 2 254 | 12,20 | ||||
| 2025-08-15 | 13F | Captrust Financial Advisors | 54 914 | −0,60 | 775 | −1,78 | ||||
| 2025-08-13 | 13F | Alerus Financial Na | 1 000 | 14 | ||||||
| 2025-08-13 | 13F | Fort Sheridan Advisors Llc | 11 800 | −17,48 | 166 | −18,63 | ||||
| 2025-08-14 | 13F | Fmr Llc | 160 | 56,86 | 2 | 100,00 | ||||
| 2025-08-15 | 13F | Tower Research Capital LLC (TRC) | 65 | 1 | ||||||
| 2025-08-07 | 13F | Kestra Private Wealth Services, Llc | 15 585 | 0,00 | 220 | −1,35 | ||||
| 2025-05-15 | 13F | CAPROCK Group, Inc. | 26 218 | 0,00 | 374 | −1,84 | ||||
| 2025-08-12 | 13F | LPL Financial LLC | 975 225 | −21,47 | 13 760 | −22,40 | ||||
| 2025-07-30 | 13F | Eqis Capital Management, Inc. | 65 640 | −1,85 | 926 | −2,94 | ||||
| 2025-08-05 | 13F | Simplex Trading, Llc | 633 | 90,09 | 0 | |||||
| 2025-07-10 | 13F | Rfg Holdings, Inc. | 61 231 | −33,59 | 864 | −34,42 | ||||
| 2025-07-14 | 13F | Pacifica Partners Inc. | 447 | 0,00 | 6 | 0,00 | ||||
| 2025-08-08 | 13F | Citizens Financial Group Inc/ri | 17 950 | −14,94 | 253 | −15,95 | ||||
| 2025-07-17 | 13F | Park Place Capital Corp | 1 120 | 0,00 | 16 | 0,00 | ||||
| 2025-07-28 | 13F | Harbour Investments, Inc. | 2 415 | 0,00 | 34 | 0,00 | ||||
| 2025-05-23 | 13F | Twin Lakes Capital Management, LLC | 0 | −100,00 | 0 | |||||
| 2025-08-12 | 13F | MAI Capital Management | 21 962 | −4,71 | 310 | −6,08 | ||||
| 2025-08-14 | 13F | Ancora Advisors, LLC | 20 000 | 100,00 | 282 | 98,59 | ||||
| 2025-07-16 | 13F | Register Financial Advisors LLC | 2 104 | 1,54 | 30 | 0,00 | ||||
| 2025-07-17 | 13F | Walker Asset Management, LLC | 40 170 | −2,64 | 567 | −3,90 | ||||
| 2025-07-24 | 13F | Us Bancorp \de\ | 2 250 | 0,00 | 32 | −3,12 | ||||
| 2025-07-28 | 13F | Essex LLC | 20 200 | 0,00 | 285 | −1,04 | ||||
| 2025-08-08 | 13F | Symphony Financial Services, Inc. | 11 896 | −17,43 | 168 | −18,54 | ||||
| 2025-05-06 | 13F | Avantax Advisory Services, Inc. | 0 | −100,00 | 0 | |||||
| 2025-07-31 | 13F | LJI Wealth Management, LLC | 40 371 | −5,50 | 570 | −6,72 | ||||
| 2025-08-19 | 13F | National Asset Management, Inc. | 22 350 | 315 | ||||||
| 2025-07-17 | 13F/A | Capital Investment Advisors, LLC | 28 894 | −4,24 | 408 | −5,35 | ||||
| 2025-07-10 | 13F | Rockland Trust Co | 0 | −100,00 | 0 | |||||
| 2025-07-17 | 13F | Janney Montgomery Scott LLC | 28 333 | −0,74 | 0 | |||||
| 2025-07-17 | 13F | Western Financial Corp/CA | 21 960 | −0,00 | 310 | −1,28 | ||||
| 2025-08-05 | 13F | Huntington National Bank | 1 | 0,00 | 0 | |||||
| 2025-04-17 | 13F | Monticello Wealth Management, Llc | 0 | −100,00 | 0 | |||||
| 2025-08-14 | 13F | Mml Investors Services, Llc | 61 724 | −18,82 | 1 | −100,00 | ||||
| 2025-08-14 | 13F | Stifel Financial Corp | 148 560 | 0,07 | 2 096 | −1,09 | ||||
| 2025-07-09 | 13F | Fiduciary Alliance LLC | 13 267 | −37,32 | 187 | −38,08 | ||||
| 2025-07-16 | 13F | Magnus Financial Group LLC | 82 509 | 1,55 | 1 164 | 0,34 | ||||
| 2025-08-11 | 13F | SFI Advisors, LLC | 0 | −100,00 | 0 | |||||
| 2025-08-14 | 13F | Raymond James Financial Inc | 123 594 | −20,35 | 1 744 | −21,31 | ||||
| 2025-05-08 | 13F | We Are One Seven, LLC | 0 | −100,00 | 0 |