Grunnleggende statistikk
| Institusjonelle eiere | 97 total, 97 long only, 0 short only, 0 long/short - change of 10,23% MRQ |
| Gjennomsnittlig porteføljeallokering | 0.2282 % - change of 7,35% MRQ |
| Institusjonelle aksjer (Long) | 3 327 123 (ex 13D/G) - change of 1,00MM shares 43,13% MRQ |
| Institusjonell verdi (Long) | $ 150 037 USD ($1000) |
Institusjonelt eierskap og aksjonærer
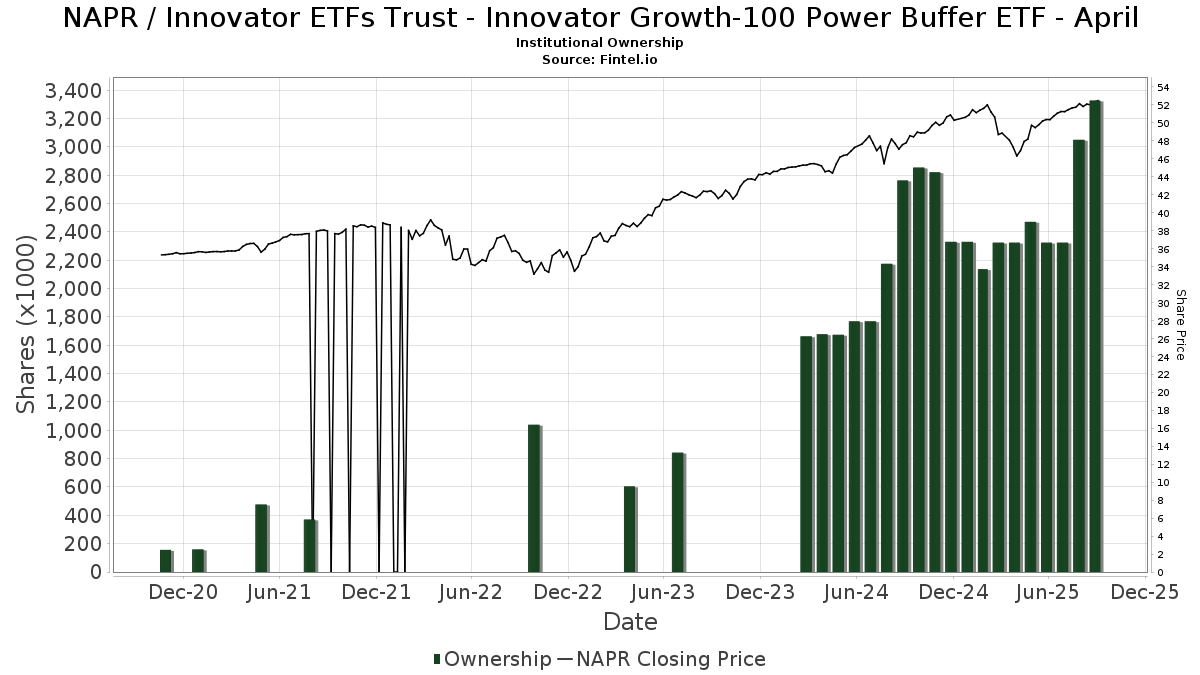
Innovator ETFs Trust - Innovator Growth-100 Power Buffer ETF - April (US:NAPR) har 97 institusjonelle eiere og aksjonærer som har sendt inn 13D/G- eller 13F-skjemaer til Securities Exchange Commission (SEC). Disse institusjonene eier til sammen 3,327,123 aksjer. De største aksjonærene inkluderer Gradient Investments LLC, Advisor Group Holdings, Inc., Allworth Financial LP, FOCUS Wealth Advisors, LLC, Red Crane Wealth Management, Llc, Commonwealth Equity Services, Llc, MAI Capital Management, Kestra Advisory Services, LLC, Janney Montgomery Scott LLC, and Tradition Wealth Management, LLC .
Innovator ETFs Trust - Innovator Growth-100 Power Buffer ETF - April (BATS:NAPR) institusjonell eierstruktur viser nåværende posisjoner i selskapet fordelt på institusjoner og fond, samt de siste endringene i posisjonsstørrelse. De største aksjonærene kan være individuelle investorer, verdipapirfond, hedgefond eller institusjoner. Schedule 13D indikerer at investoren eier (eller har eid) mer enn 5 % av selskapet og har til hensikt (eller hadde til hensikt) å aktivt forfølge en endring i forretningsstrategien. Schedule 13G indikerer en passiv investering på over 5 %.
The share price as of September 9, 2025 is 52,26 / share. Previously, on September 10, 2024, the share price was 47,00 / share. This represents an increase of 11,19% over that period.
Fondssentiment-score
Fondssentiment Score (også kjent som akkumulering av eierskap poengsum) viser hvilke aksjer som er mest kjøpt av fond. Den er resultatet av en sofistikert, kvantitativ flerfaktormodell som identifiserer selskaper med de høyeste nivåene av institusjonell akkumulering. Beregningsmodellen for poeng bruker en kombinasjon av den totale økningen i antall offentliggjorte eiere, endringer i porteføljeallokeringen til disse eierne og andre beregninger. Tallet går fra 0 til 100, der høyere tall indikerer en høyere grad av akkumulering i forhold til sammenlignbare selskaper, der 50 er gjennomsnittet.
Oppdateringsfrekvens: Daglig
Sjekk ut Ownership Explorer, som inneholder en liste over de høyest rangerte selskapene.
Institusjonell Put/Call-forhold
I tillegg til å rapportere standard aksje- og gjeldsemisjoner må institusjoner med mer enn 100 millioner kroner i forvaltningskapital også oppgi beholdningen av put- og callopsjoner. Siden put-opsjoner generelt indikerer et negativt sentiment, og call-opsjoner indikerer et positivt sentiment, kan vi få et inntrykk av det generelle institusjonelle sentimentet ved å plotte forholdet mellom put- og call-opsjoner. Diagrammet til høyre viser det historiske forholdet mellom put- og call-opsjoner for dette instrumentet.
Ved å bruke Put/Call-forholdet som en indikator på investorsentimentet kan man overvinne en av de viktigste svakhetene ved å bruke totalt institusjonelt eierskap, nemlig at en betydelig andel av forvaltningskapitalen investeres passivt for å følge indekser. Passivt forvaltede fond kjøper vanligvis ikke opsjoner, slik at indikatoren for put/call-forhold i større grad gjenspeiler stemningen i aktivt forvaltede fond.
13F- og NPORT-arkiveringer
Detaljer om 13F-arkiveringer er gratis. Detaljer om NP-arkiveringer krever et premium-medlemskap. Grønne rader indikerer nye posisjoner. Røde rader indikerer lukkede posisjoner. Klikk på lenke ikonet for å se hele transaksjonshistorikken.
Oppgrader
for å låse opp premiedata og eksportere til Excel. ![]() .
.
| Fildato | Kilde | Investor | Type | Gjennomsnittlig pris (estimert) |
Aksjer | Δ Aksjer (%) |
Rapportert verdi ($1000) | Verdi (%) | Portallokering (%) | |
|---|---|---|---|---|---|---|---|---|---|---|
| 2025-07-22 | 13F | Merit Financial Group, LLC | 9 516 | 485 | ||||||
| 2025-08-28 | NP | TFAQX - TFA Quantitative Fund Class I | 8 500 | 0,00 | 434 | 6,91 | ||||
| 2025-09-04 | 13F/A | Advisor Group Holdings, Inc. | 248 994 | 79,45 | 12 701 | 91,92 | ||||
| 2025-07-25 | 13F | Apollon Wealth Management, LLC | 13 352 | 2,71 | 681 | 9,84 | ||||
| 2025-07-28 | 13F | Harbour Investments, Inc. | 3 999 | 3,79 | 204 | 10,93 | ||||
| 2025-07-21 | 13F | Seros Financial, LLC | 4 463 | −3,54 | 228 | 3,18 | ||||
| 2025-07-30 | 13F | Brookstone Capital Management | 6 189 | −8,18 | 316 | −1,87 | ||||
| 2025-07-08 | 13F | Gradient Investments LLC | 655 603 | 33 442 | ||||||
| 2025-08-14 | 13F | Colony Group, LLC | 5 847 | 298 | ||||||
| 2025-07-30 | 13F | Mid-American Wealth Advisory Group, Inc. | 4 | 0 | ||||||
| 2025-08-15 | 13F | Optimist Retirement Group LLC | 12 280 | 17,22 | 626 | 25,45 | ||||
| 2025-08-14 | 13F | Old Mission Capital Llc | 14 976 | −62,29 | 764 | −59,71 | ||||
| 2025-08-18 | 13F | Wolverine Trading, Llc | 0 | −100,00 | 0 | |||||
| 2025-08-13 | 13F | Maia Wealth LLC | 10 273 | −42,17 | 524 | −37,17 | ||||
| 2025-04-22 | 13F | Synergy Financial Management, LLC | 0 | −100,00 | 0 | |||||
| 2025-08-08 | 13F | Collaborative Wealth Managment Inc. | 8 319 | 56,64 | 424 | 67,59 | ||||
| 2025-07-22 | 13F | Red Tortoise LLC | 793 | 0,00 | 40 | 8,11 | ||||
| 2025-08-07 | 13F | Resources Investment Advisors, LLC. | 4 404 | 225 | ||||||
| 2025-08-04 | 13F | Prairie Wealth Advisors, Inc. | 20 130 | 0,00 | 1 027 | 6,88 | ||||
| 2025-07-25 | 13F | Atria Wealth Solutions, Inc. | 13 368 | 42,21 | 682 | 52,23 | ||||
| 2025-07-29 | 13F | Mattson Financial Services, LLC | 6 214 | 317 | ||||||
| 2025-08-12 | 13F | LPL Financial LLC | 35 154 | 8,85 | 1 793 | 16,43 | ||||
| 2025-07-09 | 13F | FOCUS Wealth Advisors, LLC | 222 136 | 0,26 | 11 331 | 7,22 | ||||
| 2025-08-06 | 13F | Commonwealth Equity Services, Llc | 132 696 | 10,04 | 7 | 20,00 | ||||
| 2025-08-12 | 13F | Steward Partners Investment Advisory, Llc | 6 142 | 0,00 | 313 | 7,19 | ||||
| 2025-08-04 | 13F | Arkadios Wealth Advisors | 17 300 | −2,78 | 882 | 4,01 | ||||
| 2025-08-11 | 13F | HighTower Advisors, LLC | 12 263 | 21,15 | 626 | 29,67 | ||||
| 2025-08-14 | 13F | Jane Street Group, Llc | 7 450 | 380 | ||||||
| 2025-08-12 | 13F | Proequities, Inc. | 0 | 0 | ||||||
| 2025-07-14 | 13F | AdvisorNet Financial, Inc | 23 370 | −1,10 | 1 192 | 5,77 | ||||
| 2025-07-15 | 13F | BCS Wealth Management | 21 170 | −3,75 | 1 | 0,00 | ||||
| 2025-08-11 | 13F | Outlook Wealth Advisors, LLC | 49 200 | −1,41 | 2 510 | 5,42 | ||||
| 2025-08-14 | 13F | CoreCap Advisors, LLC | 6 859 | 7,22 | 350 | 14,43 | ||||
| 2025-08-05 | 13F | Sigma Planning Corp | 4 459 | 0,09 | 227 | 7,08 | ||||
| 2025-07-16 | 13F | Signaturefd, Llc | 1 933 | 0,00 | 99 | 6,52 | ||||
| 2025-07-29 | 13F | AssuredPartners Investment Advisors, LLC | 10 092 | −79,43 | 515 | −78,03 | ||||
| 2025-08-12 | 13F | Jacobi Capital Management LLC | 6 969 | 0,00 | 355 | 6,93 | ||||
| 2025-08-04 | 13F | Creative Financial Designs Inc /adv | 14 570 | 22,75 | 743 | 31,27 | ||||
| 2025-08-12 | 13F | MAI Capital Management | 123 032 | 659,46 | 6 276 | 712,82 | ||||
| 2025-08-07 | 13F | PFG Advisors | 8 063 | −2,25 | 411 | 4,58 | ||||
| 2025-08-06 | 13F | Valtinson Bruner Financial Planning LLC | 10 637 | −13,73 | 543 | −7,82 | ||||
| 2025-05-15 | 13F | Talon Private Wealth, LLC | 0 | −100,00 | 0 | −100,00 | ||||
| 2025-07-16 | 13F | Cambridge Advisors Inc. | 31 824 | 0,00 | 1 623 | 6,92 | ||||
| 2025-08-08 | 13F | Avantax Advisory Services, Inc. | 7 248 | 44,96 | 370 | 55,04 | ||||
| 2025-07-25 | 13F | Concurrent Investment Advisors, LLC | 8 921 | 0,00 | 455 | 7,06 | ||||
| 2025-05-06 | 13F | Arlington Capital Management, Inc. | 0 | −100,00 | 0 | |||||
| 2025-08-08 | 13F | Cetera Investment Advisers | 83 790 | 30,38 | 4 274 | 39,45 | ||||
| 2025-08-11 | 13F | Atlantic Private Wealth, LLC | 0 | −100,00 | 0 | |||||
| 2025-07-30 | 13F | Strategic Blueprint, LLC | 51 339 | 2,70 | 2 619 | 9,82 | ||||
| 2025-08-14 | 13F | UBS Group AG | 0 | −100,00 | 0 | |||||
| 2025-07-09 | 13F | Keystone Wealth Services, LLC | 26 819 | 197,36 | 1 368 | 218,14 | ||||
| 2025-08-01 | 13F | Envestnet Asset Management Inc | 15 951 | 19,21 | 814 | 27,43 | ||||
| 2025-08-14 | 13F | Mml Investors Services, Llc | 7 339 | 0 | ||||||
| 2025-07-21 | 13F | DHJJ Financial Advisors, Ltd. | 14 894 | 21,16 | 760 | 29,52 | ||||
| 2025-08-12 | 13F | Coldstream Capital Management Inc | 0 | −100,00 | 0 | |||||
| 2025-07-30 | 13F | Red Crane Wealth Management, Llc | 133 470 | 25,13 | 6 808 | 33,83 | ||||
| 2025-08-15 | 13F | Brown Financial Advisors | 7 441 | 380 | ||||||
| 2025-08-14 | 13F | Susquehanna International Group, Llp | 10 450 | 533 | ||||||
| 2025-05-14 | 13F | Luminist Capital LLC | 0 | −100,00 | 0 | |||||
| 2025-08-12 | 13F | Jpmorgan Chase & Co | 0 | −100,00 | 0 | |||||
| 2025-07-24 | 13F | IFP Advisors, Inc | 13 356 | 36,12 | 681 | 45,51 | ||||
| 2025-04-29 | 13F | Capital Investment Advisory Services, LLC | 0 | −100,00 | 0 | |||||
| 2025-08-15 | 13F | Kestra Advisory Services, LLC | 105 106 | 105,18 | 5 361 | 119,44 | ||||
| 2025-08-29 | 13F | Evolution Wealth Management Inc. | 1 441 | 74 | ||||||
| 2025-07-17 | 13F | Janney Montgomery Scott LLC | 101 923 | 12,11 | 5 | 25,00 | ||||
| 2025-07-18 | 13F | Truist Financial Corp | 40 165 | 15,69 | 2 049 | 23,67 | ||||
| 2025-05-07 | 13F | Foundations Investment Advisors, LLC | 0 | −100,00 | 0 | −100,00 | ||||
| 2025-05-12 | 13F | Fmr Llc | 0 | −100,00 | 0 | |||||
| 2025-08-14 | 13F | Citadel Advisors Llc | 0 | −100,00 | 0 | |||||
| 2025-08-28 | NP | TFAFX - Tactical Growth Allocation Fund Class I | 4 200 | 10,53 | 214 | 18,23 | ||||
| 2025-08-06 | 13F | Wedbush Securities Inc | 5 771 | 0 | ||||||
| 2025-05-05 | 13F | Arq Wealth Advisors, Llc | 0 | −100,00 | 0 | |||||
| 2025-07-22 | 13F | Diligent Investors, LLC | 21 417 | −7,21 | 1 092 | −0,73 | ||||
| 2025-07-10 | 13F | Wealth Enhancement Advisory Services, Llc | 4 197 | −28,20 | 215 | −23,02 | ||||
| 2025-07-25 | 13F | Cwm, Llc | 22 987 | 2,09 | 1 | 0,00 | ||||
| 2025-08-14 | 13F | Visionary Wealth Advisors | 9 104 | 47,19 | 464 | 57,29 | ||||
| 2025-08-15 | 13F | Morgan Stanley | 1 322 | 3 124,39 | 67 | 6 600,00 | ||||
| 2025-08-04 | 13F | Daymark Wealth Partners, Llc | 4 889 | 0,00 | 249 | 6,87 | ||||
| 2025-08-04 | 13F | Assetmark, Inc | 0 | −100,00 | 0 | |||||
| 2025-08-08 | 13F | Compass Financial Services Inc | 125 | 0,00 | 6 | 20,00 | ||||
| 2025-08-06 | 13F | Soltis Investment Advisors LLC | 4 153 | 212 | ||||||
| 2025-08-29 | 13F | Centaurus Financial, Inc. | 5 394 | −63,92 | 0 | |||||
| 2025-07-25 | 13F | Sequoia Financial Advisors, LLC | 9 109 | 0,00 | 465 | 6,91 | ||||
| 2025-08-13 | 13F | JT Stratford LLC | 8 190 | 0,00 | 418 | 6,92 | ||||
| 2025-07-10 | 13F | Focus Financial Network, Inc. | 9 140 | 6,89 | 466 | 14,50 | ||||
| 2025-07-08 | 13F | Paladin Wealth, LLC | 6 057 | 309 | ||||||
| 2025-08-06 | 13F | AE Wealth Management LLC | 6 287 | 2,75 | 321 | 9,97 | ||||
| 2025-08-14 | 13F | Wells Fargo & Company/mn | 0 | −100,00 | 0 | |||||
| 2025-05-06 | 13F | Triumph Capital Management | 0 | −100,00 | 0 | |||||
| 2025-08-01 | 13F | Corrado Advisors, Llc | 26 049 | 1 329 | ||||||
| 2025-08-14 | 13F | GWM Advisors LLC | 11 038 | 0,00 | 563 | 7,03 | ||||
| 2025-08-07 | 13F | Allworth Financial LP | 227 581 | 7,96 | 11 609 | 15,96 | ||||
| 2025-07-14 | 13F | U.S. Capital Wealth Advisors, LLC | 4 414 | 4,85 | 225 | 12,50 | ||||
| 2025-07-22 | 13F | Beacon Financial Advisory LLC | 9 660 | 493 | ||||||
| 2025-07-24 | 13F | Blair William & Co/il | 36 140 | −20,71 | 1 844 | −15,23 | ||||
| 2025-08-13 | 13F | BCJ Capital Management, LLC | 4 479 | −1,10 | 228 | 5,56 | ||||
| 2025-08-01 | 13F | FSA Advisors, Inc. | 15 379 | 12,35 | 784 | 6,81 | ||||
| 2025-08-12 | 13F | Change Path, LLC | 30 801 | 1,88 | 1 571 | 8,95 | ||||
| 2025-05-07 | 13F | First Heartland Consultants, Inc. | 0 | −100,00 | 0 | −100,00 | ||||
| 2025-08-11 | 13F | Blue Bell Private Wealth Management, Llc | 209 | 0,00 | 11 | 11,11 | ||||
| 2025-08-14 | 13F | Certified Advisory Corp | 7 149 | 365 | ||||||
| 2025-08-13 | 13F | M Holdings Securities, Inc. | 21 074 | 0,00 | 1 | 0,00 | ||||
| 2025-08-14 | 13F | Raymond James Financial Inc | 46 912 | 8,10 | 2 393 | 15,61 | ||||
| 2025-08-15 | 13F | Nikulski Financial, Inc. | 5 100 | 0,00 | 260 | 7,00 | ||||
| 2025-08-14 | 13F | Acas, Llc | 9 045 | 66,12 | 471 | 79,77 | ||||
| 2025-07-29 | 13F | Stratos Wealth Advisors, LLC | 8 764 | 0,00 | 447 | 6,94 | ||||
| 2025-08-14 | 13F | Sunbelt Securities, Inc. | 7 673 | 3,37 | 387 | 9,04 | ||||
| 2025-07-31 | 13F | Cambridge Investment Research Advisors, Inc. | 61 620 | −2,75 | 3 | 0,00 | ||||
| 2025-08-01 | 13F | Gwn Securities Inc. | 27 866 | 23,24 | 1 421 | 31,82 | ||||
| 2025-08-19 | 13F | National Asset Management, Inc. | 0 | −100,00 | 0 | |||||
| 2025-07-24 | 13F | Stonebridge Financial Group, LLC | 0 | −100,00 | 0 | |||||
| 2025-07-30 | 13F | Phoenix Holdings Ltd. | 17 495 | 887 | ||||||
| 2025-08-11 | 13F | Principal Securities, Inc. | 73 792 | −29,80 | 3 764 | −28,94 | ||||
| 2025-08-14 | 13F | Hrt Financial Lp | 5 483 | 0 | ||||||
| 2025-04-18 | 13F | Global Trust Asset Management, LLC | 0 | −100,00 | 0 | |||||
| 2025-08-14 | 13F | Goldman Sachs Group Inc | 0 | −100,00 | 0 | |||||
| 2025-08-12 | 13F | Tradition Wealth Management, LLC | 99 949 | 2,47 | 5 098 | 9,59 | ||||
| 2025-07-14 | 13F | CRA Financial Services, LLC | 10 919 | −10,35 | 557 | −4,14 | ||||
| 2025-07-16 | 13F | PFS Partners, LLC | 759 | 39 | ||||||
| 2025-08-19 | 13F | Advisory Services Network, LLC | 13 235 | 3,12 | 683 | 11,44 |