Grunnleggende statistikk
| Institusjonelle eiere | 103 total, 103 long only, 0 short only, 0 long/short - change of 15,22% MRQ |
| Gjennomsnittlig porteføljeallokering | 0.2718 % - change of −14,62% MRQ |
| Institusjonelle aksjer (Long) | 5 325 273 (ex 13D/G) - change of 0,96MM shares 22,06% MRQ |
| Institusjonell verdi (Long) | $ 198 720 USD ($1000) |
Institusjonelt eierskap og aksjonærer
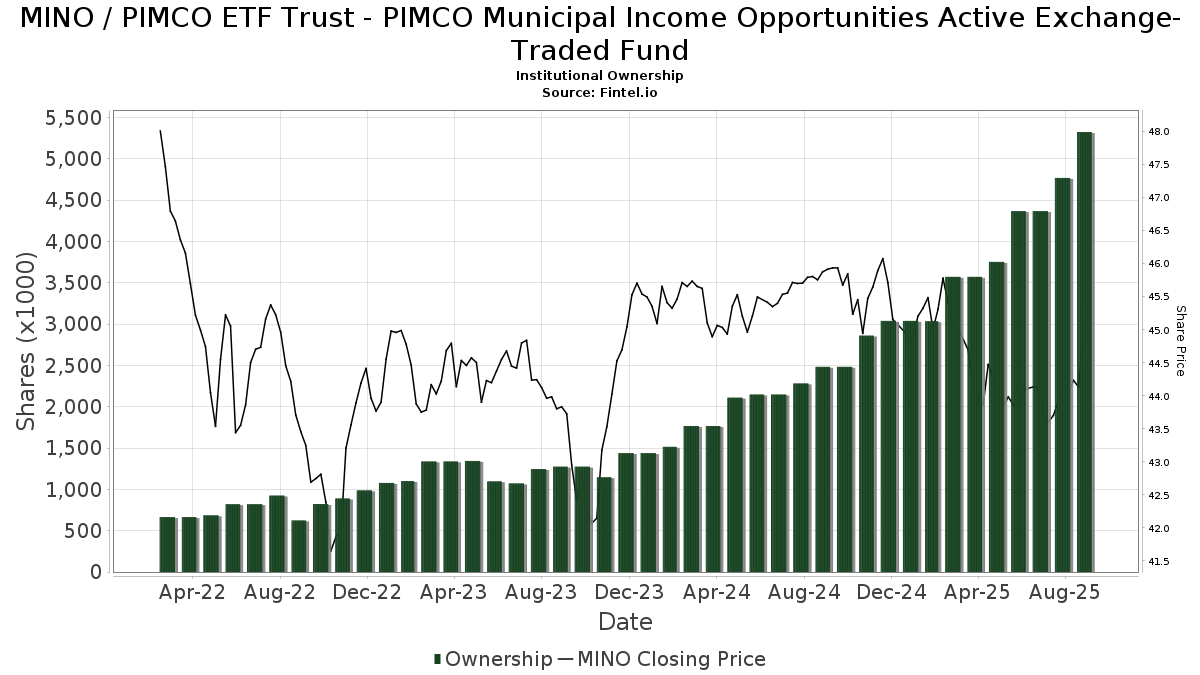
PIMCO ETF Trust - PIMCO Municipal Income Opportunities Active Exchange-Traded Fund (US:MINO) har 103 institusjonelle eiere og aksjonærer som har sendt inn 13D/G- eller 13F-skjemaer til Securities Exchange Commission (SEC). Disse institusjonene eier til sammen 5,325,273 aksjer. De største aksjonærene inkluderer Cwm, Llc, Great Valley Advisor Group, Inc., LPL Financial LLC, Waterway Wealth Management, LLC, Kovitz Investment Group Partners, LLC, Truist Financial Corp, Envestnet Asset Management Inc, Advisor Group Holdings, Inc., GWM Advisors LLC, and Cary Street Partners Financial Llc .
PIMCO ETF Trust - PIMCO Municipal Income Opportunities Active Exchange-Traded Fund (ARCA:MINO) institusjonell eierstruktur viser nåværende posisjoner i selskapet fordelt på institusjoner og fond, samt de siste endringene i posisjonsstørrelse. De største aksjonærene kan være individuelle investorer, verdipapirfond, hedgefond eller institusjoner. Schedule 13D indikerer at investoren eier (eller har eid) mer enn 5 % av selskapet og har til hensikt (eller hadde til hensikt) å aktivt forfølge en endring i forretningsstrategien. Schedule 13G indikerer en passiv investering på over 5 %.
The share price as of September 12, 2025 is 45,15 / share. Previously, on September 16, 2024, the share price was 46,00 / share. This represents a decline of 1,85% over that period.
Fondssentiment-score
Fondssentiment Score (også kjent som akkumulering av eierskap poengsum) viser hvilke aksjer som er mest kjøpt av fond. Den er resultatet av en sofistikert, kvantitativ flerfaktormodell som identifiserer selskaper med de høyeste nivåene av institusjonell akkumulering. Beregningsmodellen for poeng bruker en kombinasjon av den totale økningen i antall offentliggjorte eiere, endringer i porteføljeallokeringen til disse eierne og andre beregninger. Tallet går fra 0 til 100, der høyere tall indikerer en høyere grad av akkumulering i forhold til sammenlignbare selskaper, der 50 er gjennomsnittet.
Oppdateringsfrekvens: Daglig
Sjekk ut Ownership Explorer, som inneholder en liste over de høyest rangerte selskapene.
Institusjonell Put/Call-forhold
I tillegg til å rapportere standard aksje- og gjeldsemisjoner må institusjoner med mer enn 100 millioner kroner i forvaltningskapital også oppgi beholdningen av put- og callopsjoner. Siden put-opsjoner generelt indikerer et negativt sentiment, og call-opsjoner indikerer et positivt sentiment, kan vi få et inntrykk av det generelle institusjonelle sentimentet ved å plotte forholdet mellom put- og call-opsjoner. Diagrammet til høyre viser det historiske forholdet mellom put- og call-opsjoner for dette instrumentet.
Ved å bruke Put/Call-forholdet som en indikator på investorsentimentet kan man overvinne en av de viktigste svakhetene ved å bruke totalt institusjonelt eierskap, nemlig at en betydelig andel av forvaltningskapitalen investeres passivt for å følge indekser. Passivt forvaltede fond kjøper vanligvis ikke opsjoner, slik at indikatoren for put/call-forhold i større grad gjenspeiler stemningen i aktivt forvaltede fond.
13F- og NPORT-arkiveringer
Detaljer om 13F-arkiveringer er gratis. Detaljer om NP-arkiveringer krever et premium-medlemskap. Grønne rader indikerer nye posisjoner. Røde rader indikerer lukkede posisjoner. Klikk på lenke ikonet for å se hele transaksjonshistorikken.
Oppgrader
for å låse opp premiedata og eksportere til Excel. ![]() .
.
| Fildato | Kilde | Investor | Type | Gjennomsnittlig pris (estimert) |
Aksjer | Δ Aksjer (%) |
Rapportert verdi ($1000) | Verdi (%) | Portallokering (%) | |
|---|---|---|---|---|---|---|---|---|---|---|
| 2025-08-19 | 13F | Cape Investment Advisory, Inc. | 300 | 0,00 | 13 | 0,00 | ||||
| 2025-08-14 | 13F | Clarity Asset Management, Inc. | 88 807 | −41,29 | 3 928 | −41,96 | ||||
| 2025-07-28 | 13F | Allianz Asset Management GmbH | 439 | 5,53 | 19 | 5,56 | ||||
| 2025-05-15 | 13F/A | Orion Portfolio Solutions, LLC | 38 098 | −10,85 | 1 704 | −11,48 | ||||
| 2025-07-08 | 13F | Richard P Slaughter Associates Inc | 0 | −100,00 | 0 | |||||
| 2025-08-15 | 13F | Equitable Holdings, Inc. | 0 | −100,00 | 0 | |||||
| 2025-08-12 | 13F | Steward Partners Investment Advisory, Llc | 7 400 | 12 658,62 | 327 | 16 250,00 | ||||
| 2025-08-12 | 13F | Viawealth, Llc | 34 243 | 68,37 | 1 515 | 66,56 | ||||
| 2025-07-22 | 13F | DAVENPORT & Co LLC | 4 857 | 215 | ||||||
| 2025-07-28 | 13F | WealthPLAN Partners, LLC | 0 | −100,00 | 0 | |||||
| 2025-08-13 | 13F | Mayfair Advisory Group, LLC | 13 550 | 595 | ||||||
| 2025-07-16 | 13F | RWM Asset Management, LLC | 19 718 | −3,42 | 872 | −4,49 | ||||
| 2025-07-29 | 13F | Private Trust Co Na | 3 954 | 160,99 | 175 | 159,70 | ||||
| 2025-08-14 | 13F | Cove Street Capital, LLC | 11 427 | 505 | ||||||
| 2025-08-01 | 13F | Envestnet Asset Management Inc | 192 720 | 7,86 | 8 524 | 6,67 | ||||
| 2025-08-08 | 13F | Cetera Investment Advisers | 6 833 | 0,00 | 302 | −0,98 | ||||
| 2025-07-10 | 13F | Wealth Enhancement Advisory Services, Llc | 43 863 | 91,95 | 1 935 | 89,24 | ||||
| 2025-07-28 | 13F | WealthPlan Investment Management, LLC | 6 245 | 276 | ||||||
| 2025-08-14 | 13F | Great Valley Advisor Group, Inc. | 414 729 | 18 344 | ||||||
| 2025-08-14 | 13F | Mml Investors Services, Llc | 30 600 | 153,69 | 1 | |||||
| 2025-08-14 | 13F | Wiley Bros.-aintree Capital, Llc | 14 590 | 645 | ||||||
| 2025-07-31 | 13F | Cambridge Investment Research Advisors, Inc. | 85 456 | −16,89 | 4 | −25,00 | ||||
| 2025-08-05 | 13F | Dahring | Cusmano Llc | 11 543 | 6,92 | 511 | 5,81 | ||||
| 2025-08-14 | 13F | UBS Group AG | 0 | −100,00 | 0 | |||||
| 2025-07-25 | 13F | Landmark Wealth Management, LLC | 22 437 | 12,65 | 1 | |||||
| 2025-08-12 | 13F | Financial Advocates Investment Management | 17 606 | 779 | ||||||
| 2025-04-28 | 13F | Oregon Pacific Wealth Management, LLC | 0 | −100,00 | 0 | |||||
| 2025-07-24 | 13F | Blair William & Co/il | 1 860 | −25,30 | 82 | −26,13 | ||||
| 2025-08-13 | 13F | Capital Analysts, Inc. | 1 700 | 0 | ||||||
| 2025-08-08 | 13F | Tanglewood Legacy Advisors, LLC | 0 | −100,00 | 0 | |||||
| 2025-08-14 | 13F | Citadel Advisors Llc | 22 892 | 1 013 | ||||||
| 2025-08-14 | 13F | CoreCap Advisors, LLC | 873 | 39 | ||||||
| 2025-08-14 | 13F | Waterway Wealth Management, LLC | 374 393 | 34,06 | 16 560 | 32,56 | ||||
| 2025-08-14 | 13F | Warren Averett Asset Management, LLC | 13 992 | −2,37 | 619 | −3,59 | ||||
| 2025-07-24 | 13F | CarsonAllaria Wealth Management, Ltd. | 145 888 | 32,25 | 6 453 | 30,77 | ||||
| 2025-08-06 | 13F | Vestmark Advisory Solutions, Inc. | 25 014 | −48,19 | 1 106 | −48,77 | ||||
| 2025-08-11 | 13F | Principal Securities, Inc. | 1 207 | 30,35 | 53 | 29,27 | ||||
| 2025-07-22 | 13F | Beacon Financial Advisory LLC | 5 105 | 0,59 | 226 | −0,88 | ||||
| 2025-08-06 | 13F | Commonwealth Equity Services, Llc | 113 448 | 31,92 | 5 | 66,67 | ||||
| 2025-08-12 | 13F | LPL Financial LLC | 381 976 | 5,27 | 16 895 | 4,09 | ||||
| 2025-07-31 | 13F | Trademark Financial Management, LLC | 14 581 | −15,75 | 645 | −16,80 | ||||
| 2025-08-08 | 13F | Laurel Wealth Planning LLC | 38 589 | 0,30 | 1 707 | −0,81 | ||||
| 2025-07-25 | 13F | Cwm, Llc | 481 185 | 12,96 | 21 | 10,53 | ||||
| 2025-08-08 | 13F | Crossmark Global Holdings, Inc. | 9 964 | −3,37 | 441 | −4,56 | ||||
| 2025-08-08 | 13F | Capital Investment Advisory Services, LLC | 285 | 13 | ||||||
| 2025-08-14 | 13F | GWM Advisors LLC | 173 656 | 28,14 | 7 681 | 26,71 | ||||
| 2025-08-08 | 13F | Sittner & Nelson, Llc | 23 393 | 142,49 | 1 035 | 139,91 | ||||
| 2025-08-13 | 13F | Flow Traders U.s. Llc | 17 197 | −14,88 | 1 | |||||
| 2025-08-14 | 13F | Jane Street Group, Llc | 48 532 | −65,67 | 2 147 | −66,06 | ||||
| 2025-07-28 | 13F | Harbour Investments, Inc. | 2 244 | 0,00 | 99 | −1,00 | ||||
| 2025-08-05 | 13F | GPS Wealth Strategies Group, LLC | 6 543 | −19,29 | 289 | −20,17 | ||||
| 2025-08-14 | 13F | Visionary Wealth Advisors | 56 866 | 0,60 | 2 515 | −0,51 | ||||
| 2025-08-08 | 13F | Avantax Advisory Services, Inc. | 59 792 | −0,63 | 2 645 | −1,75 | ||||
| 2025-08-11 | 13F | Elequin Capital Lp | 12 483 | 552 | ||||||
| 2025-07-29 | 13F | Stratos Wealth Partners, LTD. | 12 750 | 564 | ||||||
| 2025-08-13 | 13F | StoneX Group Inc. | 22 710 | −50,75 | 1 004 | −51,31 | ||||
| 2025-08-27 | 13F/A | Brinker Capital Investments, LLC | 29 522 | −22,51 | 1 306 | −23,42 | ||||
| 2025-08-12 | 13F | Change Path, LLC | 32 881 | 37,85 | 1 454 | 36,40 | ||||
| 2025-07-25 | 13F | Envestnet Portfolio Solutions, Inc. | 6 825 | −11,80 | 302 | −13,01 | ||||
| 2025-08-08 | 13F | Hedeker Wealth, LLC | 34 998 | −4,54 | 1 548 | −5,61 | ||||
| 2025-07-15 | 13F | Avaii Wealth Management, Llc | 7 260 | 6,98 | 321 | 5,94 | ||||
| 2025-08-14 | 13F | Royal Bank Of Canada | 5 902 | −74,20 | 261 | −74,49 | ||||
| 2025-08-12 | 13F | Jpmorgan Chase & Co | 1 288 | −98,76 | 57 | −98,79 | ||||
| 2025-08-27 | 13F | Barnes Wealth Management Group, Inc | 11 399 | 27,43 | 504 | 26,00 | ||||
| 2025-08-14 | 13F | Wells Fargo & Company/mn | 0 | 0 | ||||||
| 2025-08-04 | 13F | Creative Financial Designs Inc /adv | 2 327 | 0,91 | 103 | −0,97 | ||||
| 2025-08-06 | 13F | SOUTH STATE Corp | 5 029 | −45,01 | 222 | −45,72 | ||||
| 2025-07-15 | 13F | BCS Wealth Management | 52 586 | −37,03 | 2 | −33,33 | ||||
| 2025-08-13 | 13F | GeoWealth Management, LLC | 143 132 | 6 331 | ||||||
| 2025-07-31 | 13F | Briaud Financial Planning, Inc | 546 | 0 | ||||||
| 2025-07-18 | 13F | Truist Financial Corp | 206 709 | 25,88 | 9 143 | 24,47 | ||||
| 2025-08-11 | 13F | Advisor Resource Council | 0 | −100,00 | 0 | |||||
| 2025-07-29 | 13F | AssuredPartners Investment Advisors, LLC | 9 180 | 406 | ||||||
| 2025-08-04 | 13F | Premier Path Wealth Partners, LLC | 14 667 | −6,10 | 649 | −7,16 | ||||
| 2025-07-17 | 13F | Sterling Investment Advisors, Ltd. | 20 350 | 39,29 | 900 | 37,83 | ||||
| 2025-08-05 | 13F | Beckerman Institutional, LLC | 16 987 | 0,00 | 1 | |||||
| 2025-08-14 | 13F | Kovitz Investment Group Partners, LLC | 284 748 | 42,41 | 12 593 | 40,80 | ||||
| 2025-08-12 | 13F | Proequities, Inc. | 0 | 0 | ||||||
| 2025-08-12 | 13F | Global Retirement Partners, LLC | 17 150 | 759 | ||||||
| 2025-07-17 | 13F | Janney Montgomery Scott LLC | 10 100 | 5,42 | 0 | |||||
| 2025-08-12 | 13F | Argent Trust Co | 0 | −100,00 | 0 | |||||
| 2025-08-05 | 13F | Summit Investment Advisory Services, LLC | 0 | −100,00 | 0 | |||||
| 2025-07-11 | 13F | Farther Finance Advisors, LLC | 11 944 | −4,30 | 528 | −5,55 | ||||
| 2025-07-17 | 13F | Asio Capital, LLC | 133 265 | 5 894 | ||||||
| 2025-08-04 | 13F | Bridgewealth Advisory Group, LLC | 48 520 | 140,78 | 2 146 | 138,18 | ||||
| 2025-07-17 | 13F | Clear Point Advisors Inc. | 0 | −100,00 | 0 | |||||
| 2025-08-06 | 13F | Paulson Wealth Management Inc. | 66 506 | −42,26 | 2 942 | −42,92 | ||||
| 2025-08-04 | 13F | Econ Financial Services Corp | 46 867 | −5,18 | 2 073 | −6,24 | ||||
| 2025-08-14 | 13F | Stifel Financial Corp | 37 017 | 0,43 | 1 637 | −0,67 | ||||
| 2025-08-19 | 13F | Advisory Services Network, LLC | 7 262 | 318 | ||||||
| 2025-05-12 | 13F | Fmr Llc | 0 | −100,00 | 0 | |||||
| 2025-04-23 | 13F | SFG Wealth Management, LLC. | 0 | −100,00 | 0 | |||||
| 2025-07-14 | 13F | ABLE Financial Group, LLC | 44 254 | 1 957 | ||||||
| 2025-08-06 | 13F | Able Wealth Management LLC | 31 153 | 26,50 | 1 378 | 25,07 | ||||
| 2025-08-07 | 13F | Kestra Private Wealth Services, Llc | 0 | −100,00 | 0 | |||||
| 2025-08-14 | 13F | Raymond James Financial Inc | 48 215 | 9,30 | 2 133 | 8,06 | ||||
| 2025-09-04 | 13F/A | Advisor Group Holdings, Inc. | 180 325 | 14,23 | 7 978 | 12,97 | ||||
| 2025-07-11 | 13F | Mallini Complete Financial Planning LLC | 265 | −1,12 | ||||||
| 2025-08-08 | 13F | Emerald Investment Partners, Llc | 12 692 | −7,22 | 561 | −8,18 | ||||
| 2025-08-26 | 13F | Nautilus Advisors LLC | 5 895 | −6,72 | 261 | −7,80 | ||||
| 2025-08-11 | 13F | HighTower Advisors, LLC | 7 156 | −93,80 | 317 | −93,88 | ||||
| 2025-04-24 | 13F | Bordeaux Wealth Advisors LLC | 0 | −100,00 | 0 | |||||
| 2025-08-12 | 13F | Quadcap Wealth Management, LLC | 46 527 | 5,08 | 2 058 | 3,89 | ||||
| 2025-05-14 | 13F | Susquehanna International Group, Llp | 0 | −100,00 | 0 | |||||
| 2025-08-13 | 13F | Cary Street Partners Financial Llc | 159 580 | 7 058 | ||||||
| 2025-07-18 | 13F | Wetzel Investment Advisors, Inc. | 12 000 | 0,00 | 531 | −1,12 | ||||
| 2025-07-24 | 13F | IFP Advisors, Inc | 3 309 | −8,01 | 146 | −8,75 | ||||
| 2025-07-24 | 13F | Lokken Investment Group LLC | 39 152 | −22,32 | 1 732 | −23,20 | ||||
| 2025-07-30 | 13F | Mason & Associates, LLC | 46 230 | 2 045 | ||||||
| 2025-05-12 | 13F | Independent Advisor Alliance | 0 | −100,00 | 0 | |||||
| 2025-07-11 | 13F | Sprinkle Financial Consultants LLC | 39 775 | 15,31 | 1 759 | 14,07 | ||||
| 2025-07-29 | 13F | Kelman-Lazarov, Inc. | 7 630 | 337 | ||||||
| 2025-08-14 | 13F | Sunbelt Securities, Inc. | 546 | 0,00 | 25 | 0,00 | ||||
| 2025-05-16 | 13F | Coppell Advisory Solutions LLC | 0 | −100,00 | 0 | |||||
| 2025-08-15 | 13F | Morgan Stanley | 8 262 | 826 100,00 | 365 | |||||
| 2025-08-05 | 13F | Arrowroot Family Office, LLC | 33 043 | 0,55 | 1 462 | −1,28 | ||||
| 2025-08-08 | 13F | Tortoise Investment Management, LLC | 40 | 0,00 | 2 | 0,00 | ||||
| 2025-08-11 | 13F | Private Advisor Group, LLC | 115 153 | −46,70 | 5 093 | −47,30 | ||||
| 2025-08-15 | 13F | Semmax Financial Advisors Inc. | 1 966 | 0,98 | 86 | 0,00 | ||||
| 2025-08-15 | 13F | Kestra Advisory Services, LLC | 14 871 | 112,56 | 658 | 110,58 | ||||
| 2025-07-10 | 13F | High Net Worth Advisory Group LLC | 6 022 | 0,00 | 266 | −1,12 | ||||
| 2025-08-11 | 13F | PAX Financial Group, LLC | 38 490 | −15,44 | 1 702 | −16,40 | ||||
| 2025-07-29 | 13F | Financial Futures Ltd Liability Co. | 0 | −100,00 | 0 | |||||
| 2025-08-05 | 13F | Integrity Wealth Solutions LLC | 19 487 | 101,02 | 862 | 98,85 |