Grunnleggende statistikk
| Institusjonelle eiere | 100 total, 100 long only, 0 short only, 0 long/short - change of −4,76% MRQ |
| Gjennomsnittlig porteføljeallokering | 0.1094 % - change of 0,98% MRQ |
| Institusjonelle aksjer (Long) | 10 874 360 (ex 13D/G) - change of 0,73MM shares 7,20% MRQ |
| Institusjonell verdi (Long) | $ 156 084 USD ($1000) |
Institusjonelt eierskap og aksjonærer
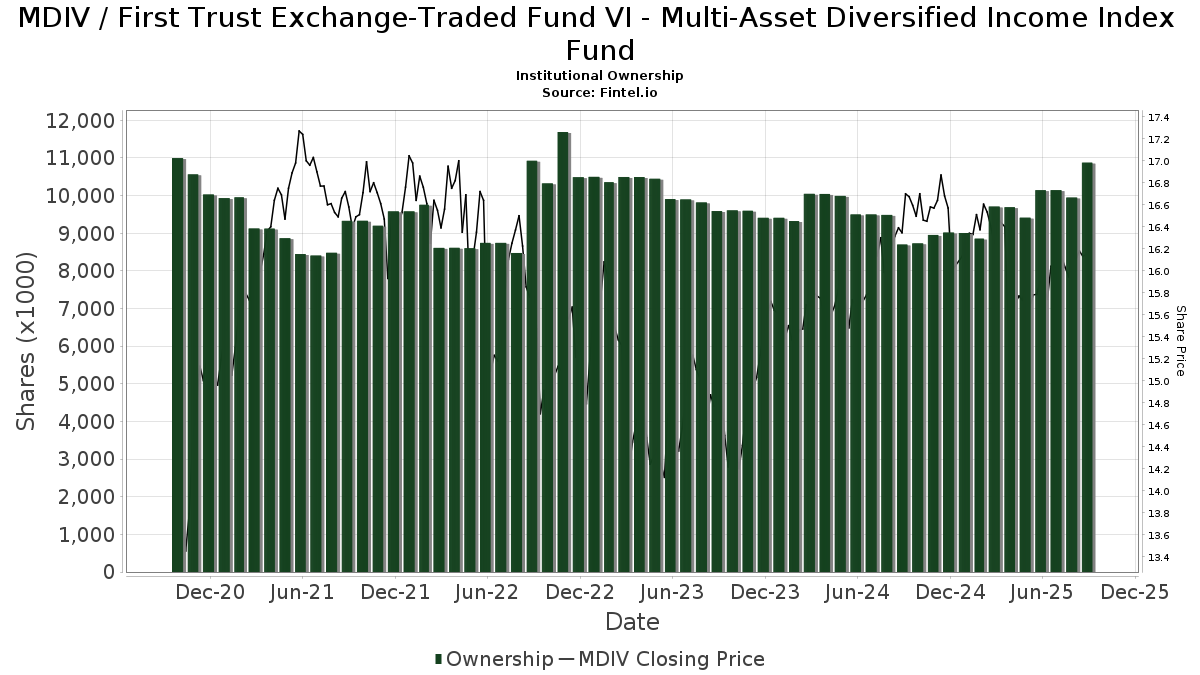
First Trust Exchange-Traded Fund VI - Multi-Asset Diversified Income Index Fund (US:MDIV) har 100 institusjonelle eiere og aksjonærer som har sendt inn 13D/G- eller 13F-skjemaer til Securities Exchange Commission (SEC). Disse institusjonene eier til sammen 10,874,360 aksjer. De største aksjonærene inkluderer Flaharty Asset Management, LLC, Ameriprise Financial Inc, LPL Financial LLC, Morgan Stanley, Commonwealth Equity Services, Llc, Bank Of America Corp /de/, Harbour Investments, Inc., Wells Fargo & Company/mn, Royal Bank Of Canada, and Raymond James Financial Inc .
First Trust Exchange-Traded Fund VI - Multi-Asset Diversified Income Index Fund (NasdaqGM:MDIV) institusjonell eierstruktur viser nåværende posisjoner i selskapet fordelt på institusjoner og fond, samt de siste endringene i posisjonsstørrelse. De største aksjonærene kan være individuelle investorer, verdipapirfond, hedgefond eller institusjoner. Schedule 13D indikerer at investoren eier (eller har eid) mer enn 5 % av selskapet og har til hensikt (eller hadde til hensikt) å aktivt forfølge en endring i forretningsstrategien. Schedule 13G indikerer en passiv investering på over 5 %.
The share price as of September 11, 2025 is 16,22 / share. Previously, on September 12, 2024, the share price was 16,42 / share. This represents a decline of 1,23% over that period.
Fondssentiment-score
Fondssentiment Score (også kjent som akkumulering av eierskap poengsum) viser hvilke aksjer som er mest kjøpt av fond. Den er resultatet av en sofistikert, kvantitativ flerfaktormodell som identifiserer selskaper med de høyeste nivåene av institusjonell akkumulering. Beregningsmodellen for poeng bruker en kombinasjon av den totale økningen i antall offentliggjorte eiere, endringer i porteføljeallokeringen til disse eierne og andre beregninger. Tallet går fra 0 til 100, der høyere tall indikerer en høyere grad av akkumulering i forhold til sammenlignbare selskaper, der 50 er gjennomsnittet.
Oppdateringsfrekvens: Daglig
Sjekk ut Ownership Explorer, som inneholder en liste over de høyest rangerte selskapene.
Institusjonell Put/Call-forhold
I tillegg til å rapportere standard aksje- og gjeldsemisjoner må institusjoner med mer enn 100 millioner kroner i forvaltningskapital også oppgi beholdningen av put- og callopsjoner. Siden put-opsjoner generelt indikerer et negativt sentiment, og call-opsjoner indikerer et positivt sentiment, kan vi få et inntrykk av det generelle institusjonelle sentimentet ved å plotte forholdet mellom put- og call-opsjoner. Diagrammet til høyre viser det historiske forholdet mellom put- og call-opsjoner for dette instrumentet.
Ved å bruke Put/Call-forholdet som en indikator på investorsentimentet kan man overvinne en av de viktigste svakhetene ved å bruke totalt institusjonelt eierskap, nemlig at en betydelig andel av forvaltningskapitalen investeres passivt for å følge indekser. Passivt forvaltede fond kjøper vanligvis ikke opsjoner, slik at indikatoren for put/call-forhold i større grad gjenspeiler stemningen i aktivt forvaltede fond.
13F- og NPORT-arkiveringer
Detaljer om 13F-arkiveringer er gratis. Detaljer om NP-arkiveringer krever et premium-medlemskap. Grønne rader indikerer nye posisjoner. Røde rader indikerer lukkede posisjoner. Klikk på lenke ikonet for å se hele transaksjonshistorikken.
Oppgrader
for å låse opp premiedata og eksportere til Excel. ![]() .
.
| Fildato | Kilde | Investor | Type | Gjennomsnittlig pris (estimert) |
Aksjer | Δ Aksjer (%) |
Rapportert verdi ($1000) | Verdi (%) | Portallokering (%) | |
|---|---|---|---|---|---|---|---|---|---|---|
| 2025-08-11 | 13F | Aptus Capital Advisors, LLC | 20 470 | −6,43 | 324 | −9,52 | ||||
| 2025-07-29 | 13F | Kraft, Davis & Associates, LLC | 10 420 | 0,00 | 167 | 3,09 | ||||
| 2025-08-06 | 13F | Wedbush Securities Inc | 82 555 | 0,17 | 1 | 0,00 | ||||
| 2025-08-08 | 13F | Flaharty Asset Management, LLC | 1 611 174 | 2,52 | 25 473 | −0,88 | ||||
| 2025-08-14 | 13F | Icon Wealth Advisors, LLC | 7 946 | 1,26 | 126 | −2,34 | ||||
| 2025-07-25 | 13F | Stephens Consulting, LLC | 200 | 0,00 | 3 | 0,00 | ||||
| 2025-08-11 | 13F | Synergy Investment Management, LLC | 0 | −100,00 | 0 | |||||
| 2025-08-12 | 13F | LPL Financial LLC | 1 196 971 | 0,74 | 18 924 | −2,59 | ||||
| 2025-08-04 | 13F | Arbor Capital Management Inc /adv | 16 008 | 18,44 | 255 | 15,38 | ||||
| 2025-08-11 | 13F | Principal Securities, Inc. | 380 | −3,31 | 6 | 0,00 | ||||
| 2025-08-12 | 13F | Cornerstone Wealth Management, LLC | 57 839 | 1,17 | 914 | −2,14 | ||||
| 2025-08-14 | 13F | Wiley Bros.-aintree Capital, Llc | 48 042 | 760 | ||||||
| 2025-08-15 | 13F | Morgan Stanley | 863 071 | 0,32 | 13 645 | −3,00 | ||||
| 2025-08-11 | 13F | Citigroup Inc | 2 000 | 0,00 | 32 | −3,12 | ||||
| 2025-08-14 | 13F | Citadel Advisors Llc | 10 659 | −75,72 | 169 | −76,57 | ||||
| 2025-08-14 | 13F/A | Rockefeller Capital Management L.P. | 151 455 | 29,37 | 2 395 | 25,08 | ||||
| 2025-08-14 | 13F | Harvest Investment Services, LLC | 107 125 | 1,86 | 1 694 | −1,51 | ||||
| 2025-08-06 | 13F | Commonwealth Equity Services, Llc | 702 944 | −1,37 | 11 | 0,00 | ||||
| 2025-09-04 | 13F/A | Advisor Group Holdings, Inc. | 138 292 | −5,81 | 2 186 | −8,92 | ||||
| 2025-08-11 | 13F | Cornerstone Planning Group LLC | 328 | 1,86 | 5 | 0,00 | ||||
| 2025-08-14 | 13F | Guardian Wealth Advisors, Llc / Nc | 2 572 | 0,00 | 41 | −4,76 | ||||
| 2025-08-14 | 13F | Snowden Capital Advisors LLC | 11 803 | −0,01 | 187 | −3,63 | ||||
| 2025-07-07 | 13F | Thurston, Springer, Miller, Herd & Titak, Inc. | 1 441 | 1,62 | 23 | −4,35 | ||||
| 2025-08-14 | 13F | Bank Of America Corp /de/ | 530 942 | −2,15 | 8 394 | −5,39 | ||||
| 2025-08-19 | 13F | Advisory Services Network, LLC | 11 633 | 6,19 | 185 | 3,35 | ||||
| 2025-07-08 | 13F | Nbc Securities, Inc. | 2 438 | 0,00 | 0 | |||||
| 2025-07-31 | 13F | Cambridge Investment Research Advisors, Inc. | 149 886 | −13,37 | 2 | 0,00 | ||||
| 2025-08-04 | 13F | L.m. Kohn & Company | 0 | −100,00 | 0 | |||||
| 2025-08-08 | 13F | Pnc Financial Services Group, Inc. | 655 | 0,00 | 10 | 0,00 | ||||
| 2025-05-14 | 13F | Northwestern Mutual Wealth Management Co | 0 | −100,00 | 0 | |||||
| 2025-07-25 | 13F | Atria Wealth Solutions, Inc. | 26 605 | 0,44 | 421 | −3,00 | ||||
| 2025-05-13 | 13F | Thrivent Financial For Lutherans | 0 | −100,00 | 0 | |||||
| 2025-07-24 | 13F | IFP Advisors, Inc | 20 669 | −5,27 | 327 | −8,43 | ||||
| 2025-08-13 | 13F | Rockport Wealth LLC | 234 411 | 3,95 | 3 706 | 0,52 | ||||
| 2025-08-12 | 13F | Jaffetilchin Investment Partners, LLC | 41 925 | −2,65 | 663 | −5,97 | ||||
| 2025-08-14 | 13F | UBS Group AG | 73 456 | −1,84 | 1 161 | −5,07 | ||||
| 2025-05-12 | 13F | Independent Advisor Alliance | 0 | −100,00 | 0 | |||||
| 2025-07-28 | 13F | Harbour Investments, Inc. | 360 401 | 12,98 | 5 698 | 9,22 | ||||
| 2025-08-08 | 13F | Fortis Group Advisors, LLC | 51 095 | 814 | ||||||
| 2025-08-06 | 13F | Prospera Financial Services Inc | 15 508 | 245 | ||||||
| 2025-08-18 | 13F/A | National Bank Of Canada /fi/ | 1 543 | 0,00 | 24 | −4,00 | ||||
| 2025-07-11 | 13F | Farther Finance Advisors, LLC | 15 522 | −8,03 | 245 | −11,23 | ||||
| 2025-08-13 | 13F | RPg Family Wealth Advisory, LLC | 20 450 | 0,00 | 323 | −3,29 | ||||
| 2025-08-08 | 13F | Larson Financial Group LLC | 36 835 | −1,34 | 582 | −4,59 | ||||
| 2025-08-14 | 13F | Raymond James Financial Inc | 280 114 | −0,49 | 4 429 | −3,80 | ||||
| 2025-07-21 | 13F | Ameritas Advisory Services, LLC | 22 208 | −3,19 | 351 | −5,14 | ||||
| 2025-07-25 | 13F | Endowment Wealth Management, Inc. | 38 716 | 10,63 | 612 | 6,99 | ||||
| 2025-08-14 | 13F | Comerica Bank | 11 394 | 0,00 | 180 | −3,23 | ||||
| 2025-07-11 | 13F | Pinnacle Bancorp, Inc. | 1 000 | 0,00 | 16 | −6,25 | ||||
| 2025-08-13 | 13F | StoneX Group Inc. | 11 993 | −32,17 | 190 | −34,60 | ||||
| 2025-08-08 | 13F | Capital Investment Advisory Services, LLC | 200 879 | −8,08 | 3 176 | −11,14 | ||||
| 2025-07-16 | 13F | ORG Partners LLC | 5 000 | 0,00 | 80 | −3,66 | ||||
| 2025-07-18 | 13F | Truist Financial Corp | 23 300 | −21,42 | 368 | −23,97 | ||||
| 2025-08-13 | 13F | Millstone Evans Group, LLC | 310 | 0,00 | 5 | −20,00 | ||||
| 2025-07-31 | 13F | Moloney Securities Asset Management, LLC | 0 | −100,00 | 0 | |||||
| 2025-07-29 | 13F | Elevation Capital Advisory, LLC | 0 | −100,00 | 0 | −100,00 | ||||
| 2025-08-13 | 13F | Jones Financial Companies Lllp | 57 483 | 11,07 | 906 | 7,35 | ||||
| 2025-08-14 | 13F | Wells Fargo & Company/mn | 353 567 | −16,86 | 5 590 | −19,63 | ||||
| 2025-07-17 | 13F | Sound Income Strategies, LLC | 0 | −100,00 | 0 | |||||
| 2025-08-12 | 13F | Park Square Financial Group, LLC | 278 | 0,00 | 4 | 0,00 | ||||
| 2025-07-17 | 13F | Janney Montgomery Scott LLC | 51 001 | −13,00 | 1 | |||||
| 2025-08-18 | 13F | Geneos Wealth Management Inc. | 2 515 | 0,00 | 40 | −4,88 | ||||
| 2025-08-14 | 13F | Stifel Financial Corp | 60 756 | −0,16 | 961 | −3,52 | ||||
| 2025-07-21 | 13F | DHJJ Financial Advisors, Ltd. | 30 | 0,00 | 0 | |||||
| 2025-07-03 | 13F | TrueWealth Advisors, LLC | 53 350 | −21,01 | 843 | −23,64 | ||||
| 2025-08-18 | 13F | Second Line Capital, LLC | 17 898 | −7,29 | 283 | −10,48 | ||||
| 2025-08-12 | 13F | PSI Advisors, LLC | 32 851 | 47,61 | 519 | 42,98 | ||||
| 2025-08-19 | 13F | Newbridge Financial Services Group, Inc. | 2 536 | −45,05 | 40 | −46,67 | ||||
| 2025-08-06 | 13F | AE Wealth Management LLC | 0 | −100,00 | 0 | |||||
| 2025-08-12 | 13F | Jpmorgan Chase & Co | 1 000 | 16 | ||||||
| 2025-08-14 | 13F | Susquehanna International Group, Llp | 0 | −100,00 | 0 | |||||
| 2025-08-14 | 13F | Freedom Financial Partners LLC | 33 832 | −3,88 | 535 | −7,13 | ||||
| 2025-05-12 | 13F | Richard W. Paul & Associates, LLC | 0 | −100,00 | 0 | |||||
| 2025-08-11 | 13F | HighTower Advisors, LLC | 32 014 | −11,44 | 506 | −14,38 | ||||
| 2025-08-08 | 13F | Intrua Financial, LLC | 25 495 | 0,00 | 403 | −3,12 | ||||
| 2025-07-23 | 13F | Tcfg Wealth Management, Llc | 61 357 | 0,21 | 970 | −3,10 | ||||
| 2025-08-05 | 13F | Sigma Planning Corp | 50 786 | −31,04 | 803 | −33,39 | ||||
| 2025-08-12 | 13F | MAI Capital Management | 6 094 | −3,05 | 96 | −5,88 | ||||
| 2025-08-13 | 13F | Baird Financial Group, Inc. | 14 134 | 17,78 | 223 | 13,78 | ||||
| 2025-08-04 | 13F | IFG Advisory, LLC | 0 | −100,00 | 0 | |||||
| 2025-08-12 | 13F | Steward Partners Investment Advisory, Llc | 1 898 | −0,68 | 30 | −3,23 | ||||
| 2025-08-14 | 13F | Fmr Llc | 197 | 3 | ||||||
| 2025-08-11 | 13F | Private Advisor Group, LLC | 53 774 | −4,50 | 850 | −7,61 | ||||
| 2025-08-14 | 13F | Royal Bank Of Canada | 344 627 | 4,17 | 5 449 | 0,72 | ||||
| 2025-07-24 | 13F | Us Bancorp \de\ | 1 800 | 0,00 | 28 | −3,45 | ||||
| 2025-08-14 | 13F | GWM Advisors LLC | 17 310 | 3,56 | 274 | 0,00 | ||||
| 2025-08-01 | 13F | Envestnet Asset Management Inc | 45 202 | −24,10 | 715 | −26,62 | ||||
| 2025-07-29 | 13F | Huntleigh Advisors, Inc. | 10 051 | 0,14 | 159 | −3,66 | ||||
| 2025-08-14 | 13F | Ameriprise Financial Inc | 1 538 244 | 147,05 | 24 348 | 139,15 | ||||
| 2025-04-17 | 13F | Authentikos Wealth Advisory, LLC | 0 | −100,00 | 0 | |||||
| 2025-07-10 | 13F | Wealth Enhancement Advisory Services, Llc | 19 764 | 0,38 | 317 | −1,56 | ||||
| 2025-07-29 | 13F | Cottonwood Capital Advisors, Llc | 66 592 | −0,02 | 1 053 | −3,40 | ||||
| 2025-05-09 | 13F | GeoWealth Management, LLC | 0 | −100,00 | 0 | |||||
| 2025-07-16 | 13F/A | CX Institutional | 851 | −0,23 | 0 | |||||
| 2025-08-08 | 13F | Cetera Investment Advisers | 269 657 | 5,74 | 4 263 | 2,23 | ||||
| 2025-08-12 | 13F | Global Retirement Partners, LLC | 7 778 | 0,00 | 123 | −2,40 | ||||
| 2025-08-12 | 13F | Founders Financial Alliance, LLC | 2 252 | 1,30 | 36 | −2,78 | ||||
| 2025-05-13 | 13F | EPG Wealth Management LLC | 0 | −100,00 | 0 | −100,00 | ||||
| 2025-08-14 | 13F | Smartleaf Asset Management LLC | 7 | 0,00 | 0 | |||||
| 2025-07-25 | 13F | Concurrent Investment Advisors, LLC | 38 941 | 19,46 | 616 | 15,38 | ||||
| 2025-08-12 | 13F | Proequities, Inc. | 0 | 0 | ||||||
| 2025-08-13 | 13F | Keystone Financial Group | 17 389 | −0,70 | 275 | −4,20 | ||||
| 2025-07-25 | 13F | Total Clarity Wealth Management, Inc. | 56 800 | 898 | ||||||
| 2025-07-29 | 13F | International Assets Investment Management, Llc | 47 205 | 102,79 | 746 | 96,32 | ||||
| 2025-07-25 | 13F | Cwm, Llc | 100 | 0,00 | 0 | |||||
| 2025-08-05 | 13F | GPS Wealth Strategies Group, LLC | 3 012 | 0,00 | 48 | −4,08 | ||||
| 2025-08-12 | 13F | SRS Capital Advisors, Inc. | 300 | 0,00 | 5 | 0,00 | ||||
| 2025-07-22 | 13F | Coastal Investment Advisors, Inc. | 0 | −100,00 | 0 | |||||
| 2025-07-29 | 13F | Stratos Wealth Partners, LTD. | 22 233 | 45,62 | 352 | 40,96 | ||||
| 2025-08-05 | 13F | Bank Of Montreal /can/ | 400 | 0,00 | 6 | 0,00 | ||||
| 2025-08-13 | 13F | Proactive Wealth Strategies LLC | 15 400 | 0,00 | 0 | |||||
| 2025-07-23 | 13F | Bellevue Asset Management, Llc | 1 169 | −12,63 | 18 | −14,29 | ||||
| 2025-08-06 | 13F | Cherry Creek Investment Advisors, Inc. | 0 | −100,00 | 0 | |||||
| 2025-05-05 | 13F | Transce3nd, LLC | 0 | −100,00 | 0 | |||||
| 2025-07-15 | 13F | Elevated Capital Advisors, LLC | 72 300 | 0,00 | 1 182 | 0,00 | ||||
| 2025-08-01 | 13F | Bessemer Group Inc | 150 | −98,36 | 0 | |||||
| 2025-08-13 | 13F | EverSource Wealth Advisors, LLC | 196 | 18,79 | 3 | 50,00 | ||||
| 2025-08-14 | 13F | CoreCap Advisors, LLC | 800 | 0,00 | 13 | −7,69 | ||||
| 2025-08-15 | 13F | Kestra Advisory Services, LLC | 128 401 | 3,82 | 2 030 | 0,40 |
Other Listings
| MX:MDIV |