Grunnleggende statistikk
| Institusjonelle eiere | 196 total, 188 long only, 1 short only, 7 long/short - change of 15,29% MRQ |
| Gjennomsnittlig porteføljeallokering | -0.3141 % - change of −231,51% MRQ |
| Institusjonelle aksjer (Long) | 9 278 138 (ex 13D/G) - change of 1,74MM shares 23,12% MRQ |
| Institusjonell verdi (Long) | $ 486 187 USD ($1000) |
Institusjonelt eierskap og aksjonærer
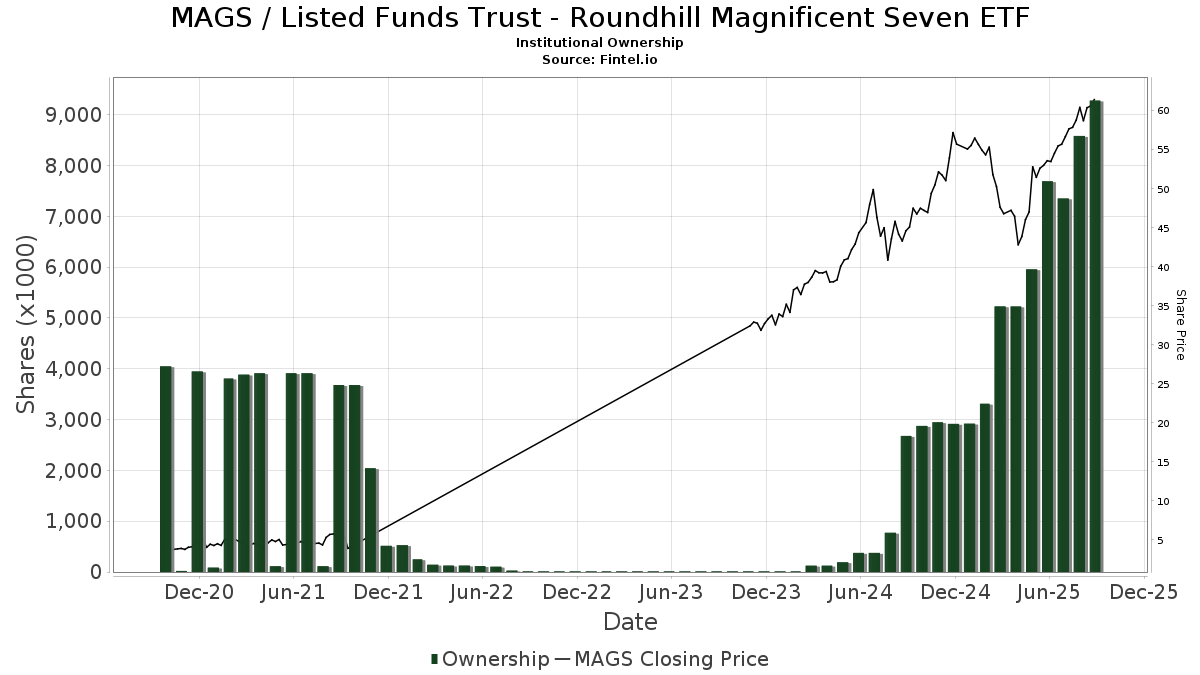
Listed Funds Trust - Roundhill Magnificent Seven ETF (US:MAGS) har 196 institusjonelle eiere og aksjonærer som har sendt inn 13D/G- eller 13F-skjemaer til Securities Exchange Commission (SEC). Disse institusjonene eier til sammen 9,564,338 aksjer. De største aksjonærene inkluderer J.Safra Asset Management Corp, Money Concepts Capital Corp, Nomura Holdings Inc, Nomura Holdings Inc, Susquehanna International Group, Llp, Jane Street Group, Llc, Susquehanna International Group, Llp, Graypoint LLC, HighTower Advisors, LLC, and Group One Trading, L.p. .
Listed Funds Trust - Roundhill Magnificent Seven ETF (BATS:MAGS) institusjonell eierstruktur viser nåværende posisjoner i selskapet fordelt på institusjoner og fond, samt de siste endringene i posisjonsstørrelse. De største aksjonærene kan være individuelle investorer, verdipapirfond, hedgefond eller institusjoner. Schedule 13D indikerer at investoren eier (eller har eid) mer enn 5 % av selskapet og har til hensikt (eller hadde til hensikt) å aktivt forfølge en endring i forretningsstrategien. Schedule 13G indikerer en passiv investering på over 5 %.
The share price as of September 12, 2025 is 62,93 / share. Previously, on September 16, 2024, the share price was 44,85 / share. This represents an increase of 40,31% over that period.
Fondssentiment-score
Fondssentiment Score (også kjent som akkumulering av eierskap poengsum) viser hvilke aksjer som er mest kjøpt av fond. Den er resultatet av en sofistikert, kvantitativ flerfaktormodell som identifiserer selskaper med de høyeste nivåene av institusjonell akkumulering. Beregningsmodellen for poeng bruker en kombinasjon av den totale økningen i antall offentliggjorte eiere, endringer i porteføljeallokeringen til disse eierne og andre beregninger. Tallet går fra 0 til 100, der høyere tall indikerer en høyere grad av akkumulering i forhold til sammenlignbare selskaper, der 50 er gjennomsnittet.
Oppdateringsfrekvens: Daglig
Sjekk ut Ownership Explorer, som inneholder en liste over de høyest rangerte selskapene.
Institusjonell Put/Call-forhold
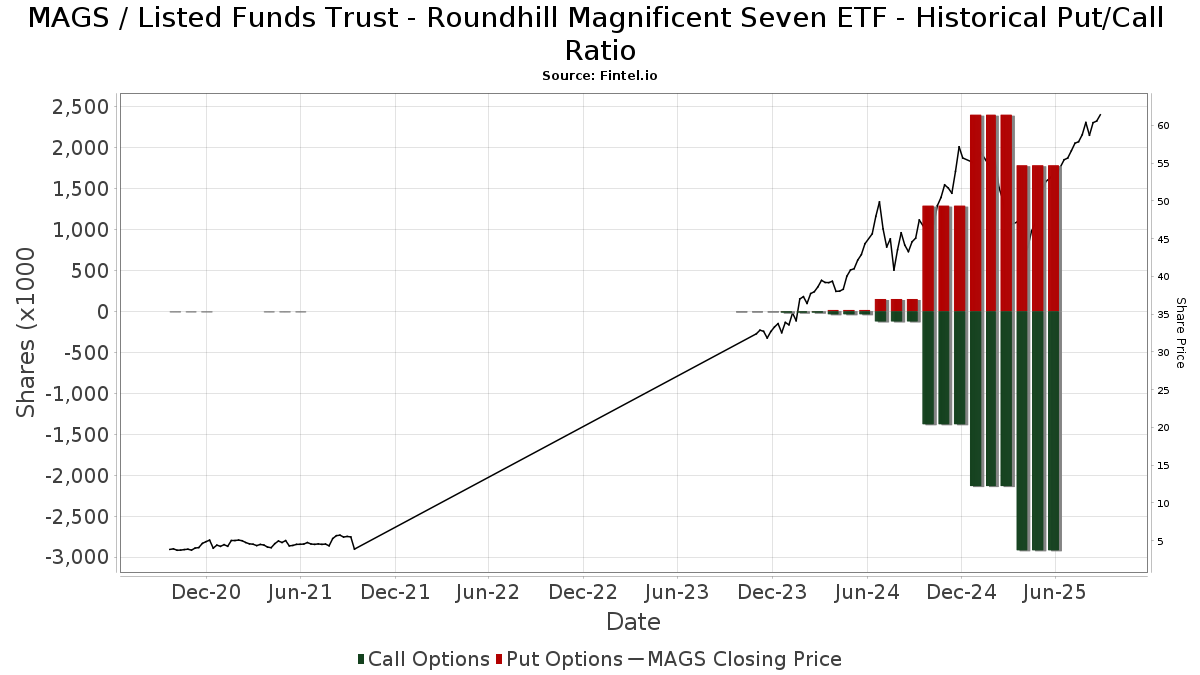
I tillegg til å rapportere standard aksje- og gjeldsemisjoner må institusjoner med mer enn 100 millioner kroner i forvaltningskapital også oppgi beholdningen av put- og callopsjoner. Siden put-opsjoner generelt indikerer et negativt sentiment, og call-opsjoner indikerer et positivt sentiment, kan vi få et inntrykk av det generelle institusjonelle sentimentet ved å plotte forholdet mellom put- og call-opsjoner. Diagrammet til høyre viser det historiske forholdet mellom put- og call-opsjoner for dette instrumentet.
Ved å bruke Put/Call-forholdet som en indikator på investorsentimentet kan man overvinne en av de viktigste svakhetene ved å bruke totalt institusjonelt eierskap, nemlig at en betydelig andel av forvaltningskapitalen investeres passivt for å følge indekser. Passivt forvaltede fond kjøper vanligvis ikke opsjoner, slik at indikatoren for put/call-forhold i større grad gjenspeiler stemningen i aktivt forvaltede fond.
13D/G-arkiveringer
Vi presenterer 13D/G-arkiveringene separat fra 13F-arkiveringene fordi de behandles forskjellig av SEC. 13D/G-arkiveringene kan sendes inn av grupper av investorer (med én leder), mens 13D/G-arkiveringene ikke kan sendes inn. Dette fører til situasjoner der en investor kan sende inn en 13D/G-rapport med én verdi for alle aksjene (som representerer alle aksjene som eies av investorgruppen), men deretter sende inn en 13F-melding med en annen verdi for alle aksjene (som kun representerer deres eget eierskap). Dette betyr at aksjeeierskap i 13D/G-arkiveringene og 13F-arkiveringene ofte ikke er direkte sammenlignbare, og vi presenterer dem derfor separat.
Merk: Fra og med 16. mai 2021 viser vi ikke lenger eiere som ikke har sendt inn en 13D/G i løpet av det siste året. Tidligere viste vi hele historikken for 13D/G-arkiveringer. Generelt må enheter som er pålagt å sende inn 13D/G-arkiveringer, sende inn minst én gang i året før de sender inn en avsluttende rapport. Det hender imidlertid at fond trekker seg ut av posisjoner uten å sende inn en avsluttende innlevering (dvs. at de avvikler), slik at visning av hele historikken av og til fører til forvirring om det nåværende eierskapet. For å unngå forvirring viser vi nå bare "nåværende" eiere, det vil si eiere som har sendt inn informasjon i løpet av det siste året.
Upgrade to unlock premium data.
| Fildato | Skjema | Investor | Tidligere aksjer |
Siste aksjer |
Δ Aksjer (prosent) |
Eierandel (prosent) |
Δ Eierandel (prosent) |
|
|---|---|---|---|---|---|---|---|---|
| 2025-08-18 | MONEY CONCEPTS CAPITAL CORP | 977,740 | 1,221,775 | 24.96 | 3.80 | 26.67 |
13F- og NPORT-arkiveringer
Detaljer om 13F-arkiveringer er gratis. Detaljer om NP-arkiveringer krever et premium-medlemskap. Grønne rader indikerer nye posisjoner. Røde rader indikerer lukkede posisjoner. Klikk på lenke ikonet for å se hele transaksjonshistorikken.
Oppgrader
for å låse opp premiedata og eksportere til Excel. ![]() .
.
| Fildato | Kilde | Investor | Type | Gjennomsnittlig pris (estimert) |
Aksjer | Δ Aksjer (%) |
Rapportert verdi ($1000) | Verdi (%) | Portallokering (%) | |
|---|---|---|---|---|---|---|---|---|---|---|
| 2025-07-28 | 13F | J.Safra Asset Management Corp | 1 410 466 | 80,89 | 78 394 | 119,23 | ||||
| 2025-07-30 | 13F | Brookstone Capital Management | 125 882 | 1 135,35 | 6 983 | 1 395,07 | ||||
| 2025-08-14 | 13F | Sunbelt Securities, Inc. | 0 | −100,00 | 0 | |||||
| 2025-07-10 | 13F | Focus Financial Network, Inc. | 18 019 | 4,56 | 1 000 | 26,46 | ||||
| 2025-08-12 | 13F | CIBC Private Wealth Group, LLC | 1 100 | 1 000,00 | 61 | 1 425,00 | ||||
| 2025-05-15 | 13F/A | Orion Portfolio Solutions, LLC | 43 991 | −26,31 | 2 017 | −37,90 | ||||
| 2025-08-08 | 13F | Larson Financial Group LLC | 690 | 38 | ||||||
| 2025-07-14 | 13F | BetterWealth, LLC | 5 825 | −16,02 | 323 | 1,57 | ||||
| 2025-08-11 | 13F | HighTower Advisors, LLC | Put | 5 000 | −88,89 | 3 | −99,36 | |||
| 2025-08-14 | 13F | Colony Group, LLC | 4 002 | −51,18 | 222 | −41,07 | ||||
| 2025-08-06 | 13F | Mascagni Wealth Management, Inc. | 10 693 | −2,54 | 593 | 17,89 | ||||
| 2025-08-14 | 13F | Citadel Advisors Llc | Put | 168 100 | −53,02 | 9 325 | −43,17 | |||
| 2025-08-01 | 13F | Brookwood Investment Group LLC | 4 031 | 224 | ||||||
| 2025-08-06 | 13F | Anchor Capital Advisors Llc | 6 927 | −36,90 | 384 | −23,66 | ||||
| 2025-08-11 | 13F | HighTower Advisors, LLC | 413 672 | 19,66 | 22 946 | 44,73 | ||||
| 2025-08-14 | 13F | Citadel Advisors Llc | Call | 254 700 | −58,67 | 14 128 | −50,01 | |||
| 2025-08-14 | 13F/A | Rockefeller Capital Management L.P. | 44 326 | 2 459 | ||||||
| 2025-08-28 | NP | Roundhill ETF Trust - Roundhill Magnificent Seven Covered Call ETF | Short | −286 200 | −15 876 | |||||
| 2025-08-14 | 13F | Citadel Advisors Llc | 153 964 | 27,29 | 8 540 | 53,96 | ||||
| 2025-08-08 | 13F | Gts Securities Llc | 3 627 | 201 | ||||||
| 2025-08-14 | 13F | Wells Fargo & Company/mn | 229 | −83,62 | 13 | −81,25 | ||||
| 2025-05-12 | 13F | Simplex Trading, Llc | 0 | −100,00 | 0 | |||||
| 2025-07-25 | 13F | Alpha Financial Partners, LLC | 9 680 | 537 | ||||||
| 2025-07-24 | 13F | JB Capital LLC | 4 870 | 4,04 | 270 | 26,17 | ||||
| 2025-08-28 | NP | MAGX - Roundhill Daily 2X Long Magnificent Seven ETF | 11 | 1 | ||||||
| 2025-08-14 | 13F | Pinnacle Family Advisors, LLC | 0 | −100,00 | 0 | |||||
| 2025-08-18 | 13F/A | National Bank Of Canada /fi/ | 899 | 112,03 | 50 | 157,89 | ||||
| 2025-08-29 | 13F | Total Investment Management Inc | 1 | 0 | ||||||
| 2025-08-27 | 13F/A | Squarepoint Ops LLC | Put | 0 | −100,00 | 0 | −100,00 | |||
| 2025-08-27 | 13F/A | Squarepoint Ops LLC | Call | 0 | −100,00 | 0 | −100,00 | |||
| 2025-07-29 | 13F | Activest Wealth Management | 2 702 | 305,71 | 150 | 396,67 | ||||
| 2025-08-14 | 13F | Money Concepts Capital Corp | 1 221 775 | 8,33 | 67 772 | 31,02 | ||||
| 2025-07-29 | 13F | Salomon & Ludwin, LLC | 2 000 | 111 | ||||||
| 2025-08-14 | 13F | Gen-Wealth Partners Inc | 82 | 0,00 | 5 | 33,33 | ||||
| 2025-08-14 | 13F | Banque Transatlantique SA | 0 | −100,00 | 0 | |||||
| 2025-07-30 | 13F | Axecap Investments, LLC | 0 | −100,00 | 0 | −100,00 | ||||
| 2025-08-12 | 13F | Park Square Financial Group, LLC | 0 | −100,00 | 0 | |||||
| 2025-05-14 | 13F | Walleye Capital LLC | 0 | −100,00 | 0 | |||||
| 2025-07-30 | 13F | FNY Investment Advisers, LLC | 0 | −100,00 | 0 | |||||
| 2025-07-23 | 13F | Defined Financial Planning LLC | 4 169 | 235 | ||||||
| 2025-08-13 | 13F | Northwestern Mutual Wealth Management Co | 26 712 | 1 418,59 | 1 482 | 1 751,25 | ||||
| 2025-08-15 | 13F | Morgan Stanley | 46 677 | −3,99 | 2 589 | 16,15 | ||||
| 2025-07-14 | 13F | Capital CS Group, LLC | 24 772 | 76,56 | 1 374 | 113,69 | ||||
| 2025-07-10 | 13F | Clare Market Investments LLC | 0 | −100,00 | 0 | |||||
| 2025-08-01 | NP | APSHX - Pinnacle Sherman Multi-Strategy Core Fund Class A | 0 | −100,00 | 0 | −100,00 | ||||
| 2025-08-14 | 13F | Fmr Llc | 0 | −100,00 | 0 | |||||
| 2025-07-15 | 13F | Norden Group Llc | 9 041 | 1,39 | 502 | 22,79 | ||||
| 2025-05-02 | 13F | Transcendent Capital Group LLC | 0 | −100,00 | 0 | |||||
| 2025-07-24 | 13F | Costello Asset Management, INC | 0 | −100,00 | 0 | |||||
| 2025-08-14 | 13F | AllSquare Wealth Management LLC | 100 | 0,00 | 6 | 25,00 | ||||
| 2025-08-14 | 13F | Two Sigma Securities, Llc | 0 | −100,00 | 0 | |||||
| 2025-07-30 | 13F | IMG Wealth Management, Inc. | 112 | 0,00 | 6 | 20,00 | ||||
| 2025-08-19 | 13F | Advisory Services Network, LLC | 4 117 | 241 | ||||||
| 2025-07-31 | 13F | Oppenheimer & Co Inc | 97 153 | −3,31 | 5 389 | 16,95 | ||||
| 2025-08-05 | 13F | Sigma Planning Corp | 26 448 | 262,75 | 1 467 | 339,22 | ||||
| 2025-07-25 | 13F | Stephens Consulting, LLC | 6 | 0,00 | 0 | |||||
| 2025-07-24 | 13F | Morton Brown Family Wealth, LLC | 8 | 0,00 | 0 | |||||
| 2025-08-14 | 13F | RMB Capital Management, LLC | 0 | −100,00 | 0 | |||||
| 2025-07-10 | 13F | Capital Advisory Group Advisory Services, LLC | 13 966 | 775 | ||||||
| 2025-08-08 | 13F | Avantax Advisory Services, Inc. | 6 370 | 353 | ||||||
| 2025-08-14 | 13F | Ausdal Financial Partners, Inc. | 8 396 | 466 | ||||||
| 2025-08-08 | 13F | Fortis Group Advisors, LLC | 61 705 | 3 615 | ||||||
| 2025-07-25 | 13F | Envestnet Portfolio Solutions, Inc. | 6 624 | −56,09 | 367 | −46,89 | ||||
| 2025-08-15 | 13F | Tower Research Capital LLC (TRC) | 127 645 | 7 080 | ||||||
| 2025-08-13 | 13F | Beacon Pointe Advisors, LLC | 5 030 | 7,92 | 279 | 30,99 | ||||
| 2025-08-14 | 13F | Vienna Asset Management LLC | 16 945 | 940 | ||||||
| 2025-08-14 | 13F | Raymond James Financial Inc | 6 318 | −6,81 | 350 | 12,90 | ||||
| 2025-08-14 | 13F | Massar Capital Management, LP | 56 000 | −42,86 | 3 106 | −30,89 | ||||
| 2025-08-14 | 13F | Jane Street Group, Llc | Call | 722 500 | 40 077 | |||||
| 2025-05-14 | 13F | Change Path, LLC | 0 | −100,00 | 0 | |||||
| 2025-08-06 | 13F | Legacy Wealth Managment, LLC/ID | 704 | −25,19 | 39 | −9,30 | ||||
| 2025-07-09 | 13F | Triumph Capital Management | 17 920 | 18,73 | 994 | 43,64 | ||||
| 2025-08-14 | 13F | Qube Research & Technologies Ltd | 264 521 | −36,57 | 14 673 | −23,25 | ||||
| 2025-07-24 | 13F | Fischer Investment Strategies, Llc | 21 620 | 1,77 | 1 199 | 23,10 | ||||
| 2025-08-12 | 13F | LPL Financial LLC | 51 567 | 272,14 | 2 860 | 350,39 | ||||
| 2025-08-08 | 13F | Kingsview Wealth Management, LLC | 7 004 | 30,50 | 389 | 57,72 | ||||
| 2025-08-14 | 13F | UBS Group AG | 95 914 | 801,79 | 5 320 | 992,40 | ||||
| 2025-08-18 | 13F | Wolverine Trading, Llc | Put | 84 600 | −42,37 | 4 702 | −30,41 | |||
| 2025-05-14 | 13F | Caitlin John, LLC | 0 | −100,00 | 0 | |||||
| 2025-08-18 | 13F | Wolverine Trading, Llc | 18 133 | −7,50 | 1 008 | 11,64 | ||||
| 2025-08-14 | 13F | CIBC World Markets Inc. | 0 | −100,00 | 0 | |||||
| 2025-08-11 | 13F | Private Advisor Group, LLC | 18 907 | 24,97 | 1 049 | 51,23 | ||||
| 2025-07-30 | NP | ENDW - Cambria Endowment Style ETF | 379 | 20 | ||||||
| 2025-04-14 | 13F | IMC-Chicago, LLC | 0 | −100,00 | 0 | |||||
| 2025-07-17 | 13F | Sound Income Strategies, LLC | 1 562 | 0,00 | 87 | 21,13 | ||||
| 2025-08-14 | 13F | Jane Street Group, Llc | Put | 91 500 | 5 076 | |||||
| 2025-04-24 | 13F | Wright Fund Managment, LLC | 0 | −100,00 | 0 | |||||
| 2025-05-01 | 13F | Grant/GrossMendelsohn, LLC | 31 541 | −17,17 | 1 461 | −29,54 | ||||
| 2025-07-15 | 13F | Xcel Wealth Management, LLC | 7 160 | 11,70 | 397 | 35,49 | ||||
| 2025-08-14 | 13F | Tudor Investment Corp Et Al | 0 | −100,00 | 0 | |||||
| 2025-08-13 | 13F | NINE MASTS CAPITAL Ltd | 53 725 | 2 980 | ||||||
| 2025-08-11 | 13F | Strategic Wealth Partners, Ltd. | 4 808 | 15,13 | 267 | 15,65 | ||||
| 2025-08-18 | 13F | Wolverine Trading, Llc | Call | 94 600 | −39,55 | 5 258 | −27,02 | |||
| 2025-07-10 | 13F | Exchange Traded Concepts, Llc | 276 011 | 15 310 | ||||||
| 2025-08-14 | 13F | Diversify Advisory Services, LLC | 6 824 | 54,28 | 413 | 100,49 | ||||
| 2025-07-28 | 13F | WealthPlan Investment Management, LLC | 6 049 | 2,08 | 336 | 23,62 | ||||
| 2025-08-14 | 13F | Paragon Private Wealth Management, LLC | 20 013 | 36,22 | 1 110 | 64,93 | ||||
| 2025-07-23 | 13F | Prime Capital Investment Advisors, LLC | 5 780 | −96,74 | 321 | −96,06 | ||||
| 2025-05-07 | 13F | University Of Texas/texas Am Investment Managment Co | 0 | −100,00 | 0 | |||||
| 2025-08-08 | 13F | Altfest L J & Co Inc | 64 345 | −56,26 | 3 569 | −47,09 | ||||
| 2025-08-14 | 13F | CoreCap Advisors, LLC | 50 323 | 36,79 | 2 791 | 65,44 | ||||
| 2025-08-12 | 13F | Proequities, Inc. | 0 | 0 | ||||||
| 2025-08-04 | 13F | Kovack Advisors, Inc. | 6 584 | 365 | ||||||
| 2025-07-18 | 13F | New Wave Wealth Advisors Llc | 6 407 | 24,99 | 355 | 51,06 | ||||
| 2025-08-01 | 13F | Liberty Wealth Management Llc | 0 | −100,00 | 0 | |||||
| 2025-08-07 | 13F | PFG Advisors | 4 804 | 266 | ||||||
| 2025-08-11 | 13F | Principal Securities, Inc. | 31 340 | 47,57 | 1 738 | 50,48 | ||||
| 2025-07-16 | 13F | Maridea Wealth Management LLC | 0 | −100,00 | 0 | −100,00 | ||||
| 2025-08-13 | 13F | Victory Financial Group, Llc | 20 372 | 69,48 | 1 130 | 105,08 | ||||
| 2025-08-18 | 13F | Geneos Wealth Management Inc. | 0 | −100,00 | 0 | −100,00 | ||||
| 2025-08-13 | 13F | Oxler Private Wealth LLC | 10 253 | 569 | ||||||
| 2025-08-14 | 13F | Royal Bank Of Canada | 73 058 | 61,37 | 4 053 | 95,23 | ||||
| 2025-08-28 | NP | GTAAX - Power Global Tactical Allocation/JAForlines Fund Class A | 0 | −100,00 | 0 | −100,00 | ||||
| 2025-08-11 | 13F | Cornerstone Planning Group LLC | 64 | 4 | ||||||
| 2025-07-18 | 13F | PFG Investments, LLC | 9 740 | −3,01 | 540 | 17,39 | ||||
| 2025-08-08 | 13F | Donoghue Forlines LLC | 0 | −100,00 | 0 | |||||
| 2025-08-05 | 13F | Milestone Asset Management, Llc | 9 510 | −11,23 | 528 | 7,33 | ||||
| 2025-08-08 | 13F | City Of London Investment Management Co Ltd | 9 845 | 546 | ||||||
| 2025-07-21 | 13F | Fortis Capital Advisors, LLC | 9 015 | −38,30 | 500 | −25,37 | ||||
| 2025-05-29 | NP | Northern Lights Fund Trust - Sierra Tactical Risk Spectrum 30 Fund Instl Class | 0 | −100,00 | 0 | −100,00 | ||||
| 2025-05-29 | NP | Northern Lights Fund Trust - Sierra Tactical Risk Spectrum 50 Fund Investor Class | 0 | −100,00 | 0 | −100,00 | ||||
| 2025-07-22 | 13F | Unique Wealth, Llc | 8 021 | −0,02 | 445 | 20,98 | ||||
| 2025-07-23 | 13F | Kingswood Wealth Advisors, Llc | 6 800 | 25,93 | 377 | 50,20 | ||||
| 2025-07-15 | 13F | Graypoint LLC | 419 571 | 23 274 | ||||||
| 2025-08-07 | 13F | Midland Wealth Advisors Llc | 116 224 | −0,40 | 6 447 | 20,46 | ||||
| 2025-05-29 | NP | SIRAX - Sierra Tactical All Asset Fund Class A | 0 | −100,00 | 0 | −100,00 | ||||
| 2025-07-30 | 13F | Bogart Wealth, LLC | 452 | 0,00 | 25 | 25,00 | ||||
| 2025-05-29 | NP | Northern Lights Fund Trust - Sierra Tactical Core Growth Fund Investor Class Shares | 0 | −100,00 | 0 | −100,00 | ||||
| 2025-05-29 | NP | Northern Lights Fund Trust - Sierra Tactical Risk Spectrum 70 Fund Investor Class | 0 | −100,00 | 0 | −100,00 | ||||
| 2025-08-08 | 13F | Cetera Investment Advisers | 0 | −100,00 | 0 | |||||
| 2025-08-12 | 13F | Global Retirement Partners, LLC | 111 | 6 | ||||||
| 2025-04-16 | 13F | Wealth Enhancement Advisory Services, Llc | 0 | −100,00 | 0 | |||||
| 2025-07-21 | 13F | Mirae Asset Global Investments Co., Ltd. | 17 950 | −17,58 | 996 | −0,70 | ||||
| 2025-08-12 | 13F | Trexquant Investment LP | 5 608 | 311 | ||||||
| 2025-08-15 | 13F | Kestra Advisory Services, LLC | 22 250 | 26,48 | 1 234 | 53,10 | ||||
| 2025-08-14 | 13F | Ieq Capital, Llc | 32 114 | 233,96 | 1 781 | 303,85 | ||||
| 2025-07-31 | 13F | Carnegie Capital Asset Management, LLC | 8 304 | −42,23 | 461 | −22,82 | ||||
| 2025-07-23 | 13F | IMZ Advisory Inc | 140 182 | 15,41 | 8 017 | 43,93 | ||||
| 2025-07-21 | 13F | Jackson Wealth Management, LLC | 49 950 | 0,83 | 2 771 | 21,96 | ||||
| 2025-08-13 | 13F | Twin Peaks Wealth Advisors, LLC | 929 | 56 | ||||||
| 2025-08-06 | 13F | Prospera Financial Services Inc | 3 680 | 204 | ||||||
| 2025-08-14 | 13F | Mml Investors Services, Llc | 38 873 | −74,60 | 2 | −71,43 | ||||
| 2025-04-30 | 13F | J Hagan Capital, Inc. | 3 757 | 204 | ||||||
| 2025-07-14 | 13F | Iams Wealth Management, Llc | 7 335 | 26,49 | 407 | 53,21 | ||||
| 2025-08-01 | 13F | Envestnet Asset Management Inc | 68 699 | −72,08 | 3 811 | −66,23 | ||||
| 2025-05-14 | 13F | Susquehanna International Group, Llp | 0 | −100,00 | 0 | −100,00 | ||||
| 2025-07-25 | 13F | waypoint wealth counsel | 4 102 | 228 | ||||||
| 2025-08-08 | 13F | Advyzon Investment Management, LLC | 7 923 | −12,50 | 439 | 5,78 | ||||
| 2025-09-04 | 13F/A | Advisor Group Holdings, Inc. | 201 616 | 149,50 | 11 184 | 201,84 | ||||
| 2025-08-12 | 13F | Insigneo Advisory Services, Llc | 12 610 | 26,49 | 699 | 52,95 | ||||
| 2025-08-14 | 13F | Federation des caisses Desjardins du Quebec | 20 780 | 12,10 | 1 152 | 35,53 | ||||
| 2025-08-11 | 13F | Brown Brothers Harriman & Co | 76 | 0,00 | 4 | 33,33 | ||||
| 2025-09-10 | 13F | WT Wealth Management | 19 231 | 49,22 | 1 067 | 80,37 | ||||
| 2025-08-14 | 13F | Mariner, LLC | 180 120 | 6,03 | 9 991 | 28,25 | ||||
| 2025-08-12 | 13F | Integrated Advisors Network LLC | 39 221 | 5,12 | 2 176 | 27,12 | ||||
| 2025-05-14 | 13F | Flow Traders U.s. Llc | 0 | −100,00 | 0 | |||||
| 2025-08-15 | 13F | Cooksen Wealth, LLC | 17 096 | 948 | ||||||
| 2025-08-29 | 13F | Centaurus Financial, Inc. | 31 752 | −2,16 | 2 | 0,00 | ||||
| 2025-08-13 | 13F | Cerity Partners LLC | 9 570 | 13,16 | 531 | 36,95 | ||||
| 2025-08-14 | 13F | Murphy & Mullick Capital Management Corp | 725 | 156,18 | 42 | 250,00 | ||||
| 2025-07-09 | 13F | Reyes Financial Architecture, Inc. | 0 | −100,00 | 0 | |||||
| 2025-05-09 | 13F | Pamalican Asset Management Ltd | 0 | −100,00 | 0 | |||||
| 2025-08-14 | 13F | Balyasny Asset Management Llc | 103 460 | 86,01 | 5 739 | 125,02 | ||||
| 2025-05-16 | 13F | Arete Wealth Advisors, LLC | 0 | −100,00 | 0 | |||||
| 2025-07-14 | 13F | AdvisorNet Financial, Inc | 685 | 38 | ||||||
| 2025-08-06 | 13F | Commonwealth Equity Services, Llc | 218 880 | 2,05 | 12 | 33,33 | ||||
| 2025-07-25 | 13F | Cwm, Llc | 1 899 | 15,16 | 0 | |||||
| 2025-08-15 | 13F | Captrust Financial Advisors | 8 311 | 28,36 | 461 | 55,74 | ||||
| 2025-08-08 | 13F | Hartland & Co., LLC | 6 922 | 384 | ||||||
| 2025-08-14 | 13F | Susquehanna International Group, Llp | Put | 432 200 | −45,98 | 23 974 | −34,66 | |||
| 2025-08-14 | 13F | Susquehanna International Group, Llp | Call | 835 300 | 172,26 | 46 334 | 229,33 | |||
| 2025-08-13 | 13F | Maia Wealth LLC | 4 439 | −35,81 | 246 | −20,65 | ||||
| 2025-08-06 | 13F | Wedbush Securities Inc | 7 326 | 0 | ||||||
| 2025-08-14 | 13F | Talon Private Wealth, LLC | 66 599 | 3 694 | ||||||
| 2025-07-25 | 13F | PrairieView Partners, LLC | 28 | 154,55 | 0 | |||||
| 2025-04-22 | 13F | Castleview Partners, Llc | 0 | −100,00 | 0 | −100,00 | ||||
| 2025-07-15 | 13F | BigSur Wealth Management LLC | 32 000 | −28,89 | 1 775 | −13,96 | ||||
| 2025-07-31 | 13F | Cambridge Investment Research Advisors, Inc. | 183 254 | 56,54 | 10 | 100,00 | ||||
| 2025-05-07 | 13F | Vista Private Wealth Partners. LLC | 0 | −100,00 | 0 | |||||
| 2025-08-12 | 13F | J.w. Cole Advisors, Inc. | 18 682 | 15,06 | 1 036 | 39,25 | ||||
| 2025-07-25 | 13F | Atria Wealth Solutions, Inc. | 118 472 | 72,01 | 6 572 | 108,07 | ||||
| 2025-08-14 | 13F | Hrt Financial Lp | 0 | −100,00 | 0 | |||||
| 2025-05-15 | 13F | Scoggin Management Lp | Call | 0 | −100,00 | 0 | −100,00 | |||
| 2025-08-12 | 13F | Steward Partners Investment Advisory, Llc | 2 420 | −95,29 | 134 | −94,31 | ||||
| 2025-08-28 | 13F | China Universal Asset Management Co., Ltd. | 0 | −100,00 | 0 | |||||
| 2025-07-24 | 13F | Blair William & Co/il | 5 805 | −32,65 | 322 | −18,48 | ||||
| 2025-08-01 | 13F | Belvedere Trading LLC | Call | 8 500 | 471 | |||||
| 2025-04-22 | 13F | Synergy Financial Management, LLC | 0 | −100,00 | 0 | |||||
| 2025-08-01 | 13F | Belvedere Trading LLC | Put | 600 | 33 | |||||
| 2025-07-28 | 13F | RFG Advisory, LLC | 113 982 | −6,70 | 6 323 | 12,85 | ||||
| 2025-08-04 | 13F | Creative Financial Designs Inc /adv | 78 | −32,17 | 4 | −20,00 | ||||
| 2025-08-15 | 13F | Concentric Capital Strategies, LP | 180 825 | −66,40 | 10 030 | −59,36 | ||||
| 2025-07-25 | 13F | Concurrent Investment Advisors, LLC | 21 091 | 1 170 | ||||||
| 2025-08-11 | 13F | Goodman Financial Corp | 4 135 | 229 | ||||||
| 2025-08-12 | 13F | Boxwood Ventures, Inc. | 12 000 | 0,00 | 666 | 20,91 | ||||
| 2025-08-13 | 13F | Financial Freedom, LLC | 7 345 | 145,90 | 407 | 199,26 | ||||
| 2025-08-14 | 13F | Comerica Bank | 254 | 14 | ||||||
| 2025-08-14 | 13F | GWM Advisors LLC | 12 968 | 32,87 | 719 | 60,85 | ||||
| 2025-08-13 | 13F | Townsquare Capital Llc | 0 | −100,00 | 0 | |||||
| 2025-08-06 | 13F | Legacy Investment Solutions, LLC | 704 | 39 | ||||||
| 2025-07-10 | 13F | Three Seasons Wealth, LLC | 6 963 | 0,00 | 386 | 21,00 | ||||
| 2025-04-22 | 13F | FSC Wealth Advisors, LLC | 0 | −100,00 | 0 | |||||
| 2025-07-09 | 13F | Key Client Fiduciary Advisors, LLC | 24 074 | 1,39 | 1 335 | 22,70 | ||||
| 2025-08-13 | 13F | Marshall Wace, Llp | 258 125 | 14 318 | ||||||
| 2025-07-28 | 13F | Evernest Financial Advisors, LLC | 0 | −100,00 | 0 | |||||
| 2025-07-31 | 13F | Sage Mountain Advisors LLC | 6 100 | 338 | ||||||
| 2025-05-13 | 13F | Elevatus Welath Management | 0 | −100,00 | 0 | |||||
| 2025-07-30 | 13F | BlueChip Wealth Advisors LLC | 20 833 | 1 156 | ||||||
| 2025-08-14 | 13F | Jane Street Group, Llc | 0 | −100,00 | 0 | −100,00 | ||||
| 2025-08-14 | 13F | Integrated Wealth Concepts LLC | 12 903 | 716 | ||||||
| 2025-08-27 | 13F/A | Brinker Capital Investments, LLC | 54 283 | 23,40 | 3 011 | 49,28 | ||||
| 2025-07-17 | 13F | Janney Montgomery Scott LLC | 14 966 | −38,11 | 1 | −100,00 | ||||
| 2025-07-07 | 13F | Thurston, Springer, Miller, Herd & Titak, Inc. | 100 | 0,00 | 6 | 25,00 | ||||
| 2025-08-08 | 13F | Creative Planning | 13 804 | −5,09 | 766 | 14,86 | ||||
| 2025-07-23 | 13F | Trifecta Capital Advisors, LLC | 1 000 | 0,00 | 55 | 22,22 | ||||
| 2025-07-22 | 13F | Wealthcare Advisory Partners LLC | 11 151 | 619 | ||||||
| 2025-08-18 | 13F | Tactive Advisors, LLC | 61 426 | 3 407 | ||||||
| 2025-08-19 | 13F | Newbridge Financial Services Group, Inc. | 0 | −100,00 | 0 | |||||
| 2025-08-07 | 13F | Runnymede Capital Advisors, Inc. | 0 | −100,00 | 0 | |||||
| 2025-07-22 | 13F | Belpointe Asset Management LLC | 33 792 | −36,69 | 1 874 | −23,42 | ||||
| 2025-08-12 | 13F | Jpmorgan Chase & Co | 67 924 | 3 768 | ||||||
| 2025-07-01 | 13F | Harbor Investment Advisory, Llc | 580 | 32 | ||||||
| 2025-08-06 | 13F | AE Wealth Management LLC | 0 | −100,00 | 0 | |||||
| 2025-06-27 | 13F | Copley Financial Group, Inc. | 42 | 0,00 | 2 | 0,00 | ||||
| 2025-08-05 | 13F | Bank Of Montreal /can/ | 5 461 | −26,93 | 303 | −11,70 | ||||
| 2025-08-14 | 13F | Boothbay Fund Management, Llc | 6 700 | 372 | ||||||
| 2025-08-14 | 13F | Goldman Sachs Group Inc | 24 935 | 146,25 | 1 383 | 198,06 | ||||
| 2025-07-17 | 13F | Catalytic Wealth RIA, LLC | 7 122 | −12,21 | 395 | 6,18 | ||||
| 2025-07-11 | 13F | Farther Finance Advisors, LLC | 8 | 0 | ||||||
| 2025-08-08 | 13F | Foundations Investment Advisors, LLC | 11 815 | 655 | ||||||
| 2025-07-24 | 13F | Us Bancorp \de\ | 599 | 0,00 | 33 | 22,22 | ||||
| 2025-08-14 | 13F | IHT Wealth Management, LLC | 5 054 | −1,46 | 280 | 19,15 | ||||
| 2025-07-25 | 13F | Hazlett, Burt & Watson, Inc. | 704 | 0,00 | 0 | |||||
| 2025-08-13 | 13F | Smith, Moore & Co. | 8 535 | 473 | ||||||
| 2025-08-14 | 13F | Warren Averett Asset Management, LLC | 31 592 | −4,20 | 1 752 | 15,87 | ||||
| 2025-07-29 | 13F | International Assets Investment Management, Llc | 5 430 | 8,47 | 301 | 31,44 | ||||
| 2025-08-08 | 13F | SG Americas Securities, LLC | 13 390 | 1 | ||||||
| 2025-08-12 | 13F | SRS Capital Advisors, Inc. | 2 776 | 77,61 | 154 | 115,49 | ||||
| 2025-07-07 | 13F | Investors Research Corp | 240 | 0,00 | 13 | 18,18 | ||||
| 2025-07-21 | 13F | Ameritas Advisory Services, LLC | 9 053 | 67,93 | 502 | 103,24 | ||||
| 2025-07-21 | 13F | Ameriflex Group, Inc. | 2 090 | −25,94 | 115 | −11,63 | ||||
| 2025-08-05 | 13F | Strategic Financial Concepts, LLC | 6 180 | 343 | ||||||
| 2025-08-08 | 13F | Comprehensive Financial Planning, Inc./PA | 35 790 | 7,83 | 1 985 | 30,42 | ||||
| 2025-08-14 | 13F | Group One Trading, L.p. | 300 373 | 16 662 | ||||||
| 2025-07-14 | 13F | Capital CS Group, LLC | Call | 0 | −100,00 | 0 | −100,00 | |||
| 2025-05-09 | 13F | Belvedere Trading LLC | 0 | −100,00 | 0 | −100,00 | ||||
| 2025-08-14 | 13F | Bnp Paribas | 7 851 | 438 | ||||||
| 2025-08-06 | 13F | First Horizon Advisors, Inc. | 0 | −100,00 | 0 | |||||
| 2025-07-28 | 13F | Harbour Investments, Inc. | 45 726 | 0,30 | 2 536 | 21,34 | ||||
| 2025-08-18 | 13F/A | Nomura Holdings Inc | Call | 1 000 000 | 0,00 | 55 470 | 20,96 | |||
| 2025-07-02 | 13F | HBW Advisory Services LLC | 8 968 | −15,67 | 497 | 2,05 | ||||
| 2025-08-18 | 13F/A | Nomura Holdings Inc | Put | 1 000 000 | 0,00 | 55 470 | 20,96 | |||
| 2025-08-07 | 13F | Kestra Private Wealth Services, Llc | 4 774 | 265 | ||||||
| 2025-08-14 | 13F | Millennium Management Llc | 187 696 | 66,34 | 10 411 | 101,22 | ||||
| 2025-07-16 | 13F | ORG Partners LLC | 35 | 0,00 | 2 | 0,00 | ||||
| 2025-08-14 | 13F | Bank Of America Corp /de/ | 36 855 | 331,05 | 2 044 | 421,43 | ||||
| 2025-04-22 | 13F | Petra Financial Advisors Inc | 0 | −100,00 | 0 | |||||
| 2025-07-15 | 13F | World Equity Group, Inc. | 12 708 | 36,91 | 705 | 65,65 | ||||
| 2025-07-16 | 13F | Twelve Points Wealth Management LLC | 5 050 | 280 | ||||||
| 2025-08-12 | 13F | MAI Capital Management | 43 | 2 | ||||||
| 2025-07-09 | 13F | Krilogy Financial LLC | 10 849 | −29,23 | 602 | −14,51 | ||||
| 2025-08-01 | 13F | Anson Capital, Inc. | 4 443 | 0,00 | 246 | 21,18 | ||||
| 2025-07-08 | 13F | Parallel Advisors, LLC | 285 | −61,22 | 16 | −54,55 | ||||
| 2025-07-18 | 13F | Bartlett & Co. Wealth Management Llc | 0 | −100,00 | 0 | |||||
| 2025-08-12 | 13F | American Asset Management Inc. | 4 518 | 0,00 | 251 | 20,77 | ||||
| 2025-08-04 | 13F | Creekmur Asset Management LLC | 648 | 3,51 | 36 | 25,00 |
Other Listings
| PE:MAGS |