Grunnleggende statistikk
| Institusjonelle eiere | 182 total, 182 long only, 0 short only, 0 long/short - change of 5,14% MRQ |
| Gjennomsnittlig porteføljeallokering | 0.2604 % - change of −21,36% MRQ |
| Institusjonelle aksjer (Long) | 4 936 891 (ex 13D/G) - change of 0,65MM shares 15,25% MRQ |
| Institusjonell verdi (Long) | $ 609 608 USD ($1000) |
Institusjonelt eierskap og aksjonærer
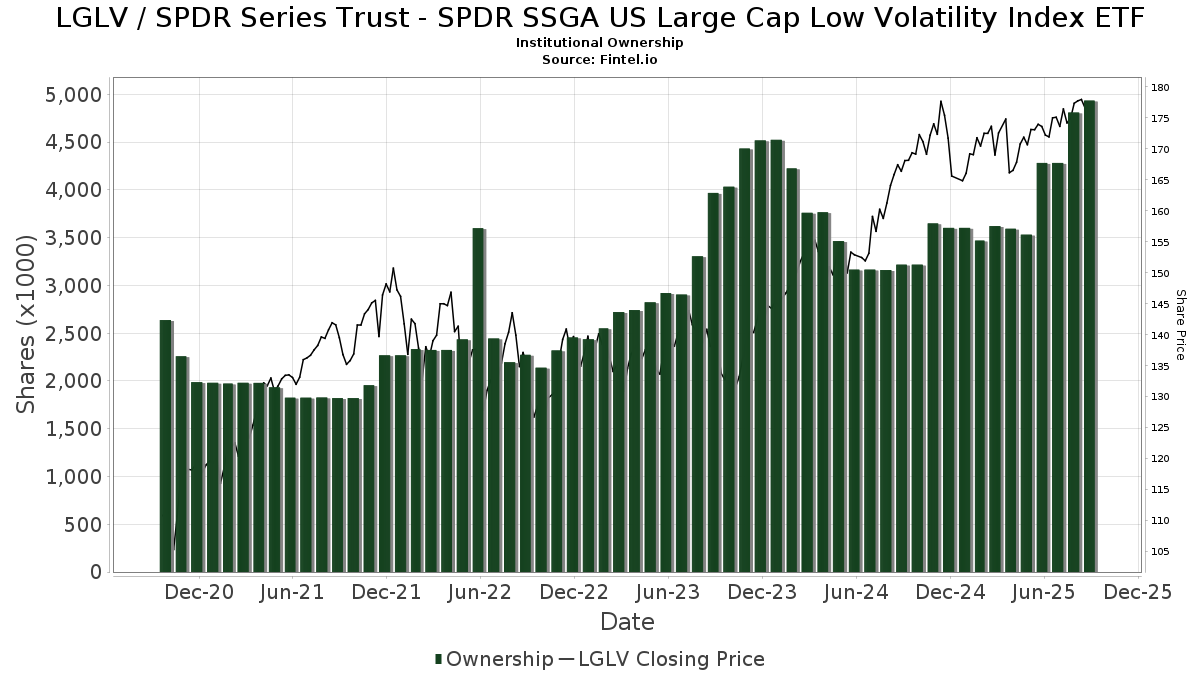
SPDR Series Trust - SPDR SSGA US Large Cap Low Volatility Index ETF (US:LGLV) har 182 institusjonelle eiere og aksjonærer som har sendt inn 13D/G- eller 13F-skjemaer til Securities Exchange Commission (SEC). Disse institusjonene eier til sammen 4,936,891 aksjer. De største aksjonærene inkluderer Cwm, Llc, Syntegra Private Wealth Group, LLC, Baltimore-Washington Financial Advisors, Inc., Gerber Kawasaki Wealth & Investment Management, LPL Financial LLC, Congress Wealth Management LLC / DE /, Jpmorgan Chase & Co, Morgan Stanley, DORVAL Corp, and State Street Corp .
SPDR Series Trust - SPDR SSGA US Large Cap Low Volatility Index ETF (ARCA:LGLV) institusjonell eierstruktur viser nåværende posisjoner i selskapet fordelt på institusjoner og fond, samt de siste endringene i posisjonsstørrelse. De største aksjonærene kan være individuelle investorer, verdipapirfond, hedgefond eller institusjoner. Schedule 13D indikerer at investoren eier (eller har eid) mer enn 5 % av selskapet og har til hensikt (eller hadde til hensikt) å aktivt forfølge en endring i forretningsstrategien. Schedule 13G indikerer en passiv investering på over 5 %.
The share price as of September 9, 2025 is 177,19 / share. Previously, on September 10, 2024, the share price was 167,01 / share. This represents an increase of 6,10% over that period.
Fondssentiment-score
Fondssentiment Score (også kjent som akkumulering av eierskap poengsum) viser hvilke aksjer som er mest kjøpt av fond. Den er resultatet av en sofistikert, kvantitativ flerfaktormodell som identifiserer selskaper med de høyeste nivåene av institusjonell akkumulering. Beregningsmodellen for poeng bruker en kombinasjon av den totale økningen i antall offentliggjorte eiere, endringer i porteføljeallokeringen til disse eierne og andre beregninger. Tallet går fra 0 til 100, der høyere tall indikerer en høyere grad av akkumulering i forhold til sammenlignbare selskaper, der 50 er gjennomsnittet.
Oppdateringsfrekvens: Daglig
Sjekk ut Ownership Explorer, som inneholder en liste over de høyest rangerte selskapene.
Institusjonell Put/Call-forhold
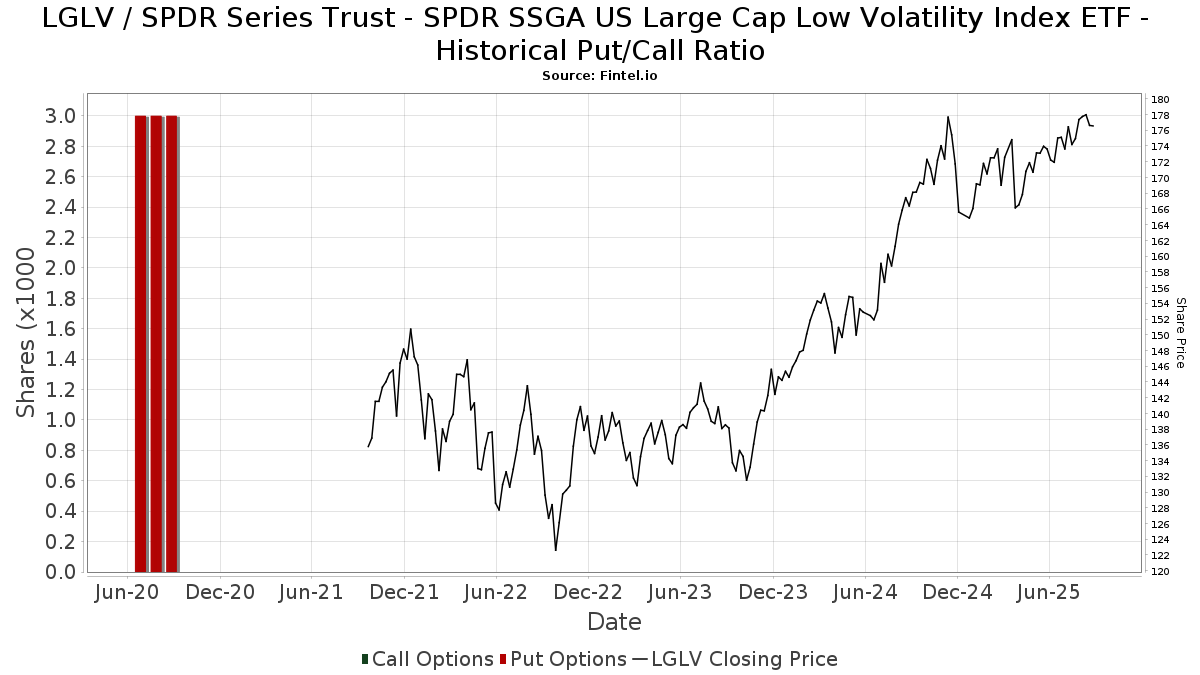
I tillegg til å rapportere standard aksje- og gjeldsemisjoner må institusjoner med mer enn 100 millioner kroner i forvaltningskapital også oppgi beholdningen av put- og callopsjoner. Siden put-opsjoner generelt indikerer et negativt sentiment, og call-opsjoner indikerer et positivt sentiment, kan vi få et inntrykk av det generelle institusjonelle sentimentet ved å plotte forholdet mellom put- og call-opsjoner. Diagrammet til høyre viser det historiske forholdet mellom put- og call-opsjoner for dette instrumentet.
Ved å bruke Put/Call-forholdet som en indikator på investorsentimentet kan man overvinne en av de viktigste svakhetene ved å bruke totalt institusjonelt eierskap, nemlig at en betydelig andel av forvaltningskapitalen investeres passivt for å følge indekser. Passivt forvaltede fond kjøper vanligvis ikke opsjoner, slik at indikatoren for put/call-forhold i større grad gjenspeiler stemningen i aktivt forvaltede fond.
13F- og NPORT-arkiveringer
Detaljer om 13F-arkiveringer er gratis. Detaljer om NP-arkiveringer krever et premium-medlemskap. Grønne rader indikerer nye posisjoner. Røde rader indikerer lukkede posisjoner. Klikk på lenke ikonet for å se hele transaksjonshistorikken.
Oppgrader
for å låse opp premiedata og eksportere til Excel. ![]() .
.
| Fildato | Kilde | Investor | Type | Gjennomsnittlig pris (estimert) |
Aksjer | Δ Aksjer (%) |
Rapportert verdi ($1000) | Verdi (%) | Portallokering (%) | |
|---|---|---|---|---|---|---|---|---|---|---|
| 2025-07-31 | 13F | Sage Mountain Advisors LLC | 18 958 | 0,00 | 3 310 | 0,33 | ||||
| 2025-08-05 | 13F | Hutchens & Kramer Investment Management Group, LLC | 3 209 | −5,09 | 564 | −4,25 | ||||
| 2025-07-16 | 13F/A | CX Institutional | 41 | 0,00 | 0 | |||||
| 2025-08-14 | 13F | Avant Capital LLC | 3 246 | 3,34 | 567 | 3,66 | ||||
| 2025-07-30 | 13F | Paul Damon & Associates, Inc. | 6 183 | −0,48 | 1 080 | −0,19 | ||||
| 2025-08-14 | 13F | Mercer Global Advisors Inc /adv | 1 786 | −5,30 | 312 | −5,18 | ||||
| 2025-07-29 | 13F | Stratos Wealth Partners, LTD. | 2 683 | −4,49 | 469 | −4,10 | ||||
| 2025-08-14 | 13F | Qube Research & Technologies Ltd | 90 | 16 | ||||||
| 2025-08-04 | 13F | Integrity Alliance, Llc. | 57 768 | −35,15 | 10 087 | −34,95 | ||||
| 2025-08-05 | 13F | Tsfg, Llc | 3 718 | −0,99 | 1 | |||||
| 2025-07-22 | 13F | Legacy Trust | 0 | −100,00 | 0 | |||||
| 2025-07-29 | 13F | Private Trust Co Na | 901 | −6,24 | 157 | −5,99 | ||||
| 2025-07-21 | 13F | Ameriflex Group, Inc. | 91 | 0,00 | 16 | 0,00 | ||||
| 2025-07-31 | 13F | Cambridge Investment Research Advisors, Inc. | 12 828 | −42,54 | 2 | −33,33 | ||||
| 2025-08-01 | 13F | Brookwood Investment Group LLC | 1 703 | 0,00 | 297 | 0,34 | ||||
| 2025-07-11 | 13F | SILVER OAK SECURITIES, Inc | 0 | −100,00 | 0 | |||||
| 2025-08-08 | 13F | Avantax Advisory Services, Inc. | 4 751 | −41,97 | 830 | −41,78 | ||||
| 2025-08-11 | 13F | Wealthgarden F.s. Llc | 1 665 | −3,42 | 289 | −4,00 | ||||
| 2025-08-27 | 13F | Barnes Wealth Management Group, Inc | 3 713 | 39,90 | 648 | 40,56 | ||||
| 2025-07-16 | 13F | Signaturefd, Llc | 530 | 0,00 | 93 | 0,00 | ||||
| 2025-07-25 | 13F | Atria Wealth Solutions, Inc. | 1 311 | 229 | ||||||
| 2025-08-14 | 13F | Goldman Sachs Group Inc | 10 760 | −65,02 | 1 879 | −64,92 | ||||
| 2025-08-11 | 13F | Western Wealth Management, LLC | 1 341 | 0,00 | 234 | 0,43 | ||||
| 2025-08-12 | 13F | Financial Advocates Investment Management | 6 961 | −2,81 | 1 215 | −2,49 | ||||
| 2025-07-22 | 13F | Iowa State Bank | 1 660 | −31,09 | 290 | −31,03 | ||||
| 2025-07-29 | 13F | Portland Financial Advisors Inc | 6 062 | 0,00 | 1 058 | 0,28 | ||||
| 2025-08-12 | 13F | Steward Partners Investment Advisory, Llc | 1 501 | −3,22 | 262 | −2,60 | ||||
| 2025-08-11 | 13F | Berkeley, Inc | 2 740 | 0,18 | 478 | 0,42 | ||||
| 2025-05-12 | 13F | Independent Advisor Alliance | 0 | −100,00 | 0 | |||||
| 2025-08-14 | 13F | IHT Wealth Management, LLC | 8 270 | 3,79 | 1 444 | 4,18 | ||||
| 2025-07-16 | 13F | Independent Wealth Network Inc. | 5 970 | −2,56 | 1 042 | −2,25 | ||||
| 2025-08-14 | 13F | Harwood Advisory Group, LLC | 2 254 | −19,64 | 394 | −15,12 | ||||
| 2025-08-13 | 13F | Millington Financial Advisors, LLC | 1 734 | −2,42 | 306 | 3,39 | ||||
| 2025-08-14 | 13F | Bank Of America Corp /de/ | 91 399 | 4,63 | 15 959 | 4,98 | ||||
| 2025-08-06 | 13F | Wedbush Securities Inc | 3 890 | −4,14 | 1 | |||||
| 2025-08-18 | 13F | Geneos Wealth Management Inc. | 369 | 5,43 | 64 | 6,67 | ||||
| 2025-07-31 | 13F | Moloney Securities Asset Management, LLC | 1 379 | −5,87 | 241 | −5,51 | ||||
| 2025-08-26 | 13F/A | Thrivent Financial For Lutherans | 2 261 | 0 | ||||||
| 2025-08-11 | 13F | Vista Cima Wealth Management LLC | 3 044 | 0,00 | 532 | 0,38 | ||||
| 2025-08-14 | 13F | Comerica Bank | 311 | −1,27 | 54 | 0,00 | ||||
| 2025-08-14 | 13F | Daiwa Securities Group Inc. | 9 500 | −5,19 | 2 | 0,00 | ||||
| 2025-08-15 | 13F | Equitable Holdings, Inc. | 0 | −100,00 | 0 | |||||
| 2025-07-30 | 13F | Advantage Trust Co | 219 | 38 | ||||||
| 2025-08-13 | 13F | Fisher Asset Management, LLC | 1 227 | 0,00 | 214 | 0,47 | ||||
| 2025-08-12 | 13F | Jpmorgan Chase & Co | 175 531 | 148,74 | 30 649 | 149,56 | ||||
| 2025-07-09 | 13F | Riversedge Advisors, Llc | 4 936 | −17,86 | 862 | −17,61 | ||||
| 2025-07-17 | 13F | ERn Financial, LLC | 0 | −100,00 | 0 | |||||
| 2025-08-08 | 13F | Fortis Group Advisors, LLC | 7 210 | −2,96 | 1 251 | −3,33 | ||||
| 2025-08-11 | 13F | First American Trust, Fsb | 32 117 | 3,78 | 5 608 | 4,10 | ||||
| 2025-08-06 | 13F | Paladin Advisory Group, LLC | 304 | 0,00 | 53 | 1,92 | ||||
| 2025-08-06 | 13F | Founders Financial Securities Llc | 74 041 | 81,50 | 12 928 | 87,44 | ||||
| 2025-08-14 | 13F | Abound Financial, Llc | 4 558 | −2,25 | 796 | −1,97 | ||||
| 2025-08-14 | 13F | Mariner, LLC | 10 089 | 19,47 | 1 762 | 19,88 | ||||
| 2025-07-09 | 13F | Reyes Financial Architecture, Inc. | 40 | 0,00 | 7 | 0,00 | ||||
| 2025-08-13 | 13F | Jones Financial Companies Lllp | 2 409 | 44,25 | 418 | 45,30 | ||||
| 2025-08-06 | 13F | Atlantic Union Bankshares Corp | 17 | 3 | ||||||
| 2025-07-25 | 13F | Cwm, Llc | 1 380 611 | 69,48 | 241 | 70,92 | ||||
| 2025-08-15 | 13F | Tower Research Capital LLC (TRC) | 472 | −79,97 | 82 | −80,00 | ||||
| 2025-07-28 | 13F | Harbour Investments, Inc. | 4 237 | 2,96 | 740 | 3,21 | ||||
| 2025-08-14 | 13F | Aqr Capital Management Llc | 67 466 | 3,39 | 11 780 | 3,73 | ||||
| 2025-08-14 | 13F | Prestige Wealth Management Group LLC | 0 | −100,00 | 0 | |||||
| 2025-08-14 | 13F | Sei Investments Co | 25 127 | −6,77 | 4 387 | −6,46 | ||||
| 2025-07-22 | 13F | McNaughton Wealth Management, LLC | 15 834 | 4,38 | 2 765 | 4,70 | ||||
| 2025-07-21 | 13F | Investment Planning Advisors, Inc. | 1 300 | 0,00 | 227 | 0,00 | ||||
| 2025-08-12 | 13F | SRS Capital Advisors, Inc. | 619 | 0,49 | 108 | 0,93 | ||||
| 2025-08-14 | 13F | GWM Advisors LLC | 667 | −76,93 | 116 | −76,94 | ||||
| 2025-04-21 | 13F | Nelson, Van Denburg & Campbell Wealth Management Group, LLC | 0 | −100,00 | 0 | |||||
| 2025-08-08 | 13F | Capital Investment Advisory Services, LLC | 17 | 0,00 | 3 | 0,00 | ||||
| 2025-07-28 | 13F | Cypress Wealth Services, LLC | 5 166 | 0,00 | 902 | 0,33 | ||||
| 2025-07-11 | 13F | Mallini Complete Financial Planning LLC | 430 | 2,63 | ||||||
| 2025-08-11 | 13F | Private Advisor Group, LLC | 6 537 | 0,23 | 1 141 | 0,53 | ||||
| 2025-07-24 | 13F | Stonebridge Financial Group, LLC | 1 330 | 232 | ||||||
| 2025-08-01 | 13F | Envestnet Asset Management Inc | 13 241 | 14,52 | 2 312 | 14,91 | ||||
| 2025-08-08 | 13F | Thrive Capital Management, LLC | 5 256 | 918 | ||||||
| 2025-08-14 | 13F | Old Mission Capital Llc | 0 | −100,00 | 0 | |||||
| 2025-08-14 | 13F | Stifel Financial Corp | 1 442 | −66,37 | 252 | −66,35 | ||||
| 2025-08-08 | 13F | Good Life Advisors, LLC | 2 350 | 410 | ||||||
| 2025-05-15 | 13F | Gts Securities Llc | 0 | −100,00 | 0 | |||||
| 2025-08-14 | 13F | Two Sigma Investments, Lp | 21 410 | 3 738 | ||||||
| 2025-04-11 | 13F | Signal Advisors Wealth, LLC | 0 | −100,00 | 0 | |||||
| 2025-08-06 | 13F | Ethos Financial Group, LLC | 37 037 | 88,81 | 6 467 | 89,45 | ||||
| 2025-08-13 | 13F | Gateway Wealth Partners, LLC | 4 710 | 822 | ||||||
| 2025-08-18 | 13F | Front Row Advisors LLC | 60 | 0,00 | 10 | 0,00 | ||||
| 2025-08-14 | 13F | Win Advisors, Inc | 0 | −100,00 | 0 | |||||
| 2025-08-06 | 13F | AE Wealth Management LLC | 2 353 | −4,31 | 411 | −3,98 | ||||
| 2025-08-07 | 13F | Efficient Advisors, LLC | 4 671 | −34,83 | 816 | −34,64 | ||||
| 2025-07-30 | 13F | Caliber Wealth Management, LLC / KS | 11 309 | −22,23 | 1 975 | −21,98 | ||||
| 2025-08-14 | 13F | Federation des caisses Desjardins du Quebec | 100 | 0,00 | 17 | 0,00 | ||||
| 2025-08-14 | 13F | Legacy Advisory Services, LLC | 10 813 | 0,30 | 1 888 | 0,64 | ||||
| 2025-08-14 | 13F | Royal Bank Of Canada | 1 542 | 2,59 | 269 | 3,07 | ||||
| 2025-07-30 | 13F | Bogart Wealth, LLC | 1 067 | −0,74 | 186 | −0,53 | ||||
| 2025-07-22 | 13F | Merit Financial Group, LLC | 1 967 | −0,56 | 343 | −0,29 | ||||
| 2025-07-11 | 13F | Farther Finance Advisors, LLC | 3 171 | −52,56 | 554 | −52,49 | ||||
| 2025-08-12 | 13F | J.w. Cole Advisors, Inc. | 3 518 | 8,48 | 614 | 8,87 | ||||
| 2025-07-25 | 13F | Commonwealth Financial Services, LLC | 2 311 | 0,00 | 403 | 0,25 | ||||
| 2025-05-19 | 13F | Heck Capital Advisors, LLC | 0 | 0 | ||||||
| 2025-07-22 | 13F | Miracle Mile Advisors, LLC | 7 168 | −8,66 | 1 252 | −8,35 | ||||
| 2025-08-11 | 13F | Aptus Capital Advisors, LLC | 2 186 | 0,09 | 382 | 0,26 | ||||
| 2025-07-28 | 13F | Mutual Advisors, LLC | 3 561 | −0,28 | 629 | 4,49 | ||||
| 2025-07-15 | 13F | Norden Group Llc | 8 655 | −3,73 | 1 511 | −3,39 | ||||
| 2025-08-14 | 13F | Wiley Bros.-aintree Capital, Llc | 2 154 | 0,47 | 376 | 2,17 | ||||
| 2025-08-06 | 13F | Commonwealth Equity Services, Llc | 16 447 | −1,82 | 3 | 0,00 | ||||
| 2025-07-10 | 13F | High Net Worth Advisory Group LLC | 2 400 | 0,00 | 419 | 0,48 | ||||
| 2025-08-13 | 13F | VestGen Advisors, LLC | 50 039 | 8 740 | ||||||
| 2025-08-01 | 13F | Advisory Alpha, LLC | 1 362 | −3,75 | 238 | −3,66 | ||||
| 2025-08-12 | 13F | Proequities, Inc. | 0 | 0 | ||||||
| 2025-07-30 | 13F | Insight Advisors, LLC/ PA | 2 740 | −7,40 | 479 | −7,18 | ||||
| 2025-08-14 | 13F | Ieq Capital, Llc | 92 605 | 0,00 | 16 170 | 0,33 | ||||
| 2025-08-14 | 13F | UBS Group AG | 13 564 | 8,24 | 2 368 | 8,62 | ||||
| 2025-07-30 | 13F | Brookstone Capital Management | 2 812 | −10,62 | 491 | −10,24 | ||||
| 2025-08-14 | 13F | CoreCap Advisors, LLC | 31 | 0,00 | 5 | 0,00 | ||||
| 2025-08-08 | 13F | Thoroughbred Financial Services, Llc | 10 139 | −8,15 | 2 | 0,00 | ||||
| 2025-05-15 | 13F | WPG Advisers, LLC | 0 | −100,00 | 0 | |||||
| 2025-07-28 | 13F | Rosenberg Matthew Hamilton | 97 | −17,80 | 17 | −20,00 | ||||
| 2025-08-11 | 13F | Blue Bell Private Wealth Management, Llc | 160 | 0,00 | 28 | 0,00 | ||||
| 2025-07-24 | 13F | Blair William & Co/il | 323 | 56 | ||||||
| 2025-07-30 | 13F | Syntegra Private Wealth Group, LLC | 698 710 | 8,15 | 122 002 | 8,50 | ||||
| 2025-08-14 | 13F | Horizon Investments, LLC | 73 961 | 76,78 | 12 914 | 77,37 | ||||
| 2025-07-30 | 13F | Strategic Blueprint, LLC | 4 915 | −0,95 | 858 | −0,58 | ||||
| 2025-07-15 | 13F | Aspire Capital Advisors LLC | 1 912 | 54,32 | 334 | 54,88 | ||||
| 2025-08-14 | 13F | Ameriprise Financial Inc | 27 248 | 468,38 | 4 623 | 454,20 | ||||
| 2025-07-14 | 13F | Park Avenue Securities Llc | 1 639 | 0 | ||||||
| 2025-07-30 | 13F | Journey Advisory Group, LLC | 21 005 | 2,84 | 3 668 | 3,18 | ||||
| 2025-08-18 | 13F | Arq Wealth Advisors, Llc | 2 742 | 0,00 | 477 | 0,00 | ||||
| 2025-07-14 | 13F | Painted Porch Advisors LLC | 22 | 0,00 | 4 | 0,00 | ||||
| 2025-08-06 | 13F/A | Flagship Private Wealth, LLC | 6 445 | 1,72 | 1 125 | 2,09 | ||||
| 2025-07-30 | 13F | Pacific Sun Financial Corp | 1 150 | 0,00 | 201 | 0,00 | ||||
| 2025-08-12 | 13F | BlackRock, Inc. | 346 | 0,00 | 60 | 0,00 | ||||
| 2025-08-13 | 13F | Vermillion & White Wealth Management Group, LLC | 37 | −21,28 | 7 | −25,00 | ||||
| 2025-07-24 | 13F | Us Bancorp \de\ | 43 | 2,38 | 7 | 0,00 | ||||
| 2025-08-07 | 13F | Hughes Financial Services, LLC | 1 155 | 0,00 | 202 | 0,50 | ||||
| 2025-07-23 | 13F | Valmark Advisers, Inc. | 26 132 | 12,29 | 4 563 | 12,64 | ||||
| 2025-07-30 | 13F | Prosperity Financial Group, Inc. | 1 621 | 283 | ||||||
| 2025-07-29 | 13F | Elevation Capital Advisory, LLC | 0 | −100,00 | 0 | |||||
| 2025-07-25 | 13F | Apollon Financial, LLC | 5 155 | 106,61 | 900 | 107,37 | ||||
| 2025-07-17 | 13F | Janney Montgomery Scott LLC | 1 400 | 0,00 | 0 | |||||
| 2025-09-04 | 13F/A | Advisor Group Holdings, Inc. | 28 001 | 37,27 | 4 890 | 37,71 | ||||
| 2025-08-14 | 13F/A | Skopos Labs, Inc. | 60 | 10 | ||||||
| 2025-08-06 | 13F | RFG - Bristol Wealth Advisors, LLC | 4 960 | 866 | ||||||
| 2025-08-13 | 13F | Milestone Investment Advisors LLC | 8 967 | −4,59 | 1 566 | −4,28 | ||||
| 2025-05-12 | 13F | Sandy Spring Bank | 16 | 0,00 | 3 | 0,00 | ||||
| 2025-07-24 | 13F | Ulland Investment Advisors, LLC | 187 | 289,58 | 0 | |||||
| 2025-08-13 | 13F | BCJ Capital Management, LLC | 1 603 | 0,50 | 280 | 0,72 | ||||
| 2025-08-04 | 13F | Assetmark, Inc | 128 | −5,19 | 22 | −4,35 | ||||
| 2025-08-05 | 13F | Magnolia Capital Advisors Llc | 42 893 | 7 490 | ||||||
| 2025-07-21 | 13F | Empirical Financial Services, LLC d.b.a. Empirical Wealth Management | 3 855 | −1,28 | 673 | −0,88 | ||||
| 2025-07-28 | 13F | DORVAL Corp | 114 883 | 2,61 | 20 060 | 2,50 | ||||
| 2025-07-29 | 13F | Signature Estate & Investment Advisors Llc | 1 438 | −6,32 | 251 | −5,99 | ||||
| 2025-08-13 | 13F | GeoWealth Management, LLC | 0 | −100,00 | 0 | |||||
| 2025-07-10 | 13F | HF Advisory Group, LLC | 30 370 | 4,27 | 5 303 | 4,60 | ||||
| 2025-07-09 | 13F | Pallas Capital Advisors LLC | 11 617 | 2 028 | ||||||
| 2025-08-14 | 13F | Gerber Kawasaki Wealth & Investment Management | 259 539 | −0,60 | 45 318 | −0,28 | ||||
| 2025-07-15 | 13F | Sheets Smith Wealth Management | 4 798 | 0,00 | 838 | 0,24 | ||||
| 2025-07-08 | 13F | Nbc Securities, Inc. | 408 | 0,00 | 0 | |||||
| 2025-08-12 | 13F | O'shaughnessy Asset Management, Llc | 294 | −23,24 | 51 | −22,73 | ||||
| 2025-08-14 | 13F | Citadel Advisors Llc | 1 364 | 238 | ||||||
| 2025-08-15 | 13F | Morgan Stanley | 168 069 | −0,08 | 29 347 | 0,25 | ||||
| 2025-08-14 | 13F | Cardiff Park Advisors, Llc | 2 719 | 0,00 | 475 | 0,21 | ||||
| 2025-08-12 | 13F | Calton & Associates, Inc. | 1 323 | 4,50 | 231 | 4,55 | ||||
| 2025-07-21 | 13F | Ameritas Advisory Services, LLC | 0 | −100,00 | 0 | |||||
| 2025-08-18 | 13F | Second Line Capital, LLC | 2 186 | 0,09 | 382 | 0,26 | ||||
| 2025-08-13 | 13F | EverSource Wealth Advisors, LLC | 9 | 0,00 | 2 | 0,00 | ||||
| 2025-08-15 | 13F | WFA of San Diego, LLC | 6 | −96,15 | 1 | −96,15 | ||||
| 2025-07-22 | 13F | Olistico Wealth, LLC | 57 | 0,00 | 10 | 0,00 | ||||
| 2025-08-13 | 13F | JBR Co Financial Management Inc | 2 531 | 442 | ||||||
| 2025-08-13 | 13F | Baltimore-Washington Financial Advisors, Inc. | 279 627 | 1,46 | 48 826 | 1,79 | ||||
| 2025-08-12 | 13F | Cornerstone Wealth Management, LLC | 1 678 | 8,40 | 293 | 8,55 | ||||
| 2025-08-11 | 13F | HighTower Advisors, LLC | 2 360 | 0,00 | 412 | 0,49 | ||||
| 2025-08-11 | 13F | Tidemark, LLC | 33 | −42,11 | 6 | −44,44 | ||||
| 2025-08-14 | 13F | State Street Corp | 103 795 | 99,15 | 18 124 | 99,81 | ||||
| 2025-07-22 | 13F | Financial Insights, Inc. | 7 219 | −2,97 | 1 261 | −2,63 | ||||
| 2025-08-05 | 13F | Dunhill Financial, LLC | 0 | 0 | ||||||
| 2025-08-08 | 13F | Cornerstone Advisors Asset Management, Inc | 0 | −100,00 | 0 | |||||
| 2025-07-10 | 13F | Wealth Enhancement Advisory Services, Llc | 21 295 | −22,48 | 3 747 | −21,65 | ||||
| 2025-04-15 | 13F | Eagle Capital Management, LLC | 0 | −100,00 | 0 | |||||
| 2025-07-21 | 13F | Barrett & Company, Inc. | 1 054 | 0,00 | 184 | 0,55 | ||||
| 2025-08-05 | 13F | Roffman Miller Associates Inc /pa/ | 12 094 | 0,40 | 2 112 | 0,72 | ||||
| 2025-07-22 | 13F | Accel Wealth Management | 1 375 | 0,00 | 240 | 0,42 | ||||
| 2025-08-14 | 13F | Mml Investors Services, Llc | 2 883 | 21,19 | 1 | |||||
| 2025-08-14 | 13F | Jane Street Group, Llc | 0 | −100,00 | 0 | |||||
| 2025-08-14 | 13F | Mission Creek Capital Partners, Inc. | 5 816 | −4,40 | 1 015 | −4,06 | ||||
| 2025-08-05 | 13F | Flynn Zito Capital Management, Llc | 1 175 | 0,51 | 205 | 0,99 | ||||
| 2025-08-13 | 13F | Northwestern Mutual Wealth Management Co | 6 558 | −3,94 | 1 145 | −3,62 | ||||
| 2025-08-14 | 13F | Wells Fargo & Company/mn | 89 | 36,92 | 15 | 36,36 | ||||
| 2025-05-15 | 13F | Sykon Capital Llc | 0 | −100,00 | 0 | −100,00 | ||||
| 2025-08-08 | 13F | Comprehensive Financial Planning, Inc./PA | 252 | 0,80 | 44 | 0,00 | ||||
| 2025-08-12 | 13F | LPL Financial LLC | 195 209 | 15,43 | 34 085 | 15,81 | ||||
| 2025-08-04 | 13F | Spire Wealth Management | 168 | 32,28 | 29 | 31,82 | ||||
| 2025-08-19 | 13F | Newbridge Financial Services Group, Inc. | 306 | 0,00 | 53 | 0,00 | ||||
| 2025-08-14 | 13F | Susquehanna International Group, Llp | 8 739 | 61,83 | 1 526 | 62,41 | ||||
| 2025-08-08 | 13F | Foundations Investment Advisors, LLC | 0 | −100,00 | 0 | |||||
| 2025-08-14 | 13F | Atomi Financial Group, Inc. | 3 786 | −2,12 | 661 | −1,78 | ||||
| 2025-08-08 | 13F | Cetera Investment Advisers | 13 755 | 55,02 | 2 402 | 55,51 | ||||
| 2025-07-10 | 13F | ARS Wealth Advisors Group, LLC | 2 342 | 0,30 | 409 | 0,49 | ||||
| 2025-08-08 | 13F | Bouchey Financial Group Ltd | 1 400 | 0,00 | 244 | 0,41 | ||||
| 2025-08-14 | 13F | Integrated Wealth Concepts LLC | 4 796 | 0,99 | 837 | 1,33 | ||||
| 2025-04-23 | 13F | Fourth Dimension Wealth, LLC | 0 | −100,00 | 0 | |||||
| 2025-08-14 | 13F | Fmr Llc | 2 525 | 14,15 | 441 | 14,29 | ||||
| 2025-08-14 | 13F | Harvest Investment Services, LLC | 3 272 | 0,62 | 571 | 1,06 | ||||
| 2025-08-07 | 13F | CENTRAL TRUST Co | 378 | 0,00 | 66 | 1,54 | ||||
| 2025-08-14 | 13F | EP Wealth Advisors, Inc. | 1 525 | 7,02 | 266 | 7,26 | ||||
| 2025-08-14 | 13F | Raymond James Financial Inc | 31 507 | 0,83 | 5 501 | 1,16 | ||||
| 2025-08-13 | 13F | Congress Wealth Management LLC / DE / | 187 919 | −9,05 | 32 813 | −8,76 | ||||
| 2025-07-25 | 13F | NorthRock Partners, LLC | 64 | 0,00 | 11 | 0,00 | ||||
| 2025-08-04 | 13F | Creative Financial Designs Inc /adv | 3 531 | −2,99 | 617 | −2,69 | ||||
| 2025-07-14 | 13F | AdvisorNet Financial, Inc | 1 375 | 49,62 | 240 | 50,94 | ||||
| 2025-07-15 | 13F | Regatta Capital Group, Llc | 5 639 | 985 | ||||||
| 2025-05-02 | 13F | Transcendent Capital Group LLC | 0 | −100,00 | 0 | |||||
| 2025-08-13 | 13F | Townsquare Capital Llc | 0 | −100,00 | 0 |