Grunnleggende statistikk
| Institusjonelle eiere | 100 total, 100 long only, 0 short only, 0 long/short - change of −3,81% MRQ |
| Gjennomsnittlig porteføljeallokering | 0.3189 % - change of −0,76% MRQ |
| Institusjonelle aksjer (Long) | 7 710 003 (ex 13D/G) - change of −0,71MM shares −8,47% MRQ |
| Institusjonell verdi (Long) | $ 336 066 USD ($1000) |
Institusjonelt eierskap og aksjonærer
J.P. Morgan Exchange-Traded Fund Trust - JPMorgan Diversified Return U.S. Small Cap Equity ETF (US:JPSE) har 100 institusjonelle eiere og aksjonærer som har sendt inn 13D/G- eller 13F-skjemaer til Securities Exchange Commission (SEC). Disse institusjonene eier til sammen 7,710,003 aksjer. De største aksjonærene inkluderer Koss-Olinger Consulting, LLC, LPL Financial LLC, Raymond James Financial Inc, Bank Of America Corp /de/, Royal Bank Of Canada, Hartford Financial Management Inc., Morgan Stanley, Goldstein Advisors, LLC, Stifel Financial Corp, and Northwestern Mutual Wealth Management Co .
J.P. Morgan Exchange-Traded Fund Trust - JPMorgan Diversified Return U.S. Small Cap Equity ETF (ARCA:JPSE) institusjonell eierstruktur viser nåværende posisjoner i selskapet fordelt på institusjoner og fond, samt de siste endringene i posisjonsstørrelse. De største aksjonærene kan være individuelle investorer, verdipapirfond, hedgefond eller institusjoner. Schedule 13D indikerer at investoren eier (eller har eid) mer enn 5 % av selskapet og har til hensikt (eller hadde til hensikt) å aktivt forfølge en endring i forretningsstrategien. Schedule 13G indikerer en passiv investering på over 5 %.
The share price as of September 10, 2025 is 49,62 / share. Previously, on September 11, 2024, the share price was 45,06 / share. This represents an increase of 10,13% over that period.

Fondssentiment-score
Fondssentiment Score (også kjent som akkumulering av eierskap poengsum) viser hvilke aksjer som er mest kjøpt av fond. Den er resultatet av en sofistikert, kvantitativ flerfaktormodell som identifiserer selskaper med de høyeste nivåene av institusjonell akkumulering. Beregningsmodellen for poeng bruker en kombinasjon av den totale økningen i antall offentliggjorte eiere, endringer i porteføljeallokeringen til disse eierne og andre beregninger. Tallet går fra 0 til 100, der høyere tall indikerer en høyere grad av akkumulering i forhold til sammenlignbare selskaper, der 50 er gjennomsnittet.
Oppdateringsfrekvens: Daglig
Sjekk ut Ownership Explorer, som inneholder en liste over de høyest rangerte selskapene.
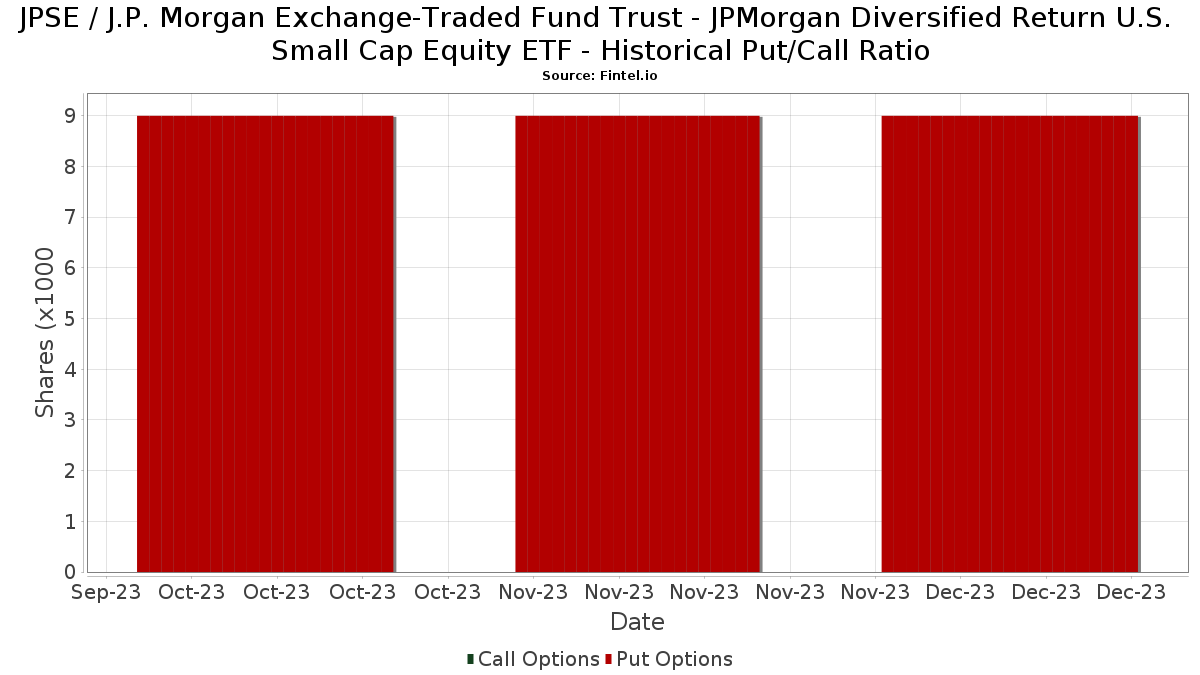
Institusjonell Put/Call-forhold
I tillegg til å rapportere standard aksje- og gjeldsemisjoner må institusjoner med mer enn 100 millioner kroner i forvaltningskapital også oppgi beholdningen av put- og callopsjoner. Siden put-opsjoner generelt indikerer et negativt sentiment, og call-opsjoner indikerer et positivt sentiment, kan vi få et inntrykk av det generelle institusjonelle sentimentet ved å plotte forholdet mellom put- og call-opsjoner. Diagrammet til høyre viser det historiske forholdet mellom put- og call-opsjoner for dette instrumentet.
Ved å bruke Put/Call-forholdet som en indikator på investorsentimentet kan man overvinne en av de viktigste svakhetene ved å bruke totalt institusjonelt eierskap, nemlig at en betydelig andel av forvaltningskapitalen investeres passivt for å følge indekser. Passivt forvaltede fond kjøper vanligvis ikke opsjoner, slik at indikatoren for put/call-forhold i større grad gjenspeiler stemningen i aktivt forvaltede fond.
13F- og NPORT-arkiveringer
Detaljer om 13F-arkiveringer er gratis. Detaljer om NP-arkiveringer krever et premium-medlemskap. Grønne rader indikerer nye posisjoner. Røde rader indikerer lukkede posisjoner. Klikk på lenke ikonet for å se hele transaksjonshistorikken.
Oppgrader
for å låse opp premiedata og eksportere til Excel. ![]() .
.
| Fildato | Kilde | Investor | Type | Gjennomsnittlig pris (estimert) |
Aksjer | Δ Aksjer (%) |
Rapportert verdi ($1000) | Verdi (%) | Portallokering (%) | |
|---|---|---|---|---|---|---|---|---|---|---|
| 2025-05-09 | 13F | GeoWealth Management, LLC | 0 | −100,00 | 0 | −100,00 | ||||
| 2025-07-25 | 13F | Cwm, Llc | 1 234 | −41,46 | 0 | |||||
| 2025-07-29 | 13F | Stephens Inc /ar/ | 8 112 | 0,38 | 369 | 4,55 | ||||
| 2025-08-14 | 13F | Gerber Kawasaki Wealth & Investment Management | 188 962 | 1,78 | 8 596 | 6,22 | ||||
| 2025-07-08 | 13F | Gallacher Capital Management LLC | 15 973 | −2,01 | 727 | 2,25 | ||||
| 2025-08-01 | 13F | Rossby Financial, LCC | 96 | 17,07 | 4 | 33,33 | ||||
| 2025-08-06 | 13F | AE Wealth Management LLC | 232 | 0,00 | 11 | 0,00 | ||||
| 2025-08-12 | 13F | Jpmorgan Chase & Co | 27 229 | −4,31 | 1 239 | −0,16 | ||||
| 2025-08-12 | 13F | J.w. Cole Advisors, Inc. | 16 188 | 736 | ||||||
| 2025-08-06 | 13F | Centerpoint Advisory Group | 5 866 | −10,44 | 267 | −6,67 | ||||
| 2025-07-29 | NP | EBI - Longview Advantage ETF | 0 | −100,00 | 0 | −100,00 | ||||
| 2025-07-22 | 13F | Appleton Partners Inc/ma | 182 143 | −0,08 | 8 | 14,29 | ||||
| 2025-07-22 | 13F | DAVENPORT & Co LLC | 108 166 | 7,51 | 4 920 | 12,20 | ||||
| 2025-08-08 | 13F | Intrua Financial, LLC | 5 498 | 0,00 | 250 | 4,60 | ||||
| 2025-08-13 | 13F | Northwestern Mutual Wealth Management Co | 190 340 | 16,22 | 8 658 | 21,29 | ||||
| 2025-08-14 | 13F | Integrated Wealth Concepts LLC | 61 460 | −4,89 | 2 796 | −0,75 | ||||
| 2025-08-07 | 13F | Everhart Financial Group, Inc. | 0 | −100,00 | 0 | |||||
| 2025-07-21 | 13F | Ameriflex Group, Inc. | 941 | 43 | ||||||
| 2025-07-25 | 13F | Atria Wealth Solutions, Inc. | 5 133 | −77,08 | 233 | −76,13 | ||||
| 2025-07-30 | 13F | Paul Damon & Associates, Inc. | 50 328 | 5,02 | 2 289 | 9,57 | ||||
| 2025-08-12 | 13F | O'shaughnessy Asset Management, Llc | 1 | 0,00 | 0 | |||||
| 2025-07-24 | 13F | Us Bancorp \de\ | 1 175 | 0,00 | 53 | 3,92 | ||||
| 2025-08-14 | 13F | Fmr Llc | 1 046 | −19,72 | 48 | −16,07 | ||||
| 2025-07-14 | 13F | AdvisorNet Financial, Inc | 65 | 0,00 | 3 | 0,00 | ||||
| 2025-07-30 | 13F | Nottingham Advisors, Inc. | 11 034 | 0,00 | 502 | 4,38 | ||||
| 2025-07-17 | 13F | LexAurum Advisors, LLC | 45 552 | 66,22 | 2 072 | 73,53 | ||||
| 2025-08-14 | 13F | Keystone Financial Services, LLC | 150 714 | 5,27 | 6 856 | 9,86 | ||||
| 2025-08-14 | 13F | UBS Group AG | 436 | 0,00 | 20 | 0,00 | ||||
| 2025-08-15 | 13F | Morgan Stanley | 263 455 | −6,33 | 11 984 | −2,25 | ||||
| 2025-07-30 | 13F/A | KPP Advisory Services LLC | 8 961 | −3,86 | 408 | 0,25 | ||||
| 2025-05-16 | 13F | Coppell Advisory Solutions LLC | 0 | −100,00 | 0 | |||||
| 2025-08-12 | 13F | Proequities, Inc. | 0 | 0 | ||||||
| 2025-07-29 | 13F | Goldstein Advisors, LLC | 242 683 | 0,02 | 11 039 | 4,38 | ||||
| 2025-08-14 | 13F | Mariner, LLC | 6 286 | 7,56 | 286 | 12,20 | ||||
| 2025-07-29 | 13F | Interactive Financial Advisors | 16 507 | −0,93 | 751 | 3,31 | ||||
| 2025-08-18 | 13F | N.E.W. Advisory Services LLC | 349 | −96,51 | 16 | −96,55 | ||||
| 2025-07-16 | 13F | Signaturefd, Llc | 130 | 0,00 | 6 | 0,00 | ||||
| 2025-08-14 | 13F | LWM Advisory Services, LLC | 21 972 | 0,45 | 1 000 | 4,83 | ||||
| 2025-04-22 | 13F | Synergy Financial Management, LLC | 0 | −100,00 | 0 | |||||
| 2025-08-08 | 13F | Kingsview Wealth Management, LLC | 104 901 | 22,12 | 4 772 | 27,43 | ||||
| 2025-07-28 | 13F | Sagespring Wealth Partners, Llc | 5 444 | −1,27 | 248 | 2,92 | ||||
| 2025-08-08 | 13F | Beck Bode, LLC | 5 103 | −31,37 | 232 | −28,40 | ||||
| 2025-07-17 | 13F | Fifth Third Securities, Inc. | 33 819 | 13,71 | 1 538 | 18,67 | ||||
| 2025-08-14 | 13F | Ameriprise Financial Inc | 130 614 | 3,86 | 5 945 | 8,60 | ||||
| 2025-08-11 | 13F | Aptus Capital Advisors, LLC | 417 | 0,24 | 19 | 0,00 | ||||
| 2025-08-14 | 13F | Wells Fargo & Company/mn | 20 | 1 | ||||||
| 2025-08-04 | 13F | Pinnacle Associates Ltd | 8 859 | 0,00 | 403 | 4,15 | ||||
| 2025-08-08 | 13F | Thoroughbred Financial Services, Llc | 6 263 | −7,41 | 0 | |||||
| 2025-08-11 | 13F | Principal Securities, Inc. | 103 | −63,48 | 5 | −69,23 | ||||
| 2025-08-14 | 13F | Mercer Global Advisors Inc /adv | 14 241 | −16,13 | 648 | −12,57 | ||||
| 2025-08-14 | 13F | Comerica Bank | 0 | −100,00 | 0 | |||||
| 2025-08-14 | 13F | Bank Of America Corp /de/ | 571 912 | 1,37 | 26 015 | 5,78 | ||||
| 2025-08-12 | 13F | LPL Financial LLC | 832 355 | 28,86 | 37 862 | 34,47 | ||||
| 2025-09-04 | 13F/A | Advisor Group Holdings, Inc. | 53 301 | 4,25 | 2 424 | 8,80 | ||||
| 2025-08-14 | 13F | GWM Advisors LLC | 22 601 | −2,83 | 1 028 | 1,48 | ||||
| 2025-08-01 | 13F | Envestnet Asset Management Inc | 121 567 | −4,24 | 5 530 | −0,07 | ||||
| 2025-08-14 | 13F | Susquehanna International Group, Llp | 34 391 | −10,49 | 1 564 | −6,57 | ||||
| 2025-08-12 | 13F | Steward Partners Investment Advisory, Llc | 201 | 336,96 | 9 | 350,00 | ||||
| 2025-08-08 | 13F | Emerald Investment Partners, Llc | 32 | 0,00 | 1 | 0,00 | ||||
| 2025-07-17 | 13F | KWB Wealth | 26 623 | 3,76 | 1 160 | −3,41 | ||||
| 2025-08-08 | 13F | Cetera Investment Advisers | 51 050 | 7,75 | 2 322 | 12,45 | ||||
| 2025-08-15 | 13F | Kestra Advisory Services, LLC | 9 926 | −46,05 | 452 | −43,77 | ||||
| 2025-05-15 | 13F | Two Sigma Investments, Lp | 0 | −100,00 | 0 | |||||
| 2025-08-12 | 13F | Wayfinding Financial, LLC | 0 | −100,00 | 0 | |||||
| 2025-08-14 | 13F | Mml Investors Services, Llc | 36 179 | 10,68 | 2 | 0,00 | ||||
| 2025-07-25 | 13F | Hazlett, Burt & Watson, Inc. | 11 | 0,00 | 0 | |||||
| 2025-08-12 | 13F | Financial Advocates Investment Management | 95 024 | −32,42 | 4 322 | −29,48 | ||||
| 2025-08-12 | 13F | Global Retirement Partners, LLC | 0 | −100,00 | 0 | |||||
| 2025-08-11 | 13F | Bell Investment Advisors, Inc | 253 | −31,25 | 12 | −31,25 | ||||
| 2025-07-17 | 13F | Beacon Capital Management, LLC | 23 | 1 | ||||||
| 2025-08-13 | 13F | Capital Advisors Wealth Management, LLC | 90 974 | −79,74 | 4 138 | −78,86 | ||||
| 2025-07-29 | 13F | Stratos Wealth Partners, LTD. | 8 876 | −40,25 | 404 | −37,71 | ||||
| 2025-08-06 | 13F | ZEGA Investments, LLC | 0 | −100,00 | 0 | |||||
| 2025-08-07 | 13F | Pinnacle Wealth Management Advisory Group, LLC | 8 859 | 0,00 | 403 | 4,15 | ||||
| 2025-08-13 | 13F | Jones Financial Companies Lllp | 82 138 | 9,13 | 3 736 | 14,22 | ||||
| 2025-08-14 | 13F | Stifel Financial Corp | 223 080 | 4,31 | 10 147 | 8,85 | ||||
| 2025-08-07 | 13F | Kestra Private Wealth Services, Llc | 6 781 | −4,48 | 308 | −0,32 | ||||
| 2025-07-31 | 13F | Oak Harbor Wealth Partners, Llc | 19 370 | 57,85 | 881 | 64,98 | ||||
| 2025-08-11 | 13F | HighTower Advisors, LLC | 9 737 | 99,82 | 443 | 108,49 | ||||
| 2025-07-31 | 13F | Hartford Financial Management Inc. | 315 333 | 97,68 | 14 344 | 106,29 | ||||
| 2025-08-05 | 13F | Bank Of Montreal /can/ | 111 | 5 | ||||||
| 2025-08-06 | 13F | Prospera Financial Services Inc | 7 441 | −4,07 | 339 | 0,00 | ||||
| 2025-07-11 | 13F | Farther Finance Advisors, LLC | 3 | −98,45 | 0 | −100,00 | ||||
| 2025-07-10 | 13F | Wealth Enhancement Advisory Services, Llc | 6 202 | −2,96 | 291 | 4,68 | ||||
| 2025-04-22 | 13F | Hill Island Financial Llc | 0 | −100,00 | 0 | |||||
| 2025-08-12 | 13F | Tocqueville Asset Management L.p. | 156 068 | −0,91 | 7 099 | 3,41 | ||||
| 2025-08-11 | 13F | Nations Financial Group Inc, /ia/ /adv | 5 787 | −17,16 | 263 | −13,49 | ||||
| 2025-07-31 | 13F | Cambridge Investment Research Advisors, Inc. | 23 663 | −9,59 | 1 | 0,00 | ||||
| 2025-07-24 | 13F | IFP Advisors, Inc | 413 | −2,13 | 19 | 0,00 | ||||
| 2025-08-14 | 13F | Stonehaven Wealth & Tax Solutions, Llc | 41 146 | 5,02 | 1 872 | 9,61 | ||||
| 2025-07-18 | 13F | First Pacific Financial | 73 466 | 1,89 | 3 342 | 6,30 | ||||
| 2025-08-06 | 13F | Ipsen Advisor Group LLC | 111 067 | 3,85 | 5 052 | 8,39 | ||||
| 2025-08-04 | 13F | Hantz Financial Services, Inc. | 3 | 0,00 | 0 | |||||
| 2025-07-11 | 13F | Sprinkle Financial Consultants LLC | 126 612 | −4,49 | 5 760 | −0,33 | ||||
| 2025-07-08 | 13F | Choice Wealth Advisors, LLC | 0 | −100,00 | 0 | |||||
| 2025-08-01 | 13F | Mendel Money Management | 9 961 | 5,18 | 453 | 9,95 | ||||
| 2025-08-14 | 13F | Redwood Financial Network Corp | 14 131 | −2,79 | 643 | 1,42 | ||||
| 2025-08-01 | 13F | Schmidt P J Investment Management Inc | 23 697 | 3,94 | 1 078 | 8,46 | ||||
| 2025-07-17 | 13F | Albion Financial Group /ut | 1 573 | −47,64 | 72 | −45,38 | ||||
| 2025-08-01 | 13F | Koss-Olinger Consulting, LLC | 1 248 672 | −1,53 | 56 800 | 2,76 | ||||
| 2025-08-14 | 13F | Financial Engines Advisors L.L.C. | 26 460 | 1 204 | ||||||
| 2025-04-16 | 13F | Salem Investment Counselors Inc | 0 | −100,00 | 0 | |||||
| 2025-07-07 | 13F | Teamwork Financial Advisors, LLC | 5 253 | −74,36 | 239 | −73,35 | ||||
| 2025-08-06 | 13F | Golden State Wealth Management, LLC | 0 | −100,00 | 0 | |||||
| 2025-05-02 | 13F | Transcendent Capital Group LLC | 0 | −100,00 | 0 | |||||
| 2025-08-06 | 13F | Commonwealth Equity Services, Llc | 70 919 | 35,07 | 3 | 50,00 | ||||
| 2025-08-14 | 13F | Raymond James Financial Inc | 796 316 | −39,76 | 36 223 | −37,14 | ||||
| 2025-08-12 | 13F | Cornerstone Wealth Management, LLC | 28 835 | 6,43 | 1 312 | 11,01 | ||||
| 2025-08-14 | 13F | Citadel Advisors Llc | 11 810 | −70,16 | 537 | −68,87 | ||||
| 2025-08-04 | 13F | Creative Financial Designs Inc /adv | 54 | 0,00 | 2 | 0,00 | ||||
| 2025-08-08 | 13F | Gts Securities Llc | 18 972 | 0,00 | 863 | 4,36 | ||||
| 2025-04-25 | 13F | Smallwood Wealth Investment Management, LLC | 226 | 10 | ||||||
| 2025-08-05 | 13F | Aviance Capital Partners, LLC | 7 113 | 0,00 | 324 | 4,19 | ||||
| 2025-08-14 | 13F | Colony Group, LLC | 7 635 | −10,80 | 347 | −6,97 | ||||
| 2025-08-14 | 13F | Royal Bank Of Canada | 316 645 | −31,34 | 14 404 | −28,35 | ||||
| 2025-07-29 | 13F | Private Trust Co Na | 1 101 | 0,00 | 50 | 6,38 |