Grunnleggende statistikk
| Institusjonelle eiere | 108 total, 108 long only, 0 short only, 0 long/short - change of 2,86% MRQ |
| Gjennomsnittlig porteføljeallokering | 0.4854 % - change of 28,67% MRQ |
| Institusjonelle aksjer (Long) | 11 945 245 (ex 13D/G) - change of 2,17MM shares 22,24% MRQ |
| Institusjonell verdi (Long) | $ 677 220 USD ($1000) |
Institusjonelt eierskap og aksjonærer
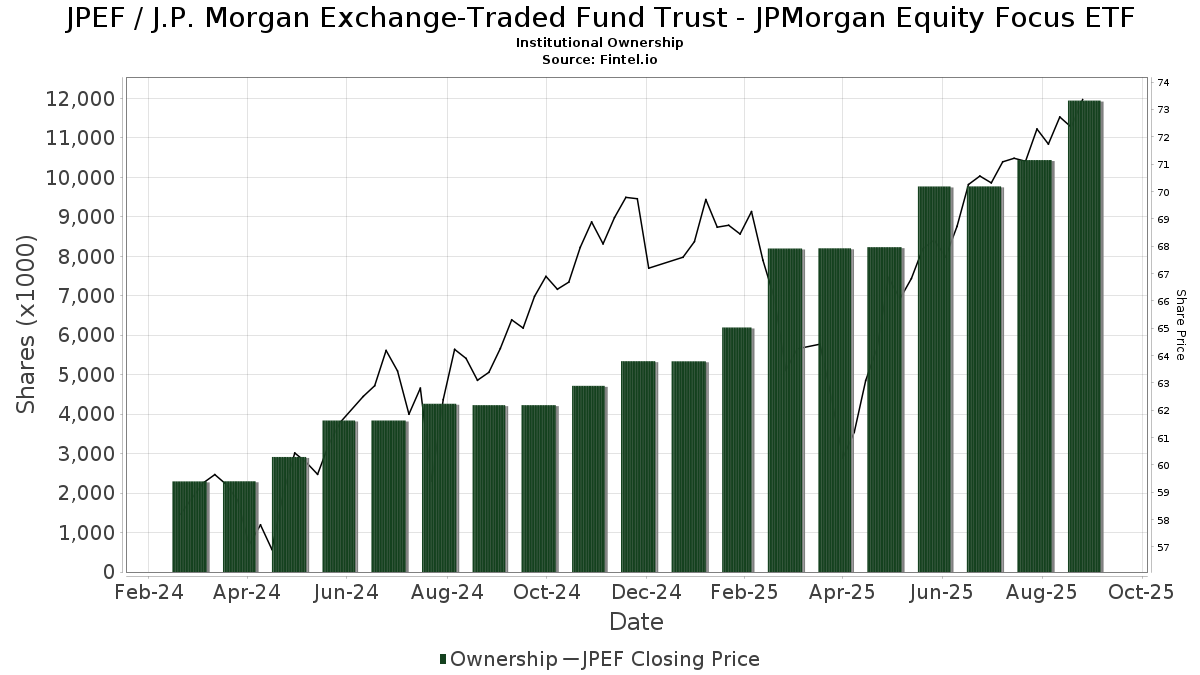
J.P. Morgan Exchange-Traded Fund Trust - JPMorgan Equity Focus ETF (US:JPEF) har 108 institusjonelle eiere og aksjonærer som har sendt inn 13D/G- eller 13F-skjemaer til Securities Exchange Commission (SEC). Disse institusjonene eier til sammen 11,945,245 aksjer. De største aksjonærene inkluderer Raymond James Financial Inc, LPL Financial LLC, Mml Investors Services, Llc, Beaumont Financial Advisors, LLC, Advisor Group Holdings, Inc., Commonwealth Equity Services, Llc, Investment Planning Advisors, Inc., Jones Financial Companies Lllp, Cetera Investment Advisers, and Balance Wealth, LLC .
J.P. Morgan Exchange-Traded Fund Trust - JPMorgan Equity Focus ETF (NasdaqGM:JPEF) institusjonell eierstruktur viser nåværende posisjoner i selskapet fordelt på institusjoner og fond, samt de siste endringene i posisjonsstørrelse. De største aksjonærene kan være individuelle investorer, verdipapirfond, hedgefond eller institusjoner. Schedule 13D indikerer at investoren eier (eller har eid) mer enn 5 % av selskapet og har til hensikt (eller hadde til hensikt) å aktivt forfølge en endring i forretningsstrategien. Schedule 13G indikerer en passiv investering på over 5 %.
The share price as of September 10, 2025 is 73,36 / share. Previously, on September 11, 2024, the share price was 63,38 / share. This represents an increase of 15,75% over that period.
Fondssentiment-score
Fondssentiment Score (også kjent som akkumulering av eierskap poengsum) viser hvilke aksjer som er mest kjøpt av fond. Den er resultatet av en sofistikert, kvantitativ flerfaktormodell som identifiserer selskaper med de høyeste nivåene av institusjonell akkumulering. Beregningsmodellen for poeng bruker en kombinasjon av den totale økningen i antall offentliggjorte eiere, endringer i porteføljeallokeringen til disse eierne og andre beregninger. Tallet går fra 0 til 100, der høyere tall indikerer en høyere grad av akkumulering i forhold til sammenlignbare selskaper, der 50 er gjennomsnittet.
Oppdateringsfrekvens: Daglig
Sjekk ut Ownership Explorer, som inneholder en liste over de høyest rangerte selskapene.
Institusjonell Put/Call-forhold
I tillegg til å rapportere standard aksje- og gjeldsemisjoner må institusjoner med mer enn 100 millioner kroner i forvaltningskapital også oppgi beholdningen av put- og callopsjoner. Siden put-opsjoner generelt indikerer et negativt sentiment, og call-opsjoner indikerer et positivt sentiment, kan vi få et inntrykk av det generelle institusjonelle sentimentet ved å plotte forholdet mellom put- og call-opsjoner. Diagrammet til høyre viser det historiske forholdet mellom put- og call-opsjoner for dette instrumentet.
Ved å bruke Put/Call-forholdet som en indikator på investorsentimentet kan man overvinne en av de viktigste svakhetene ved å bruke totalt institusjonelt eierskap, nemlig at en betydelig andel av forvaltningskapitalen investeres passivt for å følge indekser. Passivt forvaltede fond kjøper vanligvis ikke opsjoner, slik at indikatoren for put/call-forhold i større grad gjenspeiler stemningen i aktivt forvaltede fond.
13F- og NPORT-arkiveringer
Detaljer om 13F-arkiveringer er gratis. Detaljer om NP-arkiveringer krever et premium-medlemskap. Grønne rader indikerer nye posisjoner. Røde rader indikerer lukkede posisjoner. Klikk på lenke ikonet for å se hele transaksjonshistorikken.
Oppgrader
for å låse opp premiedata og eksportere til Excel. ![]() .
.
| Fildato | Kilde | Investor | Type | Gjennomsnittlig pris (estimert) |
Aksjer | Δ Aksjer (%) |
Rapportert verdi ($1000) | Verdi (%) | Portallokering (%) | |
|---|---|---|---|---|---|---|---|---|---|---|
| 2025-08-11 | 13F | Private Advisor Group, LLC | 10 436 | 18,42 | 732 | 30,30 | ||||
| 2025-07-07 | 13F | First Citizens Financial Corp | 8 110 | 0,00 | 569 | 10,08 | ||||
| 2025-07-15 | 13F | Cora Capital Advisors Llc | 6 024 | −51,10 | 423 | −46,17 | ||||
| 2025-08-12 | 13F | Eldridge Investment Advisors, Inc. | 0 | −100,00 | 0 | |||||
| 2025-07-24 | 13F | 3Chopt Investment Partners, LLC | 1 877 | 122,13 | 132 | 147,17 | ||||
| 2025-08-08 | 13F/A | Ignite Planners, LLC | 24 014 | −2,52 | 1 698 | 8,16 | ||||
| 2025-08-13 | 13F | Denver Wealth Management, Inc. | 4 883 | 0,00 | 342 | 10,32 | ||||
| 2025-04-14 | 13F | Strategic Wealth Designers | 0 | −100,00 | 0 | −100,00 | ||||
| 2025-07-17 | 13F | DiNuzzo Private Wealth, Inc. | 278 | 0,00 | 19 | 11,76 | ||||
| 2025-08-13 | 13F | Brown Advisory Inc | 7 349 | 0,00 | 515 | 10,28 | ||||
| 2025-08-05 | 13F | Atlas Private Wealth Advisors | 6 490 | 54,52 | 455 | 70,41 | ||||
| 2025-08-13 | 13F | Johnson Financial Group, Inc. | 56 | 0,00 | 4 | 0,00 | ||||
| 2025-05-15 | 13F | Qube Research & Technologies Ltd | 0 | −100,00 | 0 | |||||
| 2025-05-02 | 13F | Sigma Planning Corp | 0 | −100,00 | 0 | |||||
| 2025-08-05 | 13F | 5T Wealth, LLC | 8 959 | 628 | ||||||
| 2025-07-22 | 13F | DAVENPORT & Co LLC | 76 280 | 5,85 | 5 350 | 16,63 | ||||
| 2025-07-22 | 13F | BridgePort Financial Solutions, LLC | 78 776 | 212,23 | 5 525 | 244,02 | ||||
| 2025-07-31 | 13F | Cambridge Investment Research Advisors, Inc. | 36 008 | −13,06 | 3 | 0,00 | ||||
| 2025-08-14 | 13F | Fmr Llc | 41 | 0,00 | 3 | 0,00 | ||||
| 2025-07-28 | 13F | SFG Wealth Management, LLC. | 0 | −100,00 | 0 | |||||
| 2025-07-15 | 13F | Fifth Third Bancorp | 473 | 33 | ||||||
| 2025-08-13 | 13F | Northwestern Mutual Wealth Management Co | 69 335 | −16,37 | 4 863 | −7,85 | ||||
| 2025-07-25 | 13F | Concurrent Investment Advisors, LLC | 7 136 | 43,73 | 501 | 58,23 | ||||
| 2025-07-30 | 13F | Prosperity Financial Group, Inc. | 11 352 | 4,69 | 796 | 15,36 | ||||
| 2025-07-17 | 13F | Janney Montgomery Scott LLC | 253 545 | 15,37 | 18 | 30,77 | ||||
| 2025-08-06 | 13F | AE Wealth Management LLC | 67 | 0,00 | 5 | 0,00 | ||||
| 2025-07-16 | 13F | Morangie Management LLC | 15 020 | 1 054 | ||||||
| 2025-07-18 | 13F | Truist Financial Corp | 61 921 | −3,98 | 4 343 | 5,80 | ||||
| 2025-08-13 | 13F | Kayne Anderson Rudnick Investment Management Llc | 714 | 0,00 | 50 | 11,11 | ||||
| 2025-07-24 | 13F | Us Bancorp \de\ | 799 | 0,00 | 56 | 12,00 | ||||
| 2025-08-14 | 13F | Herold Advisors, Inc. | 15 315 | 14,36 | 1 074 | 26,06 | ||||
| 2025-07-24 | 13F | Capital Advisors, Ltd. LLC | 17 359 | 5,22 | 1 | 0,00 | ||||
| 2025-08-14 | 13F | Mercer Global Advisors Inc /adv | 4 759 | 334 | ||||||
| 2025-08-14 | 13F | Goldman Sachs Group Inc | 0 | −100,00 | 0 | |||||
| 2025-04-18 | 13F | Tennessee Valley Asset Management Partners | 0 | −100,00 | 0 | |||||
| 2025-08-12 | 13F/A | Cozad Asset Management Inc | 137 753 | 1,14 | 9 662 | 11,43 | ||||
| 2025-07-28 | 13F | Harbour Investments, Inc. | 4 021 | −13,10 | 282 | −4,08 | ||||
| 2025-08-08 | 13F | Kingsview Wealth Management, LLC | 57 043 | 11,76 | 4 001 | 23,15 | ||||
| 2025-08-12 | 13F | Proequities, Inc. | 0 | 0 | ||||||
| 2025-08-14 | 13F | Stifel Financial Corp | 39 283 | 7,32 | 2 755 | 18,24 | ||||
| 2025-08-14 | 13F | UBS Group AG | 1 189 | −18,45 | 83 | −9,78 | ||||
| 2025-08-12 | 13F | BlackRock, Inc. | 0 | −100,00 | 0 | |||||
| 2025-05-08 | 13F | Geneos Wealth Management Inc. | 0 | −100,00 | 0 | |||||
| 2025-08-14 | 13F | Mariner, LLC | 4 157 | −2,39 | 292 | 7,38 | ||||
| 2025-08-13 | 13F | Cary Street Partner Investment Advisory Llc | 24 | 2 | ||||||
| 2025-07-11 | 13F | Pinnacle Bancorp, Inc. | 270 | 19 | ||||||
| 2025-08-13 | 13F | Cary Street Partners Financial Llc | 49 536 | 1,84 | 3 474 | 12,21 | ||||
| 2025-08-14 | 13F | Jane Street Group, Llc | 9 373 | −68,22 | 657 | −65,00 | ||||
| 2025-08-18 | 13F | Tyler-Stone Wealth Management | 33 602 | 12,07 | 2 357 | 23,48 | ||||
| 2025-08-26 | 13F/A | Thrivent Financial For Lutherans | 322 194 | 23 | ||||||
| 2025-07-24 | 13F | Blair William & Co/il | 0 | −100,00 | 0 | |||||
| 2025-08-13 | 13F | Level Four Advisory Services, Llc | 169 821 | −1,24 | 11 911 | 8,82 | ||||
| 2025-07-17 | 13F | Fifth Third Securities, Inc. | 71 067 | −18,36 | 4 985 | −10,05 | ||||
| 2025-08-11 | 13F | Principal Securities, Inc. | 571 | 0,00 | 40 | 5,26 | ||||
| 2025-07-16 | 13F | Beaumont Financial Advisors, LLC | 699 354 | 102,15 | 49 053 | 122,72 | ||||
| 2025-08-12 | 13F | CIBC Private Wealth Group, LLC | 0 | −100,00 | 0 | |||||
| 2025-08-08 | 13F | Good Life Advisors, LLC | 34 844 | −26,92 | 2 444 | −19,51 | ||||
| 2025-08-12 | 13F | Jpmorgan Chase & Co | 69 703 | 33,08 | 4 889 | 46,61 | ||||
| 2025-07-30 | 13F | D.a. Davidson & Co. | 71 651 | 38,33 | 5 026 | 52,41 | ||||
| 2025-07-21 | 13F | Investment Planning Advisors, Inc. | 482 072 | 8,14 | 33 812 | 19,15 | ||||
| 2025-08-01 | 13F | Envestnet Asset Management Inc | 291 588 | −22,90 | 20 452 | −15,05 | ||||
| 2025-07-25 | 13F | Lodestar Private Asset Management Llc | 4 596 | −42,38 | 322 | −36,49 | ||||
| 2025-07-18 | 13F | Parsons Capital Management Inc/ri | 4 200 | 0,65 | 295 | 10,94 | ||||
| 2025-08-14 | 13F | Fort Point Capital Partners LLC | 15 387 | 3,16 | 1 079 | 13,70 | ||||
| 2025-08-14 | 13F | Empire Life Investments Inc. | 84 300 | −30,63 | 5 913 | −23,58 | ||||
| 2025-08-01 | 13F | Advisory Alpha, LLC | 4 553 | 21,80 | 319 | 34,60 | ||||
| 2025-05-15 | 13F | MAI Capital Management | 0 | −100,00 | 0 | |||||
| 2025-08-14 | 13F | Susquehanna International Group, Llp | 16 120 | 1 131 | ||||||
| 2025-08-08 | 13F | Cetera Investment Advisers | 334 092 | 22,74 | 23 433 | 35,24 | ||||
| 2025-07-17 | 13F | Leverty Financial Group, LLC | 285 994 | 20 059 | ||||||
| 2025-08-04 | 13F | Pensionmark Financial Group, Llc | 13 139 | 0,00 | 922 | 10,17 | ||||
| 2025-08-15 | 13F | Kestra Advisory Services, LLC | 91 885 | 25,35 | 6 445 | 38,11 | ||||
| 2025-07-25 | 13F | Hazlett, Burt & Watson, Inc. | 827 | 14,54 | 0 | |||||
| 2025-08-14 | 13F | Snowden Capital Advisors LLC | 6 943 | −16,77 | 487 | −8,29 | ||||
| 2025-07-22 | 13F | Wealthcare Advisory Partners LLC | 24 732 | 6,66 | 1 735 | 17,48 | ||||
| 2025-08-14 | 13F | Integrity Wealth Advisors, Inc. | 18 330 | 73,06 | 1 286 | 90,65 | ||||
| 2025-07-25 | 13F | SPC Financial, Inc. | 127 614 | 6,22 | 8 951 | 17,02 | ||||
| 2025-07-30 | 13F | Castle Wealth Management Llc | 74 549 | 3,78 | 5 229 | 14,35 | ||||
| 2025-08-13 | 13F | Capital Advisors Wealth Management, LLC | 9 292 | 6,93 | 652 | 17,72 | ||||
| 2025-08-15 | 13F | Resources Management Corp /ct/ /adv | 4 357 | 0 | ||||||
| 2025-05-15 | 13F | Old Mission Capital Llc | 0 | −100,00 | 0 | |||||
| 2025-08-14 | 13F | Citadel Advisors Llc | 0 | −100,00 | 0 | |||||
| 2025-07-22 | 13F | MBL Wealth, LLC | 70 565 | 80,94 | 4 949 | 99,40 | ||||
| 2025-07-29 | 13F | Stratos Wealth Partners, LTD. | 314 949 | 3,16 | 22 091 | 13,66 | ||||
| 2025-08-04 | 13F | WNY Asset Management, LLC | 6 079 | −1,68 | 426 | 8,40 | ||||
| 2025-08-13 | 13F | Continuum Advisory, LLC | 0 | −100,00 | 0 | |||||
| 2025-08-07 | 13F | Flagship Wealth Advisors, Llc | 37 652 | 0,35 | 2 641 | 10,55 | ||||
| 2025-08-14 | 13F | Mml Investors Services, Llc | 1 076 371 | 7,62 | 75 | 19,05 | ||||
| 2025-08-14 | 13F | Royal Bank Of Canada | 163 896 | −3,26 | 11 495 | 6,57 | ||||
| 2025-08-14 | 13F | Comerica Bank | 1 869 | 3,43 | 131 | 13,91 | ||||
| 2025-08-07 | 13F | Kestra Private Wealth Services, Llc | 3 459 | 243 | ||||||
| 2025-08-15 | 13F | Captrust Financial Advisors | 4 064 | 8,78 | 285 | 20,25 | ||||
| 2025-08-15 | 13F | Equitable Holdings, Inc. | 40 273 | −8,57 | 2 825 | 0,75 | ||||
| 2025-08-14 | 13F | Modern Wealth Management, LLC | 6 907 | 0,00 | 484 | 10,25 | ||||
| 2025-08-15 | 13F | Tower Research Capital LLC (TRC) | 0 | −100,00 | 0 | |||||
| 2025-08-13 | 13F | Jones Financial Companies Lllp | 367 880 | 58,14 | 25 689 | 74,60 | ||||
| 2025-08-06 | 13F | Csenge Advisory Group | 8 620 | 0,00 | 578 | 11,18 | ||||
| 2025-08-12 | 13F | Global Retirement Partners, LLC | 1 046 | −6,86 | 73 | −2,67 | ||||
| 2025-08-04 | 13F | Hantz Financial Services, Inc. | 0 | −100,00 | 0 | |||||
| 2025-08-07 | 13F | Resources Investment Advisors, LLC. | 8 008 | 4,01 | 562 | 14,49 | ||||
| 2025-07-24 | 13F | IFP Advisors, Inc | 70 280 | −20,27 | 4 929 | −12,15 | ||||
| 2025-08-05 | 13F | Crestwood Advisors Group LLC | 44 743 | 14,86 | 3 138 | 26,58 | ||||
| 2025-07-23 | 13F | Gentry Private Wealth, Llc | 3 299 | 0,00 | 231 | 10,00 | ||||
| 2025-07-29 | 13F | Private Trust Co Na | 1 994 | 0,00 | 140 | 10,32 | ||||
| 2025-07-23 | 13F | Kingswood Wealth Advisors, Llc | 4 747 | −28,15 | 333 | −20,95 | ||||
| 2025-08-15 | 13F | Morgan Stanley | 35 | 0,00 | 2 | 0,00 | ||||
| 2025-07-16 | 13F | Novem Group | 184 183 | 2,15 | 12 919 | 12,56 | ||||
| 2025-04-21 | 13F | Institute for Wealth Management, LLC. | 0 | −100,00 | 0 | |||||
| 2025-08-06 | 13F | Carnegie Lake Advisors LLC | 3 775 | 0,00 | 0 | |||||
| 2025-08-08 | 13F | Avantax Advisory Services, Inc. | 236 329 | 5,20 | 16 576 | 15,91 | ||||
| 2025-09-04 | 13F/A | Advisor Group Holdings, Inc. | 558 669 | 29,05 | 39 186 | 42,17 | ||||
| 2025-07-25 | 13F | Cwm, Llc | 3 132 | −20,00 | 0 | |||||
| 2025-08-06 | 13F | Commonwealth Equity Services, Llc | 532 493 | 9,26 | 37 | 19,35 | ||||
| 2025-08-14 | 13F | Raymond James Financial Inc | 1 958 565 | 9,82 | 137 374 | 21,00 | ||||
| 2025-08-13 | 13F | MONECO Advisors, LLC | 227 618 | 9,70 | 15 965 | 20,87 | ||||
| 2025-08-08 | 13F | Thoroughbred Financial Services, Llc | 39 719 | −21,02 | 3 | −33,33 | ||||
| 2025-07-16 | 13F | St Germain D J Co Inc | 2 836 | 0,00 | 199 | 10,00 | ||||
| 2025-08-14 | 13F | Vienna Asset Management LLC | 5 222 | −91,30 | 366 | −90,42 | ||||
| 2025-08-14 | 13F | Financial Network Wealth Advisors LLC | 502 | 0,00 | 35 | 12,90 | ||||
| 2025-07-11 | 13F | Farther Finance Advisors, LLC | 787 | 55 | ||||||
| 2025-08-13 | 13F | Balance Wealth, LLC | 326 863 | 103,69 | 22 926 | 124,43 | ||||
| 2025-07-14 | 13F | Southland Equity Partners LLC | 7 187 | 112,19 | 504 | 134,42 | ||||
| 2025-07-10 | 13F | Wealth Enhancement Advisory Services, Llc | 7 344 | 15,60 | 520 | 28,71 | ||||
| 2025-07-16 | 13F | Essex Financial Services, Inc. | 4 973 | 349 | ||||||
| 2025-07-18 | 13F | Bridge Generations Wealth Management Llc | 13 | 0,00 | 1 | |||||
| 2025-08-12 | 13F | Steward Partners Investment Advisory, Llc | 15 764 | 286,28 | 1 106 | 326,64 | ||||
| 2025-08-12 | 13F | LPL Financial LLC | 1 195 133 | 61,18 | 83 827 | 77,59 |