Grunnleggende statistikk
| Institusjonelle eiere | 156 total, 156 long only, 0 short only, 0 long/short - change of −1,88% MRQ |
| Gjennomsnittlig porteføljeallokering | 0.5596 % - change of 1,74% MRQ |
| Institusjonelle aksjer (Long) | 33 765 008 (ex 13D/G) - change of 0,70MM shares 2,11% MRQ |
| Institusjonell verdi (Long) | $ 1 936 185 USD ($1000) |
Institusjonelt eierskap og aksjonærer
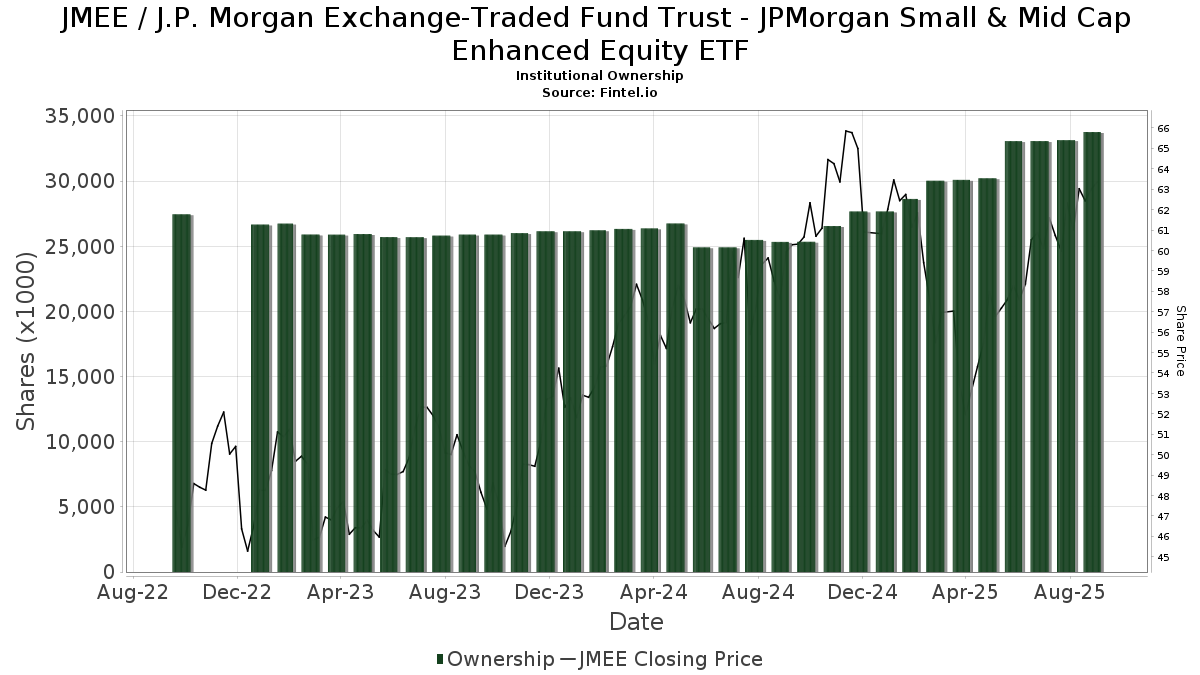
J.P. Morgan Exchange-Traded Fund Trust - JPMorgan Small & Mid Cap Enhanced Equity ETF (US:JMEE) har 156 institusjonelle eiere og aksjonærer som har sendt inn 13D/G- eller 13F-skjemaer til Securities Exchange Commission (SEC). Disse institusjonene eier til sammen 33,765,008 aksjer. De største aksjonærene inkluderer Jpmorgan Chase & Co, ONIFX - JPMorgan Investor Growth Fund Class I, ONGFX - JPMorgan Investor Growth & Income Fund Class I, OIBFX - JPMorgan Investor Balanced Fund Class I, LPL Financial LLC, Crestwood Advisors Group LLC, Great Valley Advisor Group, Inc., Syntegra Private Wealth Group, LLC, ONCFX - JPMorgan Investor Conservative Growth Fund Class I, and Advisor Group Holdings, Inc. .
J.P. Morgan Exchange-Traded Fund Trust - JPMorgan Small & Mid Cap Enhanced Equity ETF (ARCA:JMEE) institusjonell eierstruktur viser nåværende posisjoner i selskapet fordelt på institusjoner og fond, samt de siste endringene i posisjonsstørrelse. De største aksjonærene kan være individuelle investorer, verdipapirfond, hedgefond eller institusjoner. Schedule 13D indikerer at investoren eier (eller har eid) mer enn 5 % av selskapet og har til hensikt (eller hadde til hensikt) å aktivt forfølge en endring i forretningsstrategien. Schedule 13G indikerer en passiv investering på over 5 %.
The share price as of September 10, 2025 is 62,99 / share. Previously, on September 11, 2024, the share price was 57,62 / share. This represents an increase of 9,32% over that period.
Fondssentiment-score
Fondssentiment Score (også kjent som akkumulering av eierskap poengsum) viser hvilke aksjer som er mest kjøpt av fond. Den er resultatet av en sofistikert, kvantitativ flerfaktormodell som identifiserer selskaper med de høyeste nivåene av institusjonell akkumulering. Beregningsmodellen for poeng bruker en kombinasjon av den totale økningen i antall offentliggjorte eiere, endringer i porteføljeallokeringen til disse eierne og andre beregninger. Tallet går fra 0 til 100, der høyere tall indikerer en høyere grad av akkumulering i forhold til sammenlignbare selskaper, der 50 er gjennomsnittet.
Oppdateringsfrekvens: Daglig
Sjekk ut Ownership Explorer, som inneholder en liste over de høyest rangerte selskapene.
Institusjonell Put/Call-forhold
I tillegg til å rapportere standard aksje- og gjeldsemisjoner må institusjoner med mer enn 100 millioner kroner i forvaltningskapital også oppgi beholdningen av put- og callopsjoner. Siden put-opsjoner generelt indikerer et negativt sentiment, og call-opsjoner indikerer et positivt sentiment, kan vi få et inntrykk av det generelle institusjonelle sentimentet ved å plotte forholdet mellom put- og call-opsjoner. Diagrammet til høyre viser det historiske forholdet mellom put- og call-opsjoner for dette instrumentet.
Ved å bruke Put/Call-forholdet som en indikator på investorsentimentet kan man overvinne en av de viktigste svakhetene ved å bruke totalt institusjonelt eierskap, nemlig at en betydelig andel av forvaltningskapitalen investeres passivt for å følge indekser. Passivt forvaltede fond kjøper vanligvis ikke opsjoner, slik at indikatoren for put/call-forhold i større grad gjenspeiler stemningen i aktivt forvaltede fond.
13F- og NPORT-arkiveringer
Detaljer om 13F-arkiveringer er gratis. Detaljer om NP-arkiveringer krever et premium-medlemskap. Grønne rader indikerer nye posisjoner. Røde rader indikerer lukkede posisjoner. Klikk på lenke ikonet for å se hele transaksjonshistorikken.
Oppgrader
for å låse opp premiedata og eksportere til Excel. ![]() .
.
| Fildato | Kilde | Investor | Type | Gjennomsnittlig pris (estimert) |
Aksjer | Δ Aksjer (%) |
Rapportert verdi ($1000) | Verdi (%) | Portallokering (%) | |
|---|---|---|---|---|---|---|---|---|---|---|
| 2025-07-08 | 13F | Choice Wealth Advisors, LLC | 156 587 | 1,72 | 9 272 | 7,59 | ||||
| 2025-08-11 | 13F | Principal Securities, Inc. | 324 | −50,08 | 19 | −51,28 | ||||
| 2025-08-12 | 13F/A | Cozad Asset Management Inc | 8 228 | −28,81 | 487 | −24,73 | ||||
| 2025-07-28 | 13F | Nestegg Advisors, Inc. | 3 870 | 0,00 | 229 | 6,02 | ||||
| 2025-07-07 | 13F | Global Wealth Strategies & Associates | 0 | −100,00 | 0 | |||||
| 2025-07-28 | 13F | Private Wealth Asset Management, LLC | 238 | 14 | ||||||
| 2025-08-26 | NP | EVCLX - The E-Valuator Conservative (15%-30%) RMS Fund Service Class Shares | 2 534 | −50,16 | 150 | −47,18 | ||||
| 2025-07-14 | 13F | Farmers & Merchants Investments Inc | 1 | 0,00 | 0 | |||||
| 2025-08-14 | 13F | Benjamin Edwards Inc | 13 699 | 0,76 | 811 | 6,57 | ||||
| 2025-08-26 | NP | EVTTX - The E-Valuator Conservative/Moderate (30%-50%) RMS Fund Service Class Shares | 2 747 | −47,47 | 163 | −44,52 | ||||
| 2025-08-12 | 13F | Tradition Wealth Management, LLC | 98 232 | 10,61 | 5 816 | 17,00 | ||||
| 2025-07-10 | 13F | Stewardship Advisors, LLC | 74 076 | 0,95 | 4 386 | 6,79 | ||||
| 2025-07-22 | 13F | Siligmueller & Norvid Wealth Advisors LLC | 19 165 | −15,94 | 1 152 | −9,72 | ||||
| 2025-08-14 | 13F | Sunbelt Securities, Inc. | 41 | 0,00 | 2 | 0,00 | ||||
| 2025-08-04 | 13F | IFG Advisory, LLC | 11 741 | 8,93 | 695 | 15,26 | ||||
| 2025-08-12 | 13F | Jpmorgan Chase & Co | 10 512 654 | 0,10 | 622 454 | 5,88 | ||||
| 2025-08-14 | 13F | D. E. Shaw & Co., Inc. | 3 489 | −61,68 | 207 | −59,53 | ||||
| 2025-07-09 | 13F | Fermata Advisors, LLC | 21 297 | −16,94 | 1 261 | −12,20 | ||||
| 2025-07-15 | 13F | Avaii Wealth Management, Llc | 7 283 | 431 | ||||||
| 2025-08-14 | 13F | Comerica Bank | 1 043 | −52,66 | 62 | −50,41 | ||||
| 2025-08-07 | 13F | Verus Capital Partners, Llc | 132 146 | −6,75 | 7 824 | −1,36 | ||||
| 2025-08-26 | NP | ONIFX - JPMorgan Investor Growth Fund Class I | 4 247 206 | 0,00 | 251 477 | 5,77 | ||||
| 2025-07-10 | 13F | Redhawk Wealth Advisors, Inc. | 0 | −100,00 | 0 | |||||
| 2025-07-11 | 13F | Bond & Devick Financial Network, Inc. | 154 248 | 6,32 | 9 133 | 12,46 | ||||
| 2025-08-15 | 13F | Asset Allocation Strategies LLC | 24 162 | −19,59 | 1 431 | −14,98 | ||||
| 2025-08-26 | NP | ONGFX - JPMorgan Investor Growth & Income Fund Class I | 2 895 844 | 0,00 | 171 463 | 5,77 | ||||
| 2025-05-13 | 13F | Thrivent Financial For Lutherans | 0 | −100,00 | 0 | |||||
| 2025-04-23 | 13F | Spire Wealth Management | 0 | −100,00 | 0 | |||||
| 2025-08-14 | 13F | Visionary Wealth Advisors | 0 | −100,00 | 0 | |||||
| 2025-08-26 | NP | EVMLX - The E-Valuator Moderate (50%-70%) RMS Fund Service Class Shares | 11 868 | −61,56 | 703 | −59,37 | ||||
| 2025-07-10 | 13F | Rockland Trust Co | 9 731 | −4,71 | 576 | 0,88 | ||||
| 2025-08-12 | 13F | Proequities, Inc. | 0 | 0 | ||||||
| 2025-07-31 | 13F | West Michigan Advisors, Llc | 69 047 | 1,03 | 4 088 | 6,85 | ||||
| 2025-08-08 | 13F | Advisory Resource Group | 286 683 | 21,46 | 16 974 | 28,46 | ||||
| 2025-08-11 | 13F | Brown Brothers Harriman & Co | 4 140 | 245 | ||||||
| 2025-07-25 | 13F | Total Clarity Wealth Management, Inc. | 22 670 | 53,36 | 1 342 | 50,28 | ||||
| 2025-08-04 | 13F | Spinnaker Trust | 3 554 | 210 | ||||||
| 2025-07-30 | 13F | Crewe Advisors LLC | 515 | 0,00 | 30 | 7,14 | ||||
| 2025-08-14 | 13F | Qube Research & Technologies Ltd | 353 | 21 | ||||||
| 2025-08-11 | 13F | Private Advisor Group, LLC | 68 860 | 221,09 | 4 077 | 239,75 | ||||
| 2025-08-26 | NP | EVAGX - The E-Valuator Aggressive Growth (85%-99%) RMS Fund Service Class Shares | 27 770 | −58,40 | 1 644 | −56,01 | ||||
| 2025-08-06 | 13F | Mascagni Wealth Management, Inc. | 4 390 | −9,69 | 260 | −4,78 | ||||
| 2025-04-21 | 13F | O'Dell Group, LLC | 0 | −100,00 | 0 | |||||
| 2025-07-22 | 13F | Awm Capital, Llc | 0 | −100,00 | 0 | |||||
| 2025-08-14 | 13F | Schwallier Wealth Management LLC | 120 470 | 26,16 | 7 133 | 33,45 | ||||
| 2025-08-26 | NP | EVGLX - The E-Valuator Growth (70%-85%) RMS Fund Service Class Shares | 34 845 | −59,50 | 2 063 | −57,16 | ||||
| 2025-07-24 | 13F | Leo Wealth, LLC | 18 776 | 1 112 | ||||||
| 2025-04-21 | 13F | Nelson, Van Denburg & Campbell Wealth Management Group, LLC | 0 | −100,00 | 0 | |||||
| 2025-08-15 | 13F | Kestra Advisory Services, LLC | 96 831 | 19,95 | 5 733 | −0,74 | ||||
| 2025-08-14 | 13F | Goldman Sachs Group Inc | 3 989 | 236 | ||||||
| 2025-08-14 | 13F | GWM Advisors LLC | 7 844 | −21,24 | 464 | −16,70 | ||||
| 2025-08-04 | 13F | Creative Financial Designs Inc /adv | 81 215 | −4,35 | 4 809 | 1,16 | ||||
| 2025-08-06 | 13F | Golden State Wealth Management, LLC | 670 | −32,39 | 40 | −29,09 | ||||
| 2025-08-12 | 13F | Global Retirement Partners, LLC | 18 921 | 298,76 | 1 120 | 291,61 | ||||
| 2025-07-07 | 13F | Nova Wealth Management, Inc. | 33 | 10,00 | 2 | 0,00 | ||||
| 2025-07-16 | 13F | Kendall Capital Management | 0 | −100,00 | 0 | |||||
| 2025-08-12 | 13F | Steward Partners Investment Advisory, Llc | 1 421 | 80,10 | 84 | 90,91 | ||||
| 2025-08-14 | 13F | Freedom Financial Partners LLC | 93 241 | 4,25 | 5 520 | 10,25 | ||||
| 2025-09-04 | 13F/A | Advisor Group Holdings, Inc. | 584 916 | 9,44 | 34 638 | 15,75 | ||||
| 2025-08-13 | 13F | Capital Analysts, Inc. | 402 | 0,00 | 0 | |||||
| 2025-07-22 | 13F | Wells Trecaso Financial Group, LLC | 26 064 | 5,42 | 1 543 | 11,57 | ||||
| 2025-08-11 | 13F | PAX Financial Group, LLC | 8 735 | −0,01 | 517 | 5,73 | ||||
| 2025-08-19 | 13F | Advisory Services Network, LLC | 4 920 | 35,91 | 295 | 46,04 | ||||
| 2025-07-31 | 13F | Glass Jacobson Investment Advisors llc | 2 100 | 0,00 | 124 | −1,59 | ||||
| 2025-08-14 | 13F | Stifel Financial Corp | 79 897 | −4,63 | 4 731 | 0,87 | ||||
| 2025-08-26 | NP | OIBFX - JPMorgan Investor Balanced Fund Class I | 2 576 137 | 0,00 | 152 533 | 5,77 | ||||
| 2025-08-15 | 13F | Morgan Stanley | 3 842 | 53,50 | 228 | 62,14 | ||||
| 2025-07-29 | 13F | Stratos Wealth Partners, LTD. | 3 406 | 202 | ||||||
| 2025-09-03 | 13F | American Trust | 75 645 | 4 479 | ||||||
| 2025-08-14 | 13F | Mml Investors Services, Llc | 8 463 | 13,05 | 1 | |||||
| 2025-07-15 | 13F | Financial Management Professionals, Inc. | 50 | 0,00 | 3 | 0,00 | ||||
| 2025-08-14 | 13F | Jane Street Group, Llc | 30 691 | −47,95 | 1 817 | −44,96 | ||||
| 2025-07-08 | 13F | Adamsbrown Wealth Consultants Llc | 0 | −100,00 | 0 | |||||
| 2025-06-11 | 13F | Fortitude Financial, LLC | 67 249 | 1,88 | 3 765 | −5,69 | ||||
| 2025-04-23 | 13F | SFG Wealth Management, LLC. | 0 | −100,00 | 0 | |||||
| 2025-08-11 | 13F | Summit Wealth Partners, LLC | 11 801 | 5,27 | 699 | 11,32 | ||||
| 2025-04-23 | 13F | Bluesphere Advisors, LLC | 0 | −100,00 | 0 | |||||
| 2025-08-14 | 13F | Heritage Wealth Management, Inc. | 5 558 | 39,05 | 329 | 47,53 | ||||
| 2025-07-30 | 13F | Syntegra Private Wealth Group, LLC | 799 983 | 5,84 | 47 367 | 11,94 | ||||
| 2025-08-05 | 13F | Scarborough Advisors, LLC | 83 493 | 29,38 | 4 944 | 36,85 | ||||
| 2025-07-31 | 13F | Cambridge Investment Research Advisors, Inc. | 27 137 | −11,18 | 2 | 0,00 | ||||
| 2025-05-06 | 13F | Assetmark, Inc | 0 | −100,00 | 0 | |||||
| 2025-08-07 | 13F | Lakeridge Wealth Management LLC | 77 720 | 3,10 | 4 602 | 9,05 | ||||
| 2025-08-06 | 13F | Commonwealth Equity Services, Llc | 210 980 | 21,07 | 12 | 33,33 | ||||
| 2025-07-09 | 13F | Dynamic Advisor Solutions LLC | 4 853 | −11,33 | 287 | −6,21 | ||||
| 2025-07-14 | 13F | Rooted Wealth Advisors, Inc. | 16 940 | 8,65 | 1 028 | 29,80 | ||||
| 2025-08-13 | 13F | Baird Financial Group, Inc. | 46 424 | −4,08 | 2 749 | 1,44 | ||||
| 2025-08-04 | 13F | Daymark Wealth Partners, Llc | 14 711 | 1,88 | 871 | 7,80 | ||||
| 2025-07-25 | 13F | NorthRock Partners, LLC | 8 | 0,00 | 0 | |||||
| 2025-08-12 | 13F | Cornerstone Wealth Management, LLC | 5 961 | 0,00 | 353 | 5,71 | ||||
| 2025-08-07 | 13F | Nwam Llc | 10 691 | −73,74 | 649 | −71,52 | ||||
| 2025-07-16 | 13F | RWM Asset Management, LLC | 63 706 | 2,36 | 3 772 | 8,27 | ||||
| 2025-07-28 | 13F | WealthPlan Investment Management, LLC | 11 876 | 703 | ||||||
| 2025-07-29 | 13F | Systelligence, LLC | 80 142 | −58,77 | 4 745 | −56,39 | ||||
| 2025-05-15 | 13F | Talon Private Wealth, LLC | 0 | −100,00 | 0 | −100,00 | ||||
| 2025-08-14 | 13F | Arete Wealth Advisors, LLC | 8 886 | 1,73 | 1 | |||||
| 2025-08-05 | 13F | Prosperity Wealth Management, Inc. | 5 544 | −5,30 | 328 | 0,31 | ||||
| 2025-07-22 | 13F | Merit Financial Group, LLC | 34 273 | −7,17 | 2 029 | −1,79 | ||||
| 2025-08-26 | NP | EVVLX - The E-Valuator Very Conservative (0%-15%) RMS Fund Service Class Shares | 378 | −6,20 | 22 | 0,00 | ||||
| 2025-05-09 | 13F | CoreCap Advisors, LLC | 0 | −100,00 | 0 | |||||
| 2025-07-15 | 13F | Total Wealth Planning, Llc | 442 415 | 11,47 | 26 195 | 17,91 | ||||
| 2025-07-24 | 13F | Us Bancorp \de\ | 28 120 | −0,01 | 1 665 | 5,72 | ||||
| 2025-07-17 | 13F | Janney Montgomery Scott LLC | 56 849 | −33,59 | 3 | −25,00 | ||||
| 2025-08-06 | 13F | AE Wealth Management LLC | 290 | −19,44 | 17 | −15,00 | ||||
| 2025-08-11 | 13F | Aptus Capital Advisors, LLC | 135 | 0,00 | 8 | 14,29 | ||||
| 2025-08-14 | 13F | Sequent Planning LLC | 4 734 | 19,12 | 280 | 26,13 | ||||
| 2025-08-12 | 13F | MAI Capital Management | 4 041 | 423,45 | 239 | 455,81 | ||||
| 2025-08-13 | 13F | Avestar Capital, LLC | 27 155 | 18,94 | 1 608 | 25,74 | ||||
| 2025-05-13 | 13F | Heck Capital Advisors, LLC | 0 | −100,00 | 0 | −100,00 | ||||
| 2025-08-12 | 13F | SRS Capital Advisors, Inc. | 416 | 1 334,48 | 25 | 2 300,00 | ||||
| 2025-05-13 | 13F | Quadrature Capital Ltd | 0 | −100,00 | 0 | −100,00 | ||||
| 2025-08-13 | 13F | Banco de Sabadell, S.A | 517 | 0 | ||||||
| 2025-07-25 | 13F | Concurrent Investment Advisors, LLC | 32 626 | 59,29 | 1 932 | 68,50 | ||||
| 2025-08-13 | 13F | Smith, Moore & Co. | 27 836 | −21,26 | 1 648 | −16,73 | ||||
| 2025-08-07 | 13F | Meridian Financial Partners LLC | 285 065 | 8,81 | 17 | 14,29 | ||||
| 2025-08-18 | 13F/A | National Bank Of Canada /fi/ | 37 388 | −15,92 | 2 214 | −10,87 | ||||
| 2025-08-14 | 13F | Ruggaard & Associates LLC | 28 071 | −11,86 | 1 662 | −6,73 | ||||
| 2025-05-12 | 13F | Citigroup Inc | 0 | −100,00 | 0 | |||||
| 2025-08-13 | 13F | Northwestern Mutual Wealth Management Co | 258 682 | 17,29 | 15 317 | 24,06 | ||||
| 2025-08-14 | 13F | Fmr Llc | 303 | 604,65 | 18 | 750,00 | ||||
| 2025-07-21 | 13F | Greenwood Capital Associates Llc | 18 489 | 20,45 | 1 095 | 27,36 | ||||
| 2025-08-04 | 13F | Center for Financial Planning, Inc. | 1 223 | 0,00 | 72 | 5,88 | ||||
| 2025-08-07 | 13F | Kestra Private Wealth Services, Llc | 18 097 | 15,81 | 1 072 | 22,54 | ||||
| 2025-07-30 | 13F | Wbh Advisory Inc | 19 148 | 1 134 | ||||||
| 2025-08-14 | 13F | Royal Bank Of Canada | 155 929 | 4,05 | 9 232 | 10,04 | ||||
| 2025-07-24 | 13F | Eastern Bank | 0 | −100,00 | 0 | |||||
| 2025-08-14 | 13F | McIlrath & Eck, LLC | 15 | 0,00 | 1 | |||||
| 2025-07-21 | 13F | Ameritas Advisory Services, LLC | 916 | 54 | ||||||
| 2025-08-06 | 13F | Atlas Legacy Advisors, LLC | 45 021 | 6,79 | 2 666 | 10,03 | ||||
| 2025-07-28 | 13F | CGC Financial Services, LLC | 368 650 | 5,55 | 21 828 | 11,64 | ||||
| 2025-08-14 | 13F | Susquehanna International Group, Llp | 0 | −100,00 | 0 | |||||
| 2025-08-14 | 13F | UBS Group AG | 50 255 | −18,13 | 2 976 | −13,42 | ||||
| 2025-07-17 | 13F | Fifth Third Securities, Inc. | 41 172 | 17,12 | 2 438 | 23,89 | ||||
| 2025-04-23 | 13F | Valicenti Advisory Services Inc | 0 | −100,00 | 0 | |||||
| 2025-08-14 | 13F | Ameriprise Financial Inc | 56 348 | −6,12 | 3 336 | −0,71 | ||||
| 2025-08-14 | 13F | Wiley Bros.-aintree Capital, Llc | 12 182 | 6,96 | 731 | 15,30 | ||||
| 2025-08-14 | 13F | Wells Fargo & Company/mn | 0 | 0 | ||||||
| 2025-07-08 | 13F | Legacy Private Trust Co. | 89 163 | 418,87 | 5 279 | 449,32 | ||||
| 2025-07-28 | 13F | Harbour Investments, Inc. | 195 | 10,17 | 12 | 22,22 | ||||
| 2025-07-29 | 13F | Harbor Asset Planning, Inc. | 8 746 | 518 | ||||||
| 2025-04-21 | 13F | MN Wealth Advisors, LLC | 0 | −100,00 | 0 | |||||
| 2025-08-13 | 13F | Balance Wealth, LLC | 0 | −100,00 | 0 | |||||
| 2025-07-09 | 13F | Triumph Capital Management | 0 | −100,00 | 0 | |||||
| 2025-07-17 | 13F | Wagner Wealth Management, Llc | 387 521 | 6,02 | 22 945 | 12,15 | ||||
| 2025-08-05 | 13F | Strategic Financial Concepts, LLC | 0 | −100,00 | 0 | |||||
| 2025-07-25 | 13F | Concord Wealth Partners | 341 | 2,71 | 20 | 11,11 | ||||
| 2025-08-05 | 13F | Flynn Zito Capital Management, Llc | 108 351 | 2,39 | 6 415 | 8,29 | ||||
| 2025-08-08 | 13F | Cetera Investment Advisers | 579 860 | 13,85 | 34 333 | 20,42 | ||||
| 2025-08-11 | 13F | Western Wealth Management, LLC | 10 524 | 8,45 | 623 | 14,73 | ||||
| 2025-07-25 | 13F | Northwest Capital Management Inc | 4 826 | 22,96 | 286 | 30,14 | ||||
| 2025-08-05 | 13F | Crestwood Advisors Group LLC | 859 938 | −24,33 | 50 917 | −19,97 | ||||
| 2025-07-25 | 13F | Hazlett, Burt & Watson, Inc. | 1 885 | 0,00 | 0 | |||||
| 2025-08-07 | 13F | PCG Wealth Advisors, LLC | 0 | −100,00 | 0 | |||||
| 2025-08-14 | 13F | Great Valley Advisor Group, Inc. | 845 752 | 22,45 | 50 077 | 29,51 | ||||
| 2025-08-15 | 13F | Equitable Holdings, Inc. | 52 710 | 17,10 | 3 121 | 23,86 | ||||
| 2025-08-04 | 13F | MeadowBrook Investment Advisors LLC | 0 | −100,00 | 0 | |||||
| 2025-08-04 | 13F | Pensionmark Financial Group, Llc | 5 514 | −1,27 | 326 | 4,49 | ||||
| 2025-08-13 | 13F | Jones Financial Companies Lllp | 288 256 | 41,50 | 17 073 | 50,40 | ||||
| 2025-08-15 | 13F | Tower Research Capital LLC (TRC) | 25 725 | 1 523 | ||||||
| 2025-08-11 | 13F | HighTower Advisors, LLC | 6 119 | −14,94 | 362 | −9,95 | ||||
| 2025-08-12 | 13F | CIBC Private Wealth Group, LLC | 1 535 | 0,00 | 91 | 20,00 | ||||
| 2025-08-13 | 13F | Capital Advisors Wealth Management, LLC | 5 133 | 16,66 | 304 | 23,17 | ||||
| 2025-07-24 | 13F | IFP Advisors, Inc | 913 | 18,11 | 54 | 25,58 | ||||
| 2025-08-12 | 13F | Barnes Pettey Financial Advisors, Llc | 12 811 | 759 | ||||||
| 2025-07-25 | 13F | Envestnet Portfolio Solutions, Inc. | 0 | −100,00 | 0 | |||||
| 2025-08-14 | 13F | Vienna Asset Management LLC | 0 | −100,00 | 0 | |||||
| 2025-07-31 | 13F | B & T Capital Management DBA Alpha Capital Management | 197 209 | −3,41 | 11 677 | 2,16 | ||||
| 2025-07-09 | 13F | Breakwater Capital Group | 0 | −100,00 | 0 | −100,00 | ||||
| 2025-07-21 | 13F | Ashton Thomas Securities, Llc | 28 823 | −18,22 | 1 707 | −13,49 | ||||
| 2025-07-31 | 13F | Oak Harbor Wealth Partners, Llc | 17 227 | 16,23 | 1 020 | 23,04 | ||||
| 2025-07-21 | 13F | Ameriflex Group, Inc. | 0 | −100,00 | 0 | |||||
| 2025-07-25 | 13F | Atria Wealth Solutions, Inc. | 0 | −100,00 | 0 | |||||
| 2025-08-13 | 13F | Elios Financial Group Inc. | 7 543 | 15,74 | 447 | 22,53 | ||||
| 2025-08-06 | 13F | Stone House Investment Management, LLC | 3 246 | 369,75 | 192 | 405,26 | ||||
| 2025-03-18 | 13F/A | Bank Of America Corp /de/ | 0 | −100,00 | 0 | |||||
| 2025-07-07 | 13F | Modus Advisors, LLC | 0 | −100,00 | 0 | |||||
| 2025-07-07 | 13F | Thurston, Springer, Miller, Herd & Titak, Inc. | 38 | 0,00 | 2 | 0,00 | ||||
| 2025-08-14 | 13F | Citadel Advisors Llc | 69 098 | 13,24 | 4 091 | 19,80 | ||||
| 2025-07-10 | 13F | Wealth Enhancement Advisory Services, Llc | 61 922 | −5,38 | 3 777 | 3,08 | ||||
| 2025-04-16 | 13F | Twin Peaks Wealth Advisors, LLC | 0 | −100,00 | 0 | |||||
| 2025-08-08 | 13F | Avantax Advisory Services, Inc. | 49 854 | 46,52 | 2 952 | 54,99 | ||||
| 2025-08-08 | 13F | Thoroughbred Financial Services, Llc | 0 | −100,00 | 0 | |||||
| 2025-07-25 | 13F | Cwm, Llc | 463 991 | 4,65 | 27 | 12,50 | ||||
| 2025-05-12 | 13F | Independent Advisor Alliance | 0 | −100,00 | 0 | |||||
| 2025-08-08 | 13F | Capital Investment Advisory Services, LLC | 53 | 60,61 | 3 | 200,00 | ||||
| 2025-07-29 | 13F | Private Trust Co Na | 5 268 | −4,48 | 312 | 0,97 | ||||
| 2025-08-12 | 13F | LPL Financial LLC | 1 976 433 | 12,98 | 117 025 | 19,50 | ||||
| 2025-07-16 | 13F | Strategic Investment Solutions, Inc. /IL | 216 | 0,00 | 13 | 0,00 | ||||
| 2025-08-08 | 13F | Creative Planning | 6 936 | 0,78 | 411 | 6,49 | ||||
| 2025-07-11 | 13F | Farther Finance Advisors, LLC | 409 | 24 | ||||||
| 2025-08-01 | 13F | Envestnet Asset Management Inc | 140 176 | 12,78 | 8 300 | 19,27 | ||||
| 2025-08-08 | 13F | Pnc Financial Services Group, Inc. | 0 | −100,00 | 0 | |||||
| 2025-08-26 | NP | ONCFX - JPMorgan Investor Conservative Growth Fund Class I | 623 255 | 3,61 | 36 903 | 9,59 | ||||
| 2025-07-25 | 13F | We Are One Seven, LLC | 8 083 | 1,67 | 479 | 7,42 | ||||
| 2025-08-14 | 13F | Raymond James Financial Inc | 408 759 | 18,20 | 24 203 | 25,02 | ||||
| 2025-07-21 | 13F | Triad Wealth Partners, LLC | 6 289 | −35,48 | 372 | −31,74 |