Grunnleggende statistikk
| Institusjonelle eiere | 185 total, 185 long only, 0 short only, 0 long/short - change of 0,00% MRQ |
| Gjennomsnittlig porteføljeallokering | 0.0368 % - change of −17,72% MRQ |
| Institusjonelle aksjer (Long) | 2 523 883 (ex 13D/G) - change of 0,24MM shares 10,64% MRQ |
| Institusjonell verdi (Long) | $ 341 054 USD ($1000) |
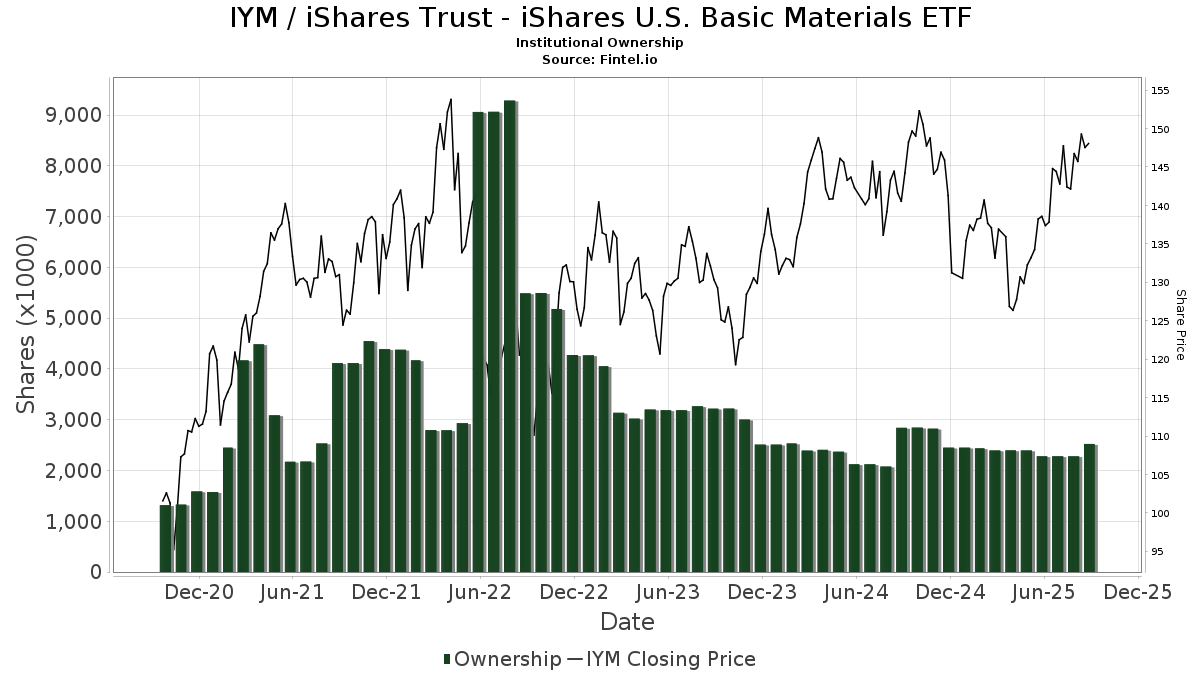
Institusjonelt eierskap og aksjonærer
iShares Trust - iShares U.S. Basic Materials ETF (US:IYM) har 185 institusjonelle eiere og aksjonærer som har sendt inn 13D/G- eller 13F-skjemaer til Securities Exchange Commission (SEC). Disse institusjonene eier til sammen 2,523,883 aksjer. De største aksjonærene inkluderer Citigroup Inc, Manufacturers Life Insurance Company, The, Green Harvest Asset Management LLC, Morgan Stanley, Bank Of America Corp /de/, Commerce Bank, LPL Financial LLC, UBS Group AG, Wells Fargo & Company/mn, and Northwestern Mutual Wealth Management Co .
iShares Trust - iShares U.S. Basic Materials ETF (ARCA:IYM) institusjonell eierstruktur viser nåværende posisjoner i selskapet fordelt på institusjoner og fond, samt de siste endringene i posisjonsstørrelse. De største aksjonærene kan være individuelle investorer, verdipapirfond, hedgefond eller institusjoner. Schedule 13D indikerer at investoren eier (eller har eid) mer enn 5 % av selskapet og har til hensikt (eller hadde til hensikt) å aktivt forfølge en endring i forretningsstrategien. Schedule 13G indikerer en passiv investering på over 5 %.
The share price as of September 11, 2025 is 150,69 / share. Previously, on September 12, 2024, the share price was 141,92 / share. This represents an increase of 6,18% over that period.
Fondssentiment-score
Fondssentiment Score (også kjent som akkumulering av eierskap poengsum) viser hvilke aksjer som er mest kjøpt av fond. Den er resultatet av en sofistikert, kvantitativ flerfaktormodell som identifiserer selskaper med de høyeste nivåene av institusjonell akkumulering. Beregningsmodellen for poeng bruker en kombinasjon av den totale økningen i antall offentliggjorte eiere, endringer i porteføljeallokeringen til disse eierne og andre beregninger. Tallet går fra 0 til 100, der høyere tall indikerer en høyere grad av akkumulering i forhold til sammenlignbare selskaper, der 50 er gjennomsnittet.
Oppdateringsfrekvens: Daglig
Sjekk ut Ownership Explorer, som inneholder en liste over de høyest rangerte selskapene.
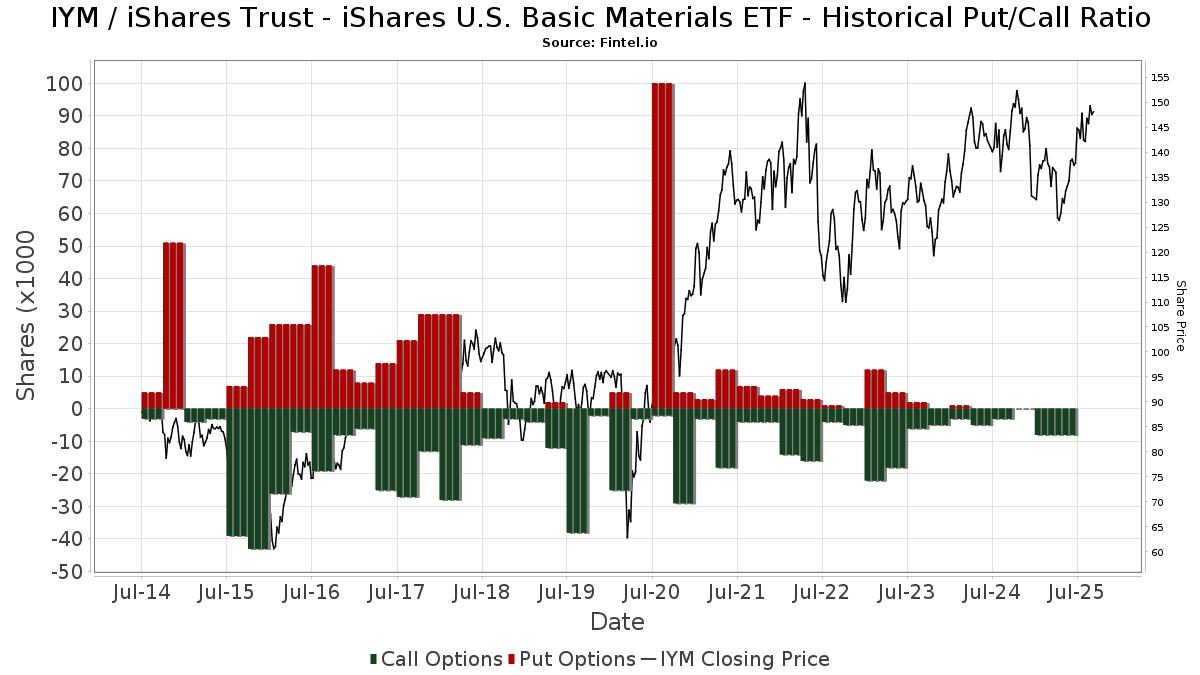
Institusjonell Put/Call-forhold
I tillegg til å rapportere standard aksje- og gjeldsemisjoner må institusjoner med mer enn 100 millioner kroner i forvaltningskapital også oppgi beholdningen av put- og callopsjoner. Siden put-opsjoner generelt indikerer et negativt sentiment, og call-opsjoner indikerer et positivt sentiment, kan vi få et inntrykk av det generelle institusjonelle sentimentet ved å plotte forholdet mellom put- og call-opsjoner. Diagrammet til høyre viser det historiske forholdet mellom put- og call-opsjoner for dette instrumentet.
Ved å bruke Put/Call-forholdet som en indikator på investorsentimentet kan man overvinne en av de viktigste svakhetene ved å bruke totalt institusjonelt eierskap, nemlig at en betydelig andel av forvaltningskapitalen investeres passivt for å følge indekser. Passivt forvaltede fond kjøper vanligvis ikke opsjoner, slik at indikatoren for put/call-forhold i større grad gjenspeiler stemningen i aktivt forvaltede fond.
13F- og NPORT-arkiveringer
Detaljer om 13F-arkiveringer er gratis. Detaljer om NP-arkiveringer krever et premium-medlemskap. Grønne rader indikerer nye posisjoner. Røde rader indikerer lukkede posisjoner. Klikk på lenke ikonet for å se hele transaksjonshistorikken.
Oppgrader
for å låse opp premiedata og eksportere til Excel. ![]() .
.
| Fildato | Kilde | Investor | Type | Gjennomsnittlig pris (estimert) |
Aksjer | Δ Aksjer (%) |
Rapportert verdi ($1000) | Verdi (%) | Portallokering (%) | |
|---|---|---|---|---|---|---|---|---|---|---|
| 2025-04-21 | 13F | Beacon Capital Management, LLC | 0 | −100,00 | 0 | |||||
| 2025-08-04 | 13F | Creative Financial Designs Inc /adv | 0 | −100,00 | 0 | |||||
| 2025-08-06 | 13F | Simmons Bank | 4 108 | −2,72 | 575 | 1,05 | ||||
| 2025-07-21 | 13F | HighMark Wealth Management LLC | 6 | 0,00 | 1 | |||||
| 2025-07-16 | 13F | American National Bank | 617 | 0,00 | 86 | 3,61 | ||||
| 2025-07-22 | 13F | Miracle Mile Advisors, LLC | 11 683 | 1 636 | ||||||
| 2025-08-14 | 13F | Citadel Advisors Llc | Call | 3 100 | 6,90 | 434 | 11,28 | |||
| 2025-07-29 | 13F | BKD Wealth Advisors, LLC | 3 878 | −0,77 | 543 | 3,04 | ||||
| 2025-08-05 | 13F | Counterweight Ventures, LLC | 3 857 | −0,44 | 540 | 3,45 | ||||
| 2025-08-14 | 13F | Citadel Advisors Llc | 37 185 | 17,39 | 5 206 | 21,92 | ||||
| 2025-07-25 | 13F | Sequoia Financial Advisors, LLC | 1 705 | −17,63 | 239 | −14,70 | ||||
| 2025-08-14 | 13F | Stifel Financial Corp | 2 773 | 11,63 | 388 | 16,17 | ||||
| 2025-07-28 | 13F | Essex LLC | 3 619 | 3,52 | 507 | 7,43 | ||||
| 2025-07-23 | 13F | Sachetta, LLC | 4 910 | −77,48 | 687 | −76,62 | ||||
| 2025-08-14 | 13F | Synovus Financial Corp | 1 455 | −18,72 | 204 | −15,77 | ||||
| 2025-05-09 | 13F | Fairfield Financial Advisors, LTD | 0 | −100,00 | 0 | |||||
| 2025-05-13 | 13F | Northern Trust Corp | 0 | −100,00 | 0 | |||||
| 2025-05-13 | 13F | Tocqueville Asset Management L.p. | 0 | −100,00 | 0 | |||||
| 2025-07-31 | 13F | Cambridge Investment Research Advisors, Inc. | 3 147 | −17,68 | 0 | |||||
| 2025-08-11 | 13F | Private Advisor Group, LLC | 2 593 | −1,74 | 363 | 2,25 | ||||
| 2025-07-16 | 13F | Magnus Financial Group LLC | 1 944 | 4,07 | 272 | 8,37 | ||||
| 2025-08-14 | 13F | Ameriprise Financial Inc | 5 325 | 0,72 | 746 | 4,63 | ||||
| 2025-07-01 | 13F | Harbor Investment Advisory, Llc | 100 | 0,00 | 14 | 7,69 | ||||
| 2025-08-13 | 13F | Beacon Pointe Advisors, LLC | 2 220 | 0,09 | 311 | 4,03 | ||||
| 2025-08-14 | 13F | Mml Investors Services, Llc | 20 500 | 4,72 | 3 | 0,00 | ||||
| 2025-08-15 | 13F | Kestra Advisory Services, LLC | 3 918 | −0,38 | 549 | 3,40 | ||||
| 2025-08-14 | 13F | GWM Advisors LLC | 159 | 0,00 | 22 | 4,76 | ||||
| 2025-07-11 | 13F | Wealth Management Partners, LLC | 2 450 | −4,26 | 351 | 2,03 | ||||
| 2025-08-05 | 13F | Westside Investment Management, Inc. | 160 | 0,00 | 22 | 4,76 | ||||
| 2025-07-10 | 13F | Wealth Enhancement Advisory Services, Llc | 3 818 | 5,41 | 552 | 13,11 | ||||
| 2025-08-12 | 13F | Ameritas Investment Partners, Inc. | 30 | 0,00 | 4 | 0,00 | ||||
| 2025-08-12 | 13F | Franklin Resources Inc | 4 770 | 0,00 | 668 | 3,89 | ||||
| 2025-08-13 | 13F | Russell Investments Group, Ltd. | 27 | 0,00 | 4 | 0,00 | ||||
| 2025-07-24 | 13F | Us Bancorp \de\ | 1 199 | −7,70 | 168 | −4,57 | ||||
| 2025-05-13 | 13F | Bokf, Na | 0 | −100,00 | 0 | −100,00 | ||||
| 2025-08-14 | 13F | Goldman Sachs Group Inc | 42 570 | 28,89 | 5 960 | 33,87 | ||||
| 2025-07-10 | 13F | Global Financial Private Client, LLC | 0 | −100,00 | 0 | |||||
| 2025-08-14 | 13F | Sunbelt Securities, Inc. | 28 | 21,74 | 4 | 0,00 | ||||
| 2025-07-14 | 13F | AdvisorNet Financial, Inc | 45 | 0,00 | 6 | 0,00 | ||||
| 2025-07-29 | 13F | Empirical Asset Management, LLC | 3 595 | 0,00 | 503 | 3,93 | ||||
| 2025-08-08 | 13F | Smithfield Trust Co | 200 | 0,00 | 0 | |||||
| 2025-08-11 | 13F | HighTower Advisors, LLC | 0 | −100,00 | 0 | |||||
| 2025-07-17 | 13F | Janney Montgomery Scott LLC | 1 465 | −9,06 | 0 | |||||
| 2025-08-12 | 13F | Proequities, Inc. | 0 | 0 | ||||||
| 2025-08-13 | 13F | National Bank Of Canada /fi/ | 0 | −100,00 | 0 | |||||
| 2025-08-05 | 13F | Huntington National Bank | 225 | −16,73 | ||||||
| 2025-07-16 | 13F | Southern Capital Advisors, Llc | 1 635 | 0,37 | 229 | 4,11 | ||||
| 2025-08-14 | 13F | Manufacturers Life Insurance Company, The | 316 252 | 44 278 | ||||||
| 2025-08-05 | 13F | GPS Wealth Strategies Group, LLC | 625 | 0,00 | 88 | 3,57 | ||||
| 2025-07-08 | 13F/A | Salem Investment Counselors Inc | 115 | −14,18 | 16 | −11,11 | ||||
| 2025-08-14 | 13F | RMB Capital Management, LLC | 0 | −100,00 | 0 | |||||
| 2025-08-05 | 13F | Bank Of Montreal /can/ | 7 826 | 11,62 | 1 096 | 15,87 | ||||
| 2025-08-08 | 13F | MTM Investment Management, LLC | 85 | 0,00 | 12 | 0,00 | ||||
| 2025-04-21 | 13F | Ronald Blue Trust, Inc. | 0 | −100,00 | 0 | −100,00 | ||||
| 2025-07-14 | 13F | Proathlete Wealth Management Llc | 2 | 100,00 | 0 | |||||
| 2025-08-14 | 13F | Mercer Global Advisors Inc /adv | 2 324 | −23,70 | 325 | −20,73 | ||||
| 2025-07-25 | 13F | Pathway Financial Advisors LLC | 12 172 | −0,62 | 1 704 | 3,21 | ||||
| 2025-08-04 | 13F | Center for Financial Planning, Inc. | 0 | −100,00 | 0 | |||||
| 2025-08-13 | 13F | Providence Capital Advisors, LLC | 376 | 53 | ||||||
| 2025-08-11 | 13F | TD Waterhouse Canada Inc. | 1 | 0,00 | 0 | |||||
| 2025-08-14 | 13F | Jane Street Group, Llc | 0 | −100,00 | 0 | |||||
| 2025-07-14 | 13F | Park Avenue Securities Llc | 3 278 | 17,16 | 0 | |||||
| 2025-07-11 | 13F | Busey Wealth Management | 1 748 | −5,72 | 245 | −2,01 | ||||
| 2025-08-14 | 13F | Fmr Llc | 2 307 | −1,70 | 323 | 2,22 | ||||
| 2025-08-15 | 13F | CI Private Wealth, LLC | 9 488 | −5,95 | 1 328 | −2,28 | ||||
| 2025-08-14 | 13F | Wells Fargo & Company/mn | 69 423 | −5,06 | 9 720 | −1,40 | ||||
| 2025-07-14 | 13F | Abound Wealth Management | 176 | 0,00 | 25 | 4,35 | ||||
| 2025-08-07 | 13F | Allworth Financial LP | 420 | −3,23 | 59 | 3,57 | ||||
| 2025-08-14 | 13F | Wiley Bros.-aintree Capital, Llc | 6 899 | −5,09 | 961 | −1,44 | ||||
| 2025-08-06 | 13F | Commonwealth Equity Services, Llc | 30 479 | 0,41 | 4 | 0,00 | ||||
| 2025-08-13 | 13F | Navis Wealth Advisors, LLC | 8 021 | 0,35 | 1 123 | 4,18 | ||||
| 2025-08-05 | 13F | Simplex Trading, Llc | 271 | 442,00 | 0 | |||||
| 2025-08-15 | 13F | Captrust Financial Advisors | 3 948 | −9,72 | 553 | −6,28 | ||||
| 2025-08-11 | 13F | Aptus Capital Advisors, LLC | 75 | 0,00 | 10 | 0,00 | ||||
| 2025-08-14 | 13F | Vivaldi Capital Management, LLC | 2 109 | 295 | ||||||
| 2025-07-25 | 13F | NorthRock Partners, LLC | 1 443 | −3,86 | 202 | 0,00 | ||||
| 2025-08-12 | 13F | Change Path, LLC | 1 502 | 210 | ||||||
| 2025-07-24 | 13F | Blair William & Co/il | 59 | 0,00 | 8 | 14,29 | ||||
| 2025-07-23 | 13F | BankPlus Trust Department | 214 | 0,00 | 30 | 3,57 | ||||
| 2025-07-21 | 13F | Ameritas Advisory Services, LLC | 1 031 | 144 | ||||||
| 2025-08-13 | 13F | Colonial Trust Advisors | 236 | 0,00 | 33 | 6,45 | ||||
| 2025-07-31 | 13F | Glass Jacobson Investment Advisors llc | 1 114 | −28,08 | 156 | −22,89 | ||||
| 2025-07-28 | 13F | Harbour Investments, Inc. | 118 | 7,27 | 17 | 14,29 | ||||
| 2025-07-10 | 13F | Sovran Advisors, LLC | 3 830 | 37,08 | 550 | 54,93 | ||||
| 2025-08-06 | 13F | Golden State Wealth Management, LLC | 72 | −30,77 | 10 | −28,57 | ||||
| 2025-07-18 | 13F | Founders Capital Management | 250 | 0,00 | 35 | 6,06 | ||||
| 2025-07-16 | 13F | Dakota Wealth Management | 3 500 | 0,00 | 490 | 4,03 | ||||
| 2025-07-21 | 13F | Old Second National Bank Of Aurora | 0 | −100,00 | 0 | |||||
| 2025-08-12 | 13F | Picton Mahoney Asset Management | 1 000 | 11,11 | 0 | |||||
| 2025-08-12 | 13F | O'shaughnessy Asset Management, Llc | 457 | 0,00 | 64 | 3,28 | ||||
| 2025-07-21 | 13F | Matauro, Llc | 4 526 | −13,08 | 634 | −9,70 | ||||
| 2025-08-14 | 13F | Quantinno Capital Management LP | 1 560 | 219 | ||||||
| 2025-08-07 | 13F | Roberts Glore & Co Inc /il/ | 5 903 | 0,00 | 826 | 3,90 | ||||
| 2025-08-06 | 13F | AE Wealth Management LLC | 15 740 | 9,21 | 2 204 | 13,44 | ||||
| 2025-08-14 | 13F | EP Wealth Advisors, Inc. | 1 264 | −27,31 | 177 | −24,79 | ||||
| 2025-07-31 | 13F | Conservest Capital Advisors, Inc. | 2 310 | 323 | ||||||
| 2025-08-12 | 13F | MAI Capital Management | 1 826 | −7,22 | 256 | −3,77 | ||||
| 2025-05-15 | 13F | EHP Funds Inc. | 0 | −100,00 | 0 | |||||
| 2025-07-28 | 13F | BRYN MAWR TRUST Co | 172 | 0,00 | 24 | 4,35 | ||||
| 2025-08-04 | 13F | Mesirow Financial Investment Management, Inc. | 5 006 | 0,02 | 701 | 3,86 | ||||
| 2025-07-23 | 13F | West Paces Advisors Inc. | 115 | 16 | ||||||
| 2025-08-18 | 13F | Front Row Advisors LLC | 130 | −23,53 | 18 | −18,18 | ||||
| 2025-05-16 | 13F | Empowered Funds, LLC | 0 | −100,00 | 0 | |||||
| 2025-08-15 | 13F | First Heartland Consultants, Inc. | 1 545 | −5,39 | 216 | −1,82 | ||||
| 2025-08-14 | 13F | Citadel Advisors Llc | Put | 0 | −100,00 | 0 | ||||
| 2025-04-11 | 13F | Signal Advisors Wealth, LLC | 0 | −100,00 | 0 | |||||
| 2025-07-29 | 13F | Ifrah Financial Services, Inc. | 1 430 | 200 | ||||||
| 2025-04-11 | 13F | Davis Capital Management | 88 | 0,00 | 12 | 0,00 | ||||
| 2025-08-14 | 13F | Federation des caisses Desjardins du Quebec | 55 | 0,00 | 8 | 0,00 | ||||
| 2025-07-25 | 13F | Atria Wealth Solutions, Inc. | 1 442 | 202 | ||||||
| 2025-07-24 | 13F | IFP Advisors, Inc | 673 | 0,00 | 94 | 4,44 | ||||
| 2025-09-04 | 13F/A | Advisor Group Holdings, Inc. | 18 195 | −18,45 | 2 548 | −15,29 | ||||
| 2025-08-14 | 13F | CoreCap Advisors, LLC | 239 | −15,55 | 33 | −13,16 | ||||
| 2025-08-14 | 13F | UBS Group AG | 79 373 | −7,08 | 11 113 | −3,49 | ||||
| 2025-07-08 | 13F | Nbc Securities, Inc. | 177 | 0,57 | 0 | |||||
| 2025-08-14 | 13F | Mariner, LLC | 2 991 | 19,69 | 419 | 24,40 | ||||
| 2025-08-18 | 13F | Geneos Wealth Management Inc. | 3 516 | 186,32 | 492 | 198,18 | ||||
| 2025-07-28 | 13F | Rosenberg Matthew Hamilton | 230 | 0,00 | 32 | 3,23 | ||||
| 2025-08-13 | 13F | Jones Financial Companies Lllp | 2 491 | −22,95 | 347 | −19,86 | ||||
| 2025-07-16 | 13F/A | CX Institutional | 478 | 0 | ||||||
| 2025-08-01 | 13F | Belvedere Trading LLC | 1 872 | 262 | ||||||
| 2025-08-01 | 13F | Belvedere Trading LLC | Call | 3 900 | 0,00 | 546 | 4,00 | |||
| 2025-07-29 | 13F | Private Trust Co Na | 70 | 0,00 | 10 | 0,00 | ||||
| 2025-08-11 | 13F | Citigroup Inc | 404 744 | −10,60 | 56 668 | −7,15 | ||||
| 2025-08-14 | 13F | Raymond James Financial Inc | 18 307 | 6,24 | 2 563 | 10,38 | ||||
| 2025-08-12 | 13F | CIBC Private Wealth Group, LLC | 83 | 0,00 | 12 | 22,22 | ||||
| 2025-08-11 | 13F | Principal Securities, Inc. | 100 | −93,05 | 14 | −92,47 | ||||
| 2025-08-13 | 13F | StoneX Group Inc. | 2 625 | 26,08 | 367 | 31,07 | ||||
| 2025-08-12 | 13F | Pathstone Holdings, LLC | 3 015 | 0,00 | 422 | 3,94 | ||||
| 2025-08-04 | 13F | Adell Harriman & Carpenter Inc | 1 587 | 0,00 | 222 | 4,23 | ||||
| 2025-08-14 | 13F | Colony Group, LLC | 12 631 | −2,03 | 1 769 | 1,73 | ||||
| 2025-08-05 | 13F | Tsfg, Llc | 27 | 0,00 | 0 | |||||
| 2025-08-08 | 13F | Pnc Financial Services Group, Inc. | 5 355 | 0,00 | 750 | 3,88 | ||||
| 2025-08-01 | 13F | Envestnet Asset Management Inc | 8 356 | −15,39 | 1 170 | −12,17 | ||||
| 2025-08-08 | 13F | Family Firm, Inc. | 0 | −100,00 | 0 | |||||
| 2025-08-14 | 13F | Snowden Capital Advisors LLC | 1 768 | 0,00 | 248 | 3,78 | ||||
| 2025-08-07 | 13F | Legacy Advisors, LLC | 0 | −100,00 | 0 | |||||
| 2025-08-12 | 13F | Laurel Wealth Advisors LLC | 19 602 | 13 901,43 | 0 | −100,00 | ||||
| 2025-05-15 | 13F | Foguth Wealth Management, LLC. | 0 | −100,00 | 0 | |||||
| 2025-08-15 | 13F | Morgan Stanley | 238 644 | −11,23 | 33 413 | −7,80 | ||||
| 2025-08-04 | 13F | Field & Main Bank | 335 | −9,46 | 47 | −6,12 | ||||
| 2025-08-12 | 13F | New Republic Capital, LLC | 180 | 0,00 | 25 | 4,17 | ||||
| 2025-07-17 | 13F | Independence Bank of Kentucky | 1 300 | 5,26 | 182 | 9,64 | ||||
| 2025-07-29 | 13F | Cottonwood Capital Advisors, Llc | 3 659 | −0,14 | 512 | 3,85 | ||||
| 2025-08-11 | 13F | Strategic Wealth Partners, Ltd. | 200 | 28 | ||||||
| 2025-08-12 | 13F | LPL Financial LLC | 89 015 | 6,04 | 12 463 | 10,14 | ||||
| 2025-07-23 | 13F | Clear Creek Financial Management, LLC | 2 108 | 0,24 | 295 | 4,24 | ||||
| 2025-08-14 | 13F | Daiwa Securities Group Inc. | 5 350 | 7,00 | 1 | |||||
| 2025-04-23 | 13F | Financial Life Planners | 0 | −100,00 | 0 | |||||
| 2025-08-14 | 13F | Bank Of America Corp /de/ | 131 814 | 5,16 | 18 455 | 9,22 | ||||
| 2025-07-23 | 13F | REAP Financial Group, LLC | 1 | 0,00 | 0 | |||||
| 2025-08-08 | 13F | Cetera Investment Advisers | 16 692 | 1,24 | 2 337 | 5,18 | ||||
| 2025-07-10 | 13F | Ferguson Wellman Capital Management, Inc | 3 445 | −12,67 | 482 | −9,23 | ||||
| 2025-08-13 | 13F | Truvestments Capital Llc | 475 | 0,00 | 67 | 3,13 | ||||
| 2025-07-17 | 13F | Fifth Third Securities, Inc. | 4 680 | 4,25 | 655 | 8,26 | ||||
| 2025-08-13 | 13F | Bank Of Nova Scotia | 25 400 | −23,26 | 3 556 | −20,29 | ||||
| 2025-08-04 | 13F | Spire Wealth Management | 2 858 | 0,28 | 400 | 4,17 | ||||
| 2025-08-13 | 13F | Baird Financial Group, Inc. | 1 451 | 203 | ||||||
| 2025-08-05 | 13F | Harel Insurance Investments & Financial Services Ltd. | 598 | 0,00 | 0 | |||||
| 2025-07-29 | 13F | Stratos Wealth Advisors, LLC | 5 132 | 8,82 | 719 | 13,07 | ||||
| 2025-08-13 | 13F | Northwestern Mutual Wealth Management Co | 69 330 | −2,56 | 9 707 | 1,20 | ||||
| 2025-07-15 | 13F | Cranbrook Wealth Management, LLC | 902 | −6,04 | 126 | −2,33 | ||||
| 2025-08-04 | 13F | Arkadios Wealth Advisors | 2 563 | −0,74 | 359 | 2,87 | ||||
| 2025-07-10 | 13F | Focus Financial Network, Inc. | 1 850 | 7,12 | 259 | 11,64 | ||||
| 2025-07-10 | 13F | Piscataqua Savings Bank | 1 020 | 0,00 | 143 | 3,65 | ||||
| 2025-08-12 | 13F | Jpmorgan Chase & Co | 1 863 | −29,67 | 261 | −27,17 | ||||
| 2025-07-17 | 13F | Mattern Wealth Management LLC | 2 579 | −4,69 | 361 | −0,82 | ||||
| 2025-07-11 | 13F | Caldwell Securities, Inc | 180 | 0,00 | 25 | 4,17 | ||||
| 2025-08-12 | 13F | BlackRock, Inc. | 410 | 0,00 | 57 | 3,64 | ||||
| 2025-07-08 | 13F | Rise Advisors, LLC | 10 | 1 | ||||||
| 2025-08-08 | 13F | Gts Securities Llc | 24 796 | 146,65 | 3 472 | 156,16 | ||||
| 2025-08-06 | 13F | SOUTH STATE Corp | 30 | 0,00 | 4 | 0,00 | ||||
| 2025-08-06 | 13F | Ethos Financial Group, LLC | 2 042 | −14,81 | 286 | −11,76 | ||||
| 2025-08-12 | 13F | AlphaCore Capital LLC | 784 | 110 | ||||||
| 2025-08-14 | 13F | IHT Wealth Management, LLC | 0 | −100,00 | 0 | |||||
| 2025-08-13 | 13F | Green Harvest Asset Management LLC | 306 221 | 1,42 | 42 874 | 5,34 | ||||
| 2025-08-14 | 13F | Qube Research & Technologies Ltd | 888 | −23,25 | 124 | −20,00 | ||||
| 2025-07-11 | 13F | Farther Finance Advisors, LLC | 282 | 4 600,00 | 39 | |||||
| 2025-08-04 | 13F | IFG Advisory, LLC | 0 | −100,00 | 0 | |||||
| 2025-07-09 | 13F | Gilman Hill Asset Management, LLC | 1 500 | 0,00 | 210 | 3,96 | ||||
| 2025-07-18 | 13F | Bartlett & Co. Wealth Management Llc | 3 618 | 0,00 | 507 | 3,90 | ||||
| 2025-08-07 | 13F | Montag A & Associates Inc | 1 000 | 0,00 | 140 | 4,48 | ||||
| 2025-07-30 | 13F | Whittier Trust Co Of Nevada Inc | 2 500 | 0,00 | 350 | 4,17 | ||||
| 2025-08-07 | 13F | 1620 Investment Advisors, Inc. | 130 | 0,00 | 18 | 5,88 | ||||
| 2025-08-07 | 13F | CENTRAL TRUST Co | 123 | 0,00 | 17 | 6,25 | ||||
| 2025-07-30 | 13F | D.a. Davidson & Co. | 0 | −100,00 | 0 | |||||
| 2025-08-14 | 13F | Coastal Bridge Advisors, LLC | 2 769 | −2,33 | 388 | 1,31 | ||||
| 2025-08-08 | 13F | Capital Investment Advisory Services, LLC | 242 | 476,19 | 34 | 560,00 | ||||
| 2025-08-14 | 13F | Guardian Wealth Advisors, Llc / Nc | 20 | 0,00 | 3 | 0,00 | ||||
| 2025-08-14 | 13F | Susquehanna International Group, Llp | Call | 1 600 | 0,00 | 224 | 4,19 | |||
| 2025-08-14 | 13F | Susquehanna International Group, Llp | 31 722 | 1 008,39 | 4 441 | 1 053,51 | ||||
| 2025-05-14 | 13F | Flow Traders U.s. Llc | 0 | −100,00 | 0 | |||||
| 2025-08-14 | 13F | Two Sigma Investments, Lp | 0 | −100,00 | 0 | |||||
| 2025-07-08 | 13F | Parallel Advisors, LLC | 230 | 0,00 | 32 | 3,23 | ||||
| 2025-07-14 | 13F | Armstrong Advisory Group, Inc | 117 | 48,10 | 16 | 60,00 | ||||
| 2025-08-14 | 13F | Comerica Bank | 2 483 | 1,06 | 348 | 4,83 | ||||
| 2025-07-14 | 13F | Farmers & Merchants Investments Inc | 185 | 0,00 | 26 | 4,17 | ||||
| 2025-07-31 | 13F | Mycio Wealth Partners, Llc | 160 | 0,00 | 22 | 4,76 | ||||
| 2025-08-12 | 13F | Gladstone Institutional Advisory LLC | 8 325 | −1,15 | 1 166 | 2,64 | ||||
| 2025-08-14 | 13F/A | Rockefeller Capital Management L.P. | 10 807 | −4,38 | 1 513 | −0,66 | ||||
| 2025-08-06 | 13F | Stonebridge Financial Planning Group, LLC | 2 942 | −6,66 | 412 | −3,07 | ||||
| 2025-08-14 | 13F | Royal Bank Of Canada | 47 493 | −0,40 | 6 649 | 3,44 | ||||
| 2025-08-19 | 13F | Anchor Investment Management, LLC | 105 | 0,00 | 15 | 0,00 | ||||
| 2025-08-07 | 13F | Commerce Bank | 116 082 | −4,02 | 16 253 | −0,31 | ||||
| 2025-08-12 | 13F | Steward Partners Investment Advisory, Llc | 6 870 | 3,67 | 962 | 7,61 | ||||
| 2025-07-07 | 13F | First Citizens Financial Corp | 9 362 | −17,52 | 1 311 | −14,38 | ||||
| 2025-08-11 | 13F | United Capital Financial Advisers, Llc | 3 037 | −9,15 | 425 | −5,56 | ||||
| 2025-07-25 | 13F | Cwm, Llc | 1 572 | −12,52 | 0 | |||||
| 2025-07-28 | 13F | Mutual Advisors, LLC | 7 750 | 297,64 | 1 148 | 353,75 | ||||
| 2025-07-30 | 13F | Atlantic Edge Private Wealth Management, LLC | 490 | 0,00 | 69 | 3,03 | ||||
| 2025-08-15 | 13F | Tower Research Capital LLC (TRC) | 1 436 | −35,66 | 201 | −25,00 | ||||
| 2025-07-17 | 13F | Halbert Hargrove Global Advisors, Llc | 0 | −100,00 | 0 | |||||
| 2025-07-16 | 13F | Register Financial Advisors LLC | 2 | 0,00 | 0 | |||||
| 2025-08-05 | 13F | HFG Advisors, Inc. | 2 736 | 0,00 | 383 | 4,08 | ||||
| 2025-07-15 | 13F | Patriot Investment Management Inc. | 2 383 | 0,00 | 334 | 3,74 | ||||
| 2025-07-23 | 13F | Trueblood Wealth Management, LLC | 1 435 | 201 | ||||||
| 2025-08-13 | 13F | Colonial Trust Co / SC | 350 | 0,00 | 49 | 4,26 | ||||
| 2025-07-23 | 13F | Lakeshore Capital Group, Inc. | 2 263 | 9,01 | 317 | 13,26 |