Grunnleggende statistikk
| Institusjonelle eiere | 73 total, 72 long only, 0 short only, 1 long/short - change of −18,89% MRQ |
| Gjennomsnittlig porteføljeallokering | 0.1419 % - change of −51,66% MRQ |
| Institusjonelle aksjer (Long) | 6 594 872 (ex 13D/G) - change of −9,66MM shares −59,44% MRQ |
| Institusjonell verdi (Long) | $ 123 491 USD ($1000) |
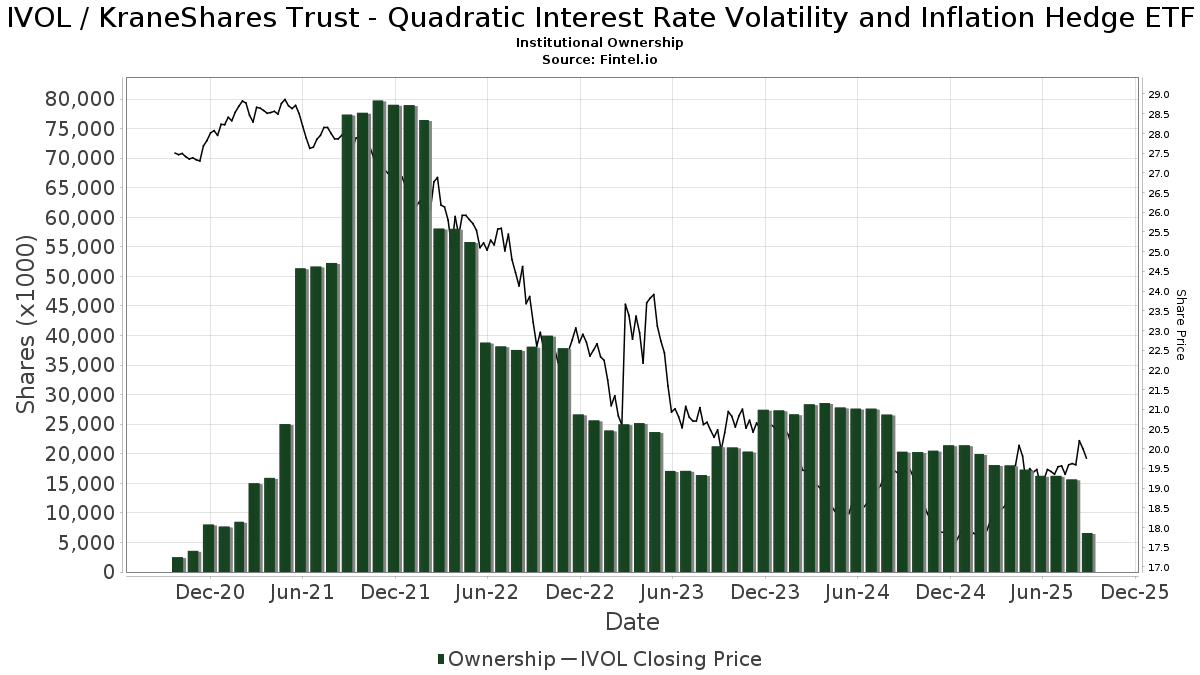
Institusjonelt eierskap og aksjonærer
KraneShares Trust - Quadratic Interest Rate Volatility and Inflation Hedge ETF (US:IVOL) har 73 institusjonelle eiere og aksjonærer som har sendt inn 13D/G- eller 13F-skjemaer til Securities Exchange Commission (SEC). Disse institusjonene eier til sammen 6,594,872 aksjer. De største aksjonærene inkluderer Raymond James Financial Inc, Wealth Enhancement Advisory Services, Llc, Ambassador Advisors, LLC, CacheTech Inc., Adams Wealth Management, Wells Fargo & Company/mn, Morgan Stanley, Regal Investment Advisors LLC, Royal Bank Of Canada, and BCS Private Wealth Management, Inc. .
KraneShares Trust - Quadratic Interest Rate Volatility and Inflation Hedge ETF (ARCA:IVOL) institusjonell eierstruktur viser nåværende posisjoner i selskapet fordelt på institusjoner og fond, samt de siste endringene i posisjonsstørrelse. De største aksjonærene kan være individuelle investorer, verdipapirfond, hedgefond eller institusjoner. Schedule 13D indikerer at investoren eier (eller har eid) mer enn 5 % av selskapet og har til hensikt (eller hadde til hensikt) å aktivt forfølge en endring i forretningsstrategien. Schedule 13G indikerer en passiv investering på over 5 %.
The share price as of September 11, 2025 is 19,66 / share. Previously, on September 12, 2024, the share price was 19,42 / share. This represents an increase of 1,24% over that period.
Fondssentiment-score
Fondssentiment Score (også kjent som akkumulering av eierskap poengsum) viser hvilke aksjer som er mest kjøpt av fond. Den er resultatet av en sofistikert, kvantitativ flerfaktormodell som identifiserer selskaper med de høyeste nivåene av institusjonell akkumulering. Beregningsmodellen for poeng bruker en kombinasjon av den totale økningen i antall offentliggjorte eiere, endringer i porteføljeallokeringen til disse eierne og andre beregninger. Tallet går fra 0 til 100, der høyere tall indikerer en høyere grad av akkumulering i forhold til sammenlignbare selskaper, der 50 er gjennomsnittet.
Oppdateringsfrekvens: Daglig
Sjekk ut Ownership Explorer, som inneholder en liste over de høyest rangerte selskapene.
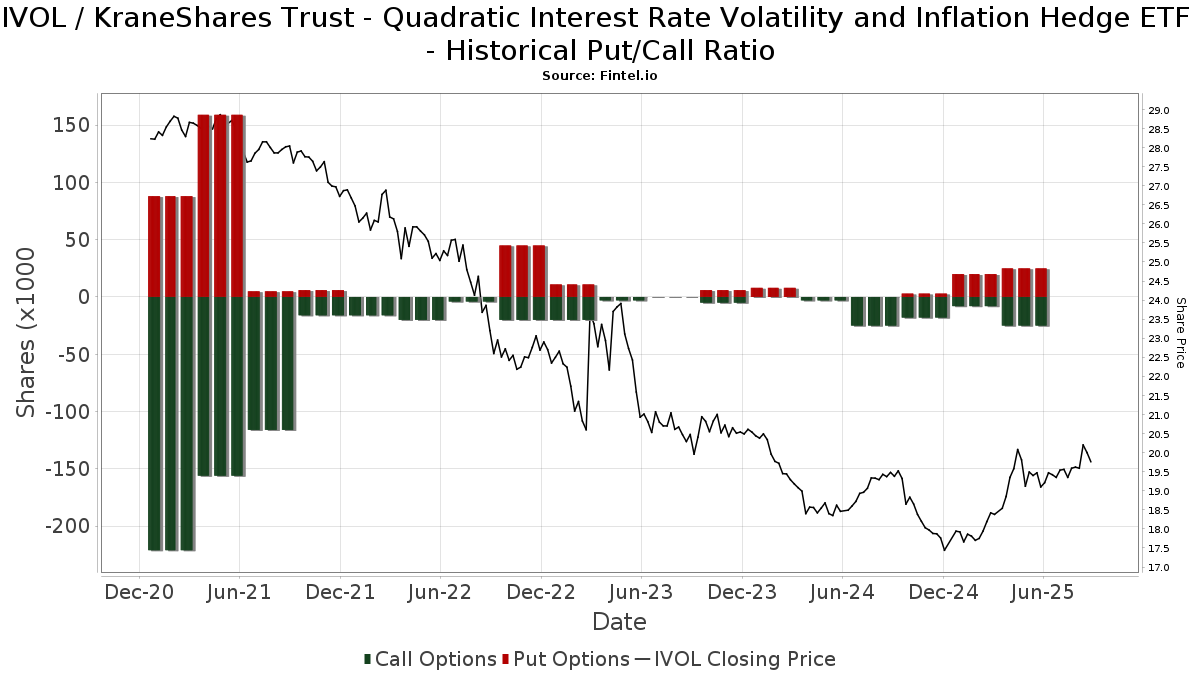
Institusjonell Put/Call-forhold
I tillegg til å rapportere standard aksje- og gjeldsemisjoner må institusjoner med mer enn 100 millioner kroner i forvaltningskapital også oppgi beholdningen av put- og callopsjoner. Siden put-opsjoner generelt indikerer et negativt sentiment, og call-opsjoner indikerer et positivt sentiment, kan vi få et inntrykk av det generelle institusjonelle sentimentet ved å plotte forholdet mellom put- og call-opsjoner. Diagrammet til høyre viser det historiske forholdet mellom put- og call-opsjoner for dette instrumentet.
Ved å bruke Put/Call-forholdet som en indikator på investorsentimentet kan man overvinne en av de viktigste svakhetene ved å bruke totalt institusjonelt eierskap, nemlig at en betydelig andel av forvaltningskapitalen investeres passivt for å følge indekser. Passivt forvaltede fond kjøper vanligvis ikke opsjoner, slik at indikatoren for put/call-forhold i større grad gjenspeiler stemningen i aktivt forvaltede fond.
13F- og NPORT-arkiveringer
Detaljer om 13F-arkiveringer er gratis. Detaljer om NP-arkiveringer krever et premium-medlemskap. Grønne rader indikerer nye posisjoner. Røde rader indikerer lukkede posisjoner. Klikk på lenke ikonet for å se hele transaksjonshistorikken.
Oppgrader
for å låse opp premiedata og eksportere til Excel. ![]() .
.
| Fildato | Kilde | Investor | Type | Gjennomsnittlig pris (estimert) |
Aksjer | Δ Aksjer (%) |
Rapportert verdi ($1000) | Verdi (%) | Portallokering (%) | |
|---|---|---|---|---|---|---|---|---|---|---|
| 2025-08-14 | 13F | Hilltop Holdings Inc. | 21 778 | −27,40 | 426 | −24,11 | ||||
| 2025-05-09 | 13F | Cary Street Partners Financial Llc | 0 | −100,00 | 0 | |||||
| 2025-07-24 | 13F | Ronald Blue Trust, Inc. | 0 | −100,00 | 0 | |||||
| 2025-08-06 | 13F | Richard Bernstein Advisors LLC | 406 | −99,99 | 8 | −99,99 | ||||
| 2025-07-23 | 13F | Mraz, Amerine & Associates, Inc. | 30 989 | −8,35 | 606 | −4,11 | ||||
| 2025-08-14 | 13F | Mml Investors Services, Llc | 0 | −100,00 | 0 | |||||
| 2025-08-13 | 13F | Financial Freedom, LLC | 0 | −100,00 | 0 | |||||
| 2025-08-06 | 13F | Commonwealth Equity Services, Llc | 32 352 | 28,69 | 1 | |||||
| 2025-08-11 | 13F | Regal Investment Advisors LLC | 277 662 | 1,66 | 5 431 | 6,45 | ||||
| 2025-08-14 | 13F | Royal Bank Of Canada | 243 738 | −40,78 | 4 758 | −38,10 | ||||
| 2025-07-29 | 13F | Chicago Partners Investment Group LLC | 97 624 | 0,00 | 1 910 | −1,24 | ||||
| 2025-08-14 | 13F | Coastal Bridge Advisors, LLC | 0 | −100,00 | 0 | −100,00 | ||||
| 2025-08-14 | 13F | Balyasny Asset Management Llc | 0 | −100,00 | 0 | |||||
| 2025-08-01 | 13F | Transcend Wealth Collective, Llc | 0 | −100,00 | 0 | |||||
| 2025-08-04 | 13F | Bay Colony Advisory Group, Inc d/b/a Bay Colony Advisors | 44 006 | 0,07 | 861 | 4,62 | ||||
| 2025-08-14 | 13F | Raymond James Financial Inc | 781 437 | −1,63 | 15 285 | 3,00 | ||||
| 2025-05-09 | 13F | Pnc Financial Services Group, Inc. | 0 | −100,00 | 0 | |||||
| 2025-08-15 | 13F | CI Private Wealth, LLC | 0 | −100,00 | 0 | |||||
| 2025-04-28 | 13F | Capital Investment Counsel, Inc | 0 | −100,00 | 0 | −100,00 | ||||
| 2025-08-05 | 13F | EPG Wealth Management LLC | 8 263 | 0,81 | 162 | 5,23 | ||||
| 2025-07-24 | 13F | IFP Advisors, Inc | 20 655 | −70,68 | 404 | −69,30 | ||||
| 2025-07-17 | 13F | Janney Montgomery Scott LLC | 0 | −100,00 | 0 | |||||
| 2025-04-25 | 13F | Stonebridge Financial Group, LLC | 0 | −100,00 | 0 | |||||
| 2025-08-12 | 13F | Steward Partners Investment Advisory, Llc | 13 736 | 0,01 | 269 | 4,69 | ||||
| 2025-08-12 | 13F | TCTC Holdings, LLC | 1 624 | 0,00 | 32 | 3,33 | ||||
| 2025-08-01 | 13F | Brookwood Investment Group LLC | 157 186 | 3 075 | ||||||
| 2025-08-13 | 13F | Scotia Capital Inc. | 0 | −100,00 | 0 | |||||
| 2025-08-14 | 13F | Bank Of America Corp /de/ | 488 | −99,99 | 10 | −99,99 | ||||
| 2025-05-08 | 13F | SlateStone Wealth, LLC | 0 | −100,00 | 0 | |||||
| 2025-07-31 | 13F | Opes Wealth Management LLC | 161 225 | −5,16 | 3 154 | −0,69 | ||||
| 2025-05-16 | 13F | Coppell Advisory Solutions LLC | 0 | −100,00 | 0 | |||||
| 2025-07-24 | 13F | Blair William & Co/il | 3 490 | −14,65 | 68 | −10,53 | ||||
| 2025-07-16 | 13F | Magnus Financial Group LLC | 19 657 | 0,07 | 384 | 4,92 | ||||
| 2025-08-08 | 13F | Islay Capital Management, Llc | 2 400 | 0,00 | 47 | 4,55 | ||||
| 2025-05-14 | 13F | Jane Street Group, Llc | 0 | −100,00 | 0 | |||||
| 2025-08-08 | 13F | Larson Financial Group LLC | 1 293 | 0,94 | 25 | 8,70 | ||||
| 2025-08-01 | 13F | Envestnet Asset Management Inc | 0 | −100,00 | 0 | |||||
| 2025-05-20 | 13F | Belpointe Asset Management LLC | 0 | −100,00 | 0 | |||||
| 2025-08-14 | 13F | UBS Group AG | 30 388 | 594 | ||||||
| 2025-05-15 | 13F | Two Sigma Securities, Llc | 0 | −100,00 | 0 | |||||
| 2025-05-13 | 13F | CacheTech Inc. | 504 723 | −6,70 | 9 428 | −1,76 | ||||
| 2025-08-01 | 13F | Boyd Watterson Asset Management Llc/oh | 919 | 18 | ||||||
| 2025-08-13 | 13F | Bare Financial Services, Inc | 0 | −100,00 | 0 | |||||
| 2025-05-13 | 13F | Adams Wealth Management | 504 723 | −6,70 | 9 428 | −1,76 | ||||
| 2025-08-14 | 13F | Citadel Advisors Llc | Call | 25 400 | 202,38 | 497 | 217,95 | |||
| 2025-04-14 | 13F | LexAurum Advisors, LLC | 0 | −100,00 | 0 | −100,00 | ||||
| 2025-08-14 | 13F | Citadel Advisors Llc | 52 179 | 21,12 | 1 021 | 26,87 | ||||
| 2025-07-24 | 13F | Us Bancorp \de\ | 60 912 | 23,85 | 1 191 | 29,74 | ||||
| 2025-07-25 | 13F | Prostatis Group LLC | 12 637 | 247 | ||||||
| 2025-08-14 | 13F | Stifel Financial Corp | 30 497 | −62,58 | 597 | −60,84 | ||||
| 2025-07-15 | 13F | Fifth Third Bancorp | 23 495 | −6,00 | 460 | −1,50 | ||||
| 2025-08-04 | 13F | Atria Investments Llc | 0 | −100,00 | 0 | |||||
| 2025-07-21 | 13F | Ameriflex Group, Inc. | 0 | −100,00 | 0 | |||||
| 2025-05-16 | 13F | Jones Financial Companies Lllp | 0 | −100,00 | 0 | |||||
| 2025-07-16 | 13F | Highline Wealth Partners Llc | 422 | 0,96 | 8 | 14,29 | ||||
| 2025-08-05 | 13F | Bank Of Montreal /can/ | 200 | 0,00 | 4 | 0,00 | ||||
| 2025-08-15 | 13F | Captrust Financial Advisors | 43 122 | −0,83 | 843 | 3,82 | ||||
| 2025-09-04 | 13F/A | Advisor Group Holdings, Inc. | 124 488 | −4,98 | 2 435 | −0,49 | ||||
| 2025-08-14 | 13F | Ancora Advisors, LLC | 0 | −100,00 | 0 | |||||
| 2025-08-12 | 13F | LPL Financial LLC | 131 924 | −4,71 | 2 580 | −0,23 | ||||
| 2025-08-14 | 13F | Citadel Advisors Llc | Put | 25 800 | 24,64 | 505 | 30,57 | |||
| 2025-08-14 | 13F | Bnp Paribas Arbitrage, Sa | 0 | −100,00 | 0 | |||||
| 2025-08-13 | 13F | BCJ Capital Management, LLC | 0 | −100,00 | 0 | |||||
| 2025-05-13 | 13F | ASB Consultores, LLC | 0 | −100,00 | 0 | |||||
| 2025-07-16 | 13F | West Branch Capital LLC | 500 | 0,00 | 10 | 0,00 | ||||
| 2025-07-28 | 13F | Kiker Wealth Management, LLC | 52 | 0,00 | 1 | |||||
| 2025-08-14 | 13F | Wells Fargo & Company/mn | 409 251 | 141,08 | 8 005 | 152,41 | ||||
| 2025-04-21 | 13F | United Advisor Group, LLC | 0 | −100,00 | 0 | |||||
| 2025-08-12 | 13F | Proequities, Inc. | 0 | 0 | ||||||
| 2025-07-14 | 13F | Painted Porch Advisors LLC | 540 | 0,00 | 11 | 0,00 | ||||
| 2025-07-21 | 13F | Credential Qtrade Securities Inc. | 0 | −100,00 | 0 | −100,00 | ||||
| 2025-05-06 | 13F | Cetera Investment Advisers | 0 | −100,00 | 0 | |||||
| 2025-07-08 | 13F | Lowe Wealth Advisors, LLC | 6 500 | −2,99 | 127 | 1,60 | ||||
| 2025-07-25 | 13F | Griffin Asset Management, Inc. | 0 | −100,00 | 0 | |||||
| 2025-07-30 | 13F | Bleakley Financial Group, LLC | 126 733 | 59,98 | 2 479 | 67,55 | ||||
| 2025-08-06 | 13F | Golden State Wealth Management, LLC | 1 549 | 0,00 | 30 | 7,14 | ||||
| 2025-07-28 | 13F | Harbour Investments, Inc. | 315 | 0,00 | 6 | 20,00 | ||||
| 2025-07-08 | 13F | Ehrlich Financial Group | 0 | −100,00 | 0 | |||||
| 2025-08-08 | 13F | Fortis Group Advisors, LLC | 103 233 | 230,47 | 1 982 | 239,97 | ||||
| 2025-08-12 | 13F | SRS Capital Advisors, Inc. | 10 | 0,00 | 0 | |||||
| 2025-05-21 | 13F/A | Geneos Wealth Management Inc. | 1 384 | 26 | ||||||
| 2025-07-29 | 13F | Straight Path Wealth Management | 13 439 | −10,12 | 263 | −6,09 | ||||
| 2025-07-25 | 13F | Concurrent Investment Advisors, LLC | 0 | −100,00 | 0 | |||||
| 2025-07-23 | 13F | Venturi Wealth Management, LLC | 0 | −100,00 | 0 | |||||
| 2025-08-14 | 13F | DecisionPoint Financial, LLC | 65 | 1 | ||||||
| 2025-07-25 | 13F | Cwm, Llc | 7 033 | 54,81 | 0 | |||||
| 2025-05-14 | 13F | Flow Traders U.s. Llc | 0 | −100,00 | 0 | |||||
| 2025-08-05 | 13F | Simplex Trading, Llc | 250 | 165,96 | 0 | |||||
| 2025-04-21 | 13F | Nelson, Van Denburg & Campbell Wealth Management Group, LLC | 0 | −100,00 | 0 | |||||
| 2025-07-07 | 13F | Investors Research Corp | 642 | 0,00 | 13 | 9,09 | ||||
| 2025-07-10 | 13F | Tompkins Financial Corp | 1 130 | 0,00 | 22 | 4,76 | ||||
| 2025-07-17 | 13F | Beacon Capital Management, LLC | 356 | 0,85 | 7 | 0,00 | ||||
| 2025-08-14 | 13F | Susquehanna International Group, Llp | 43 297 | 847 | ||||||
| 2025-07-16 | 13F | Signaturefd, Llc | 0 | −100,00 | 0 | |||||
| 2025-07-31 | 13F | Brinker Capital Investments, LLC | 0 | −100,00 | 0 | −100,00 | ||||
| 2025-07-17 | 13F | Sound Income Strategies, LLC | 80 | 2 | ||||||
| 2025-07-10 | 13F | Wealth Enhancement Advisory Services, Llc | 748 854 | −1,41 | 14 468 | 1,97 | ||||
| 2025-08-14 | 13F | GWM Advisors LLC | 18 991 | 4,65 | 371 | 9,44 | ||||
| 2025-05-01 | 13F | WESPAC Advisors, LLC | 0 | −100,00 | 0 | |||||
| 2025-08-14 | 13F | BCS Private Wealth Management, Inc. | 183 062 | 4 | ||||||
| 2025-05-15 | 13F | Tower Research Capital LLC (TRC) | 0 | −100,00 | 0 | |||||
| 2025-08-12 | 13F | Jpmorgan Chase & Co | 117 | 588,24 | 2 | |||||
| 2025-04-29 | 13F | U.S. Capital Wealth Advisors, LLC | 0 | −100,00 | 0 | |||||
| 2025-08-08 | 13F | Capital Investment Advisory Services, LLC | 3 245 | 0,00 | 63 | 5,00 | ||||
| 2025-07-11 | 13F | Caldwell Securities, Inc | 0 | −100,00 | 0 | |||||
| 2025-08-15 | 13F | Morgan Stanley | 355 688 | 119,91 | 6 957 | 130,29 | ||||
| 2025-08-11 | 13F | TD Waterhouse Canada Inc. | 2 450 | 0,00 | 47 | 4,44 | ||||
| 2025-07-08 | 13F | Nbc Securities, Inc. | 0 | −100,00 | 0 | |||||
| 2025-08-14 | 13F | Qube Research & Technologies Ltd | 153 | 3 | ||||||
| 2025-07-31 | 13F | Cambridge Investment Research Advisors, Inc. | 0 | −100,00 | 0 | |||||
| 2025-08-14 | 13F | Ambassador Advisors, LLC | 689 405 | 2,26 | 13 485 | 7,08 | ||||
| 2025-07-15 | 13F | MCF Advisors LLC | 7 070 | −0,81 | 138 | 3,76 | ||||
| 2025-05-16 | 13F | Laidlaw Wealth Management LLC | 0 | −100,00 | 0 | −100,00 | ||||
| 2025-08-12 | 13F | Global Retirement Partners, LLC | 2 012 | 39 | ||||||
| 2025-07-28 | 13F | Copia Wealth Management | 1 033 | −12,09 | 20 | −4,76 | ||||
| 2025-07-16 | 13F | One + One Wealth Management, Llc | 46 123 | 3,59 | 902 | 8,54 | ||||
| 2025-08-11 | 13F | HighTower Advisors, LLC | 140 474 | −46,25 | 2 748 | −43,72 | ||||
| 2025-08-14 | 13F | Aqr Capital Management Llc | 10 888 | 213 | ||||||
| 2025-05-14 | 13F | Oarsman Capital, Inc. | 0 | −100,00 | 0 | |||||
| 2025-08-05 | 13F | Bank of New York Mellon Corp | 0 | −100,00 | 0 | |||||
| 2025-07-24 | 13F | Trust Co Of Toledo Na /oh/ | 123 | 2 | ||||||
| 2025-07-30 | 13F | Crewe Advisors LLC | 0 | −100,00 | 0 | |||||
| 2025-08-14 | 13F | Old Mission Capital Llc | 35 218 | 689 | ||||||
| 2025-08-06 | 13F | Pekin Hardy Strauss, Inc. | 182 857 | 6,95 | 3 577 | 11,99 | ||||
| 2025-08-14 | 13F | Comerica Bank | 10 112 | −28,53 | 198 | −25,38 | ||||
| 2025-05-15 | 13F | Centaurus Financial, Inc. | 0 | −100,00 | 0 | |||||
| 2025-07-16 | 13F | Patron Partners Advisors, Llc | 0 | −100,00 | 0 |