Grunnleggende statistikk
| Institusjonelle eiere | 154 total, 154 long only, 0 short only, 0 long/short - change of 9,22% MRQ |
| Gjennomsnittlig porteføljeallokering | 0.1462 % - change of −6,02% MRQ |
| Institusjonelle aksjer (Long) | 3 301 511 (ex 13D/G) - change of 0,06MM shares 1,72% MRQ |
| Institusjonell verdi (Long) | $ 360 063 USD ($1000) |
Institusjonelt eierskap og aksjonærer
Vanguard Admiral Funds - Vanguard S&P Mid-Cap 400 Growth ETF (US:IVOG) har 154 institusjonelle eiere og aksjonærer som har sendt inn 13D/G- eller 13F-skjemaer til Securities Exchange Commission (SEC). Disse institusjonene eier til sammen 3,301,511 aksjer. De største aksjonærene inkluderer Mariner, LLC, Raymond James Financial Inc, LPL Financial LLC, Morgan Stanley, Octavia Wealth Advisors, LLC, Stordahl Capital Management, Inc., Moneta Group Investment Advisors Llc, LJI Wealth Management, LLC, UBS Group AG, and Ameriprise Financial Inc .
Vanguard Admiral Funds - Vanguard S&P Mid-Cap 400 Growth ETF (ARCA:IVOG) institusjonell eierstruktur viser nåværende posisjoner i selskapet fordelt på institusjoner og fond, samt de siste endringene i posisjonsstørrelse. De største aksjonærene kan være individuelle investorer, verdipapirfond, hedgefond eller institusjoner. Schedule 13D indikerer at investoren eier (eller har eid) mer enn 5 % av selskapet og har til hensikt (eller hadde til hensikt) å aktivt forfølge en endring i forretningsstrategien. Schedule 13G indikerer en passiv investering på over 5 %.
The share price as of September 11, 2025 is 121,30 / share. Previously, on September 12, 2024, the share price was 109,68 / share. This represents an increase of 10,60% over that period.

Fondssentiment-score
Fondssentiment Score (også kjent som akkumulering av eierskap poengsum) viser hvilke aksjer som er mest kjøpt av fond. Den er resultatet av en sofistikert, kvantitativ flerfaktormodell som identifiserer selskaper med de høyeste nivåene av institusjonell akkumulering. Beregningsmodellen for poeng bruker en kombinasjon av den totale økningen i antall offentliggjorte eiere, endringer i porteføljeallokeringen til disse eierne og andre beregninger. Tallet går fra 0 til 100, der høyere tall indikerer en høyere grad av akkumulering i forhold til sammenlignbare selskaper, der 50 er gjennomsnittet.
Oppdateringsfrekvens: Daglig
Sjekk ut Ownership Explorer, som inneholder en liste over de høyest rangerte selskapene.
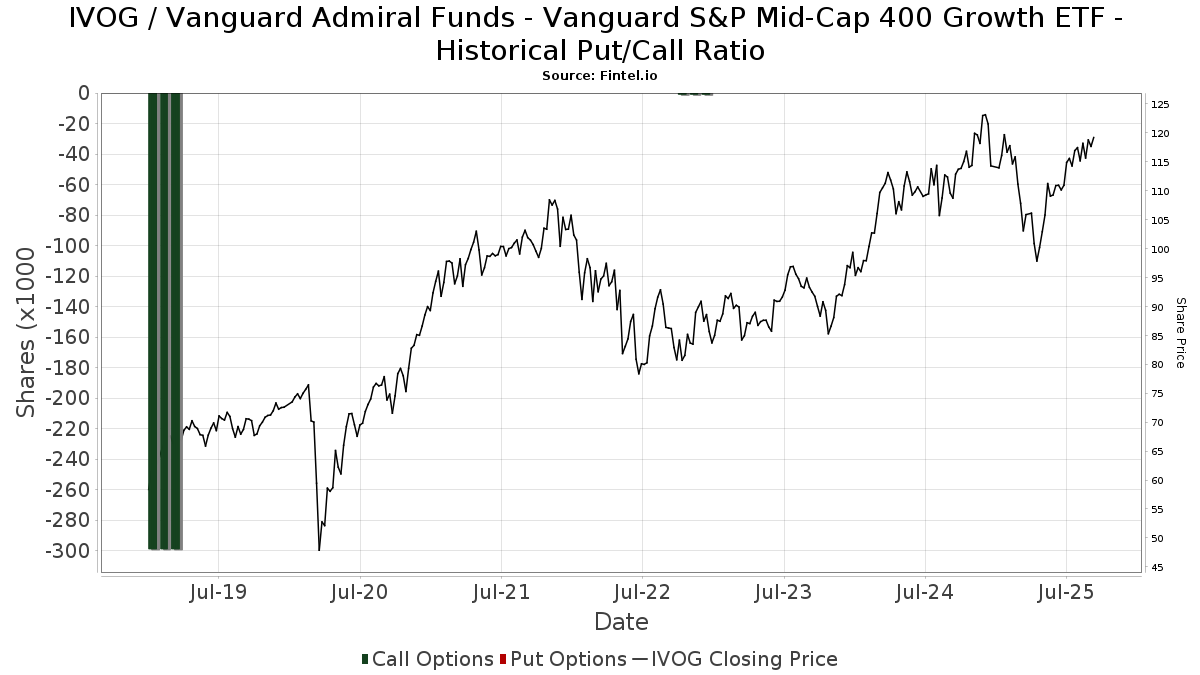
Institusjonell Put/Call-forhold
I tillegg til å rapportere standard aksje- og gjeldsemisjoner må institusjoner med mer enn 100 millioner kroner i forvaltningskapital også oppgi beholdningen av put- og callopsjoner. Siden put-opsjoner generelt indikerer et negativt sentiment, og call-opsjoner indikerer et positivt sentiment, kan vi få et inntrykk av det generelle institusjonelle sentimentet ved å plotte forholdet mellom put- og call-opsjoner. Diagrammet til høyre viser det historiske forholdet mellom put- og call-opsjoner for dette instrumentet.
Ved å bruke Put/Call-forholdet som en indikator på investorsentimentet kan man overvinne en av de viktigste svakhetene ved å bruke totalt institusjonelt eierskap, nemlig at en betydelig andel av forvaltningskapitalen investeres passivt for å følge indekser. Passivt forvaltede fond kjøper vanligvis ikke opsjoner, slik at indikatoren for put/call-forhold i større grad gjenspeiler stemningen i aktivt forvaltede fond.
13F- og NPORT-arkiveringer
Detaljer om 13F-arkiveringer er gratis. Detaljer om NP-arkiveringer krever et premium-medlemskap. Grønne rader indikerer nye posisjoner. Røde rader indikerer lukkede posisjoner. Klikk på lenke ikonet for å se hele transaksjonshistorikken.
Oppgrader
for å låse opp premiedata og eksportere til Excel. ![]() .
.
| Fildato | Kilde | Investor | Type | Gjennomsnittlig pris (estimert) |
Aksjer | Δ Aksjer (%) |
Rapportert verdi ($1000) | Verdi (%) | Portallokering (%) | |
|---|---|---|---|---|---|---|---|---|---|---|
| 2025-07-28 | 13F | Harbour Investments, Inc. | 39 915 | 10,75 | 4 512 | 21,33 | ||||
| 2025-08-11 | 13F | Aptus Capital Advisors, LLC | 3 215 | 6,56 | 363 | 16,72 | ||||
| 2025-08-06 | 13F | AE Wealth Management LLC | 2 380 | 0,38 | 269 | 10,25 | ||||
| 2025-08-06 | 13F | Adviser Investments LLC | 35 545 | −14,48 | 4 018 | −6,32 | ||||
| 2025-08-15 | 13F | CI Private Wealth, LLC | 3 230 | 365 | ||||||
| 2025-08-05 | 13F | Sunburst Financial Group, LLC | 2 129 | 241 | ||||||
| 2025-07-29 | 13F | Private Trust Co Na | 507 | 0,00 | 57 | 9,62 | ||||
| 2025-08-06 | 13F | Round Rock Advisors, LLC | 6 476 | 0,00 | 732 | 9,43 | ||||
| 2025-08-19 | 13F | Cape Investment Advisory, Inc. | 178 | 0,00 | 20 | 11,11 | ||||
| 2025-07-28 | 13F | IFG Advisors, LLC | 2 508 | 0,00 | 283 | 9,69 | ||||
| 2025-08-11 | 13F | Ritter Daniher Financial Advisory LLC / DE | 300 | −12,54 | 34 | −5,71 | ||||
| 2025-07-18 | 13F | SOA Wealth Advisors, LLC. | 344 | 0,00 | 39 | 8,57 | ||||
| 2025-07-30 | 13F | Whittier Trust Co | 150 | 0,00 | 17 | 6,67 | ||||
| 2025-08-08 | 13F | Cetera Investment Advisers | 71 953 | 11,08 | 8 133 | 21,68 | ||||
| 2025-08-11 | 13F | Goodman Financial Corp | 14 278 | 1 614 | ||||||
| 2025-08-12 | 13F | MAI Capital Management | 1 209 | −4,58 | 137 | 4,62 | ||||
| 2025-08-01 | 13F | American Financial & Tax Strategies Inc | 4 491 | 0,00 | 508 | 9,50 | ||||
| 2025-08-29 | 13F | Centaurus Financial, Inc. | 9 793 | −2,26 | 1 | 0,00 | ||||
| 2025-08-11 | 13F | Mosaic Family Wealth Partners, Llc | 2 220 | 0,00 | 251 | 9,17 | ||||
| 2025-04-28 | 13F | FSR Wealth Management Ltd. | 0 | −100,00 | 0 | |||||
| 2025-08-13 | 13F | Valued Retirements, Inc. | 2 402 | 0,00 | 271 | 9,72 | ||||
| 2025-08-13 | 13F | Jones Financial Companies Lllp | 2 628 | 130,53 | 297 | 152,99 | ||||
| 2025-05-15 | 13F | GWM Advisors LLC | 0 | −100,00 | 0 | |||||
| 2025-07-22 | 13F | Miracle Mile Advisors, LLC | 56 365 | −0,04 | 6 371 | 9,51 | ||||
| 2025-08-08 | 13F | Avantax Advisory Services, Inc. | 4 358 | 54,10 | 493 | 69,07 | ||||
| 2025-08-13 | 13F | Baird Financial Group, Inc. | 68 433 | 0,55 | 7 735 | 10,16 | ||||
| 2025-08-14 | 13F | Financial Network Wealth Advisors LLC | 61 | 7 | ||||||
| 2025-07-28 | 13F | Sagace Wealth Management LLC | 0 | −100,00 | 0 | |||||
| 2025-08-08 | 13F | Meridian Wealth Management, LLC | 4 450 | 0,16 | 503 | 9,61 | ||||
| 2025-07-07 | 13F | Nova Wealth Management, Inc. | 7 462 | −17,97 | 843 | −10,13 | ||||
| 2025-07-31 | 13F | LJI Wealth Management, LLC | 113 975 | 11,80 | 12 883 | 22,48 | ||||
| 2025-08-14 | 13F | Goldman Sachs Group Inc | 6 627 | −28,57 | 749 | −21,73 | ||||
| 2025-08-08 | 13F | Pnc Financial Services Group, Inc. | 2 873 | 0,00 | 325 | 9,46 | ||||
| 2025-08-14 | 13F | Hrt Financial Lp | 2 344 | 0 | ||||||
| 2025-07-31 | 13F | Brinker Capital Investments, LLC | 0 | −100,00 | 0 | −100,00 | ||||
| 2025-07-16 | 13F | Perigon Wealth Management, LLC | 1 907 | 216 | ||||||
| 2025-09-04 | 13F/A | Advisor Group Holdings, Inc. | 8 661 | −2,89 | 978 | 6,20 | ||||
| 2025-08-14 | 13F | UBS Group AG | 93 046 | 7,74 | 10 517 | 18,04 | ||||
| 2025-08-13 | 13F | Cary Street Partners Financial Llc | 15 681 | −73,17 | 1 772 | −70,61 | ||||
| 2025-08-14 | 13F | Colony Group, LLC | 1 807 | 204 | ||||||
| 2025-07-16 | 13F | Embree Financial Group | 6 659 | 0,00 | 753 | 9,62 | ||||
| 2025-07-24 | 13F | Conning Inc. | 2 726 | 308 | ||||||
| 2025-07-31 | 13F | City State Bank | 100 | 0,00 | 11 | 10,00 | ||||
| 2025-07-25 | 13F | Cwm, Llc | 6 | 0 | ||||||
| 2025-04-07 | 13F | GoalVest Advisory LLC | 0 | −100,00 | 0 | |||||
| 2025-08-04 | 13F | Quaker Wealth Management, LLC | 277 | 31 | ||||||
| 2025-07-24 | 13F | Bernard Wealth Management Corp. | 56 | 0,00 | 6 | 20,00 | ||||
| 2025-08-12 | 13F | O'shaughnessy Asset Management, Llc | 424 | −9,21 | 48 | −2,08 | ||||
| 2025-07-14 | 13F | AdvisorNet Financial, Inc | 8 | 0,00 | 1 | |||||
| 2025-07-21 | 13F | Ameritas Advisory Services, LLC | 270 | 31 | ||||||
| 2025-07-15 | 13F | North Star Investment Management Corp. | 102 | 0,00 | 12 | 10,00 | ||||
| 2025-08-05 | 13F | Key FInancial Inc | 356 | 0,00 | 40 | 11,11 | ||||
| 2025-08-13 | 13F | ESG Planning | 17 600 | 1 989 | ||||||
| 2025-08-11 | 13F | Citigroup Inc | 954 | −98,43 | 108 | −98,29 | ||||
| 2025-08-15 | 13F | Kestra Advisory Services, LLC | 64 516 | 4,11 | 7 292 | 14,06 | ||||
| 2025-07-24 | 13F | Financial Security Advisor, Inc. | 4 190 | 0,00 | 474 | 9,49 | ||||
| 2025-08-14 | 13F | Mariner, LLC | 691 859 | 0,07 | 78 201 | 9,63 | ||||
| 2025-04-23 | 13F | Creative Financial Designs Inc /adv | 0 | 0 | ||||||
| 2025-08-04 | 13F | Spire Wealth Management | 439 | 48,31 | 50 | 63,33 | ||||
| 2025-07-02 | 13F | Central Pacific Bank - Trust Division | 6 | 0,00 | 1 | |||||
| 2025-07-18 | 13F | Founders Capital Management | 673 | 0,00 | 76 | 10,14 | ||||
| 2025-08-12 | 13F | CIBC Private Wealth Group, LLC | 5 718 | 0,00 | 646 | 23,52 | ||||
| 2025-07-08 | 13F/A | Salem Investment Counselors Inc | 10 | −71,43 | 1 | −66,67 | ||||
| 2025-08-12 | 13F | Bokf, Na | 103 | 12 | ||||||
| 2025-04-17 | 13F | Breakwater Investment Management | 0 | −100,00 | 0 | |||||
| 2025-08-07 | 13F | Montag A & Associates Inc | 12 790 | −0,66 | 1 446 | 8,81 | ||||
| 2025-08-14 | 13F | Mendel Capital Management LLC | 20 113 | −3,76 | 2 273 | 5,48 | ||||
| 2025-07-24 | 13F | Us Bancorp \de\ | 305 | 0,00 | 34 | 9,68 | ||||
| 2025-08-12 | 13F | Clark Financial Services Group Inc /bd | 37 144 | 0,54 | 4 198 | 10,15 | ||||
| 2025-08-14 | 13F | Two Sigma Securities, Llc | 0 | −100,00 | 0 | |||||
| 2025-08-08 | 13F | SBI Securities Co., Ltd. | 19 | 0,00 | 2 | 100,00 | ||||
| 2025-08-12 | 13F | Jpmorgan Chase & Co | 36 695 | −0,19 | 4 148 | 9,33 | ||||
| 2025-05-05 | 13F | Eagle Bay Advisors LLC | 0 | −100,00 | 0 | |||||
| 2025-08-06 | 13F | Savant Capital, LLC | 25 224 | −2,01 | 2 851 | 7,38 | ||||
| 2025-08-14 | 13F | Raymond James Financial Inc | 194 729 | −0,55 | 22 010 | 8,96 | ||||
| 2025-08-14 | 13F | Warren Averett Asset Management, LLC | 3 519 | 5,90 | 398 | 16,08 | ||||
| 2025-07-08 | 13F | Parallel Advisors, LLC | 1 000 | 113 | ||||||
| 2025-07-17 | 13F | Heritage Investment Group, Inc. | 8 502 | 0,00 | 961 | 9,58 | ||||
| 2025-08-14 | 13F | Bank Of America Corp /de/ | 69 874 | −1,79 | 7 898 | 7,59 | ||||
| 2025-08-06 | 13F | Rialto Wealth Management, LLC | 3 194 | −16,78 | 361 | −8,61 | ||||
| 2025-08-12 | 13F | SRS Capital Advisors, Inc. | 597 | 239,20 | 67 | 272,22 | ||||
| 2025-08-14 | 13F | Wells Fargo & Company/mn | 56 604 | −25,48 | 6 398 | −18,36 | ||||
| 2025-05-15 | 13F | Captrust Financial Advisors | 0 | −100,00 | 0 | |||||
| 2025-05-16 | 13F/A | Atlanta Consulting Group Advisors, LLC | 0 | −100,00 | 0 | |||||
| 2025-07-24 | 13F | Drucker Wealth 3.0, LLC | 14 549 | 1 681 | ||||||
| 2025-07-18 | 13F | Consolidated Portfolio Review Corp | 2 956 | −1,17 | 334 | 8,44 | ||||
| 2025-08-07 | 13F | Allworth Financial LP | 31 893 | −3,12 | 3 605 | 7,13 | ||||
| 2025-08-04 | 13F | Keybank National Association/oh | 29 786 | 4,64 | 3 367 | 14,65 | ||||
| 2025-04-17 | 13F | Abound Wealth Management | 0 | −100,00 | 0 | |||||
| 2025-08-12 | 13F | Franklin Resources Inc | 27 394 | 0,00 | 3 096 | 9,55 | ||||
| 2025-07-10 | 13F | Wealth Enhancement Advisory Services, Llc | 6 172 | 30,16 | 713 | 45,60 | ||||
| 2025-08-04 | 13F | BLB&B Advisors, LLC | 2 822 | 0,00 | 319 | 9,28 | ||||
| 2025-08-14 | 13F | Betterment LLC | 7 176 | −8,68 | 1 | |||||
| 2025-07-31 | 13F | Oppenheimer & Co Inc | 0 | −100,00 | 0 | |||||
| 2025-08-14 | 13F | Royal Bank Of Canada | 17 937 | −5,09 | 2 028 | 4,05 | ||||
| 2025-07-29 | 13F | Stordahl Capital Management, Inc. | 141 778 | 1,32 | 16 025 | 11,01 | ||||
| 2025-08-04 | 13F | Assetmark, Inc | 491 | −90,83 | 55 | −90,04 | ||||
| 2025-08-11 | 13F | Advisor Resource Council | 0 | −100,00 | 0 | |||||
| 2025-07-11 | 13F | Farther Finance Advisors, LLC | 663 | 0,00 | 75 | 7,25 | ||||
| 2025-07-25 | 13F | Sequoia Financial Advisors, LLC | 1 795 | 203 | ||||||
| 2025-08-14 | 13F | Moneta Group Investment Advisors Llc | 128 829 | 159,75 | 14 561 | 184,62 | ||||
| 2025-08-12 | 13F | Global Retirement Partners, LLC | 1 728 | 0,00 | 195 | 0,52 | ||||
| 2025-08-12 | 13F | Virtu Financial LLC | 7 335 | −18,64 | 1 | |||||
| 2025-07-21 | 13F | Crews Bank & Trust | 80 | 0,00 | 9 | 12,50 | ||||
| 2025-08-14 | 13F | EP Wealth Advisors, Inc. | 950 | 107 | ||||||
| 2025-08-11 | 13F | Private Advisor Group, LLC | 16 483 | −3,25 | 1 863 | 6,03 | ||||
| 2025-07-22 | 13F | Integrated Capital Management, LLC | 33 452 | 13,35 | 4 | 0,00 | ||||
| 2025-08-14 | 13F | CIBC World Markets Inc. | 9 340 | 0,31 | 1 056 | 9,90 | ||||
| 2025-08-01 | 13F | Envestnet Asset Management Inc | 17 753 | −4,92 | 2 007 | 4,15 | ||||
| 2025-08-12 | 13F | Proequities, Inc. | 0 | 0 | ||||||
| 2025-08-08 | 13F | Gts Securities Llc | 8 107 | 916 | ||||||
| 2025-07-31 | 13F | Hobart Private Capital, LLC | 4 738 | 0,00 | 536 | 9,63 | ||||
| 2025-08-26 | 13F/A | Thrivent Financial For Lutherans | 17 623 | 2 | ||||||
| 2025-05-09 | 13F | Wealthspire Advisors, LLC | 0 | −100,00 | 0 | |||||
| 2025-04-21 | 13F | Ronald Blue Trust, Inc. | 0 | −100,00 | 0 | |||||
| 2025-08-15 | 13F | Morgan Stanley | 169 543 | 29,83 | 19 164 | 42,23 | ||||
| 2025-08-07 | 13F | PFG Advisors | 0 | −100,00 | 0 | |||||
| 2025-08-15 | 13F | Equitable Holdings, Inc. | 7 957 | 1,97 | 899 | 11,68 | ||||
| 2025-08-14 | 13F | Citadel Advisors Llc | 5 294 | −74,02 | 598 | −71,55 | ||||
| 2025-07-21 | 13F | Ameriflex Group, Inc. | 596 | 0,68 | 67 | 9,84 | ||||
| 2025-08-11 | 13F | Insight 2811, Inc. | 2 301 | 260 | ||||||
| 2025-08-14 | 13F | Safeguard Investment Advisory Group, LLC | 2 600 | 0,00 | 294 | 9,33 | ||||
| 2025-08-08 | 13F | Creative Planning | 14 708 | 1,49 | 1 662 | 11,17 | ||||
| 2025-07-28 | 13F | Bridges Investment Management Inc | 3 860 | 0,00 | 436 | 9,55 | ||||
| 2025-07-22 | 13F | Merit Financial Group, LLC | 5 439 | −6,48 | 615 | 2,33 | ||||
| 2025-08-04 | 13F | Quaker Wealth Management, LLC | Put | 0 | −100,00 | 0 | −100,00 | |||
| 2025-08-14 | 13F | Mercer Global Advisors Inc /adv | 8 298 | 3,54 | 941 | 15,89 | ||||
| 2025-07-16 | 13F | Octavia Wealth Advisors, LLC | 143 862 | −11,04 | 16 261 | −2,54 | ||||
| 2025-08-06 | 13F | Commonwealth Equity Services, Llc | 16 418 | −19,02 | 2 | −50,00 | ||||
| 2025-07-10 | 13F | Weinberger Asset Management, Inc | 2 161 | 0,00 | 244 | 9,91 | ||||
| 2025-07-17 | 13F | Hanson & Doremus Investment Management | 902 | 0,00 | 0 | |||||
| 2025-03-12 | 13F/A | Private Capital Management Llc | 3 698 | −0,16 | 405 | −3,57 | ||||
| 2025-08-05 | 13F | MidAtlantic Capital Management, Inc. | 3 680 | 0,00 | 416 | 9,50 | ||||
| 2025-08-14 | 13F | Ameriprise Financial Inc | 92 841 | 20,04 | 10 489 | 31,25 | ||||
| 2025-08-12 | 13F | Howe & Rusling Inc | 466 | 0,00 | 53 | 8,33 | ||||
| 2025-07-29 | 13F | Rodgers & Associates, LTD | 3 606 | 2,27 | 408 | 12,12 | ||||
| 2025-08-11 | 13F | Sierra Capital LLC | 2 628 | 0 | ||||||
| 2025-08-13 | 13F | SageView Advisory Group, LLC | 18 087 | −29,94 | 2 129 | −20,09 | ||||
| 2025-07-29 | 13F | Salomon & Ludwin, LLC | 257 | 0,00 | 30 | 11,54 | ||||
| 2025-08-11 | 13F | Principal Securities, Inc. | 1 587 | 3,86 | 179 | 4,07 | ||||
| 2025-07-21 | 13F | Barrett & Company, Inc. | 968 | 0,00 | 109 | 10,10 | ||||
| 2025-08-08 | 13F | Larson Financial Group LLC | 1 | 0,00 | 0 | |||||
| 2025-07-25 | 13F | Atria Wealth Solutions, Inc. | 1 808 | −16,37 | 208 | −6,73 | ||||
| 2025-08-11 | 13F | WPG Advisers, LLC | 256 | 0,00 | 29 | 7,69 | ||||
| 2025-08-14 | 13F | Stifel Financial Corp | 29 598 | −1,66 | 3 345 | 7,73 | ||||
| 2025-07-17 | 13F | Lauterbach Financial Advisors, LLC | 6 125 | 0,00 | 692 | 9,67 | ||||
| 2025-07-24 | 13F | Jfs Wealth Advisors, Llc | 2 188 | 12,38 | 247 | 23,50 | ||||
| 2025-08-06 | 13F | SOUTH STATE Corp | 3 698 | 0,00 | 418 | 9,45 | ||||
| 2025-07-24 | 13F | Morton Brown Family Wealth, LLC | 1 936 | 10,63 | 219 | 21,11 | ||||
| 2025-07-24 | 13F | Blair William & Co/il | 15 819 | −2,99 | 1 788 | 6,24 | ||||
| 2025-07-15 | 13F | Mather Group, Llc. | 0 | −100,00 | 0 | |||||
| 2025-07-17 | 13F | Sound Income Strategies, LLC | 12 | −50,00 | 1 | −50,00 | ||||
| 2025-08-13 | 13F | Financial Freedom, LLC | 2 499 | −14,27 | 282 | −6,00 | ||||
| 2025-08-05 | 13F | Plante Moran Financial Advisors, LLC | 561 | 63 | ||||||
| 2025-08-14 | 13F | Mml Investors Services, Llc | 12 181 | 25,25 | 1 | 0,00 | ||||
| 2025-07-23 | 13F | Stephen J. Garry & Associates, Llc | 36 751 | −0,43 | 4 154 | 9,09 | ||||
| 2025-07-22 | 13F | Coastal Investment Advisors, Inc. | 0 | −100,00 | 0 | |||||
| 2025-08-14 | 13F | Jane Street Group, Llc | 7 676 | −10,07 | 868 | −1,48 | ||||
| 2025-08-04 | 13F | Bristlecone Advisors, LLC | 220 | 0,00 | 25 | 9,09 | ||||
| 2025-07-29 | 13F | Chicago Partners Investment Group LLC | 12 517 | 3,69 | 1 464 | 14,57 | ||||
| 2025-05-05 | 13F | Lindbrook Capital, Llc | 350 | 0,00 | 36 | −7,69 | ||||
| 2025-08-11 | 13F | HighTower Advisors, LLC | 14 888 | −2,41 | 1 683 | 6,93 | ||||
| 2025-07-09 | 13F | Dynamic Advisor Solutions LLC | 1 960 | 222 | ||||||
| 2025-08-19 | 13F | Asset Dedication, LLC | 110 | 0,00 | 12 | 9,09 | ||||
| 2025-07-31 | 13F | Cambridge Investment Research Advisors, Inc. | 7 059 | 0,33 | 1 | |||||
| 2025-08-14 | 13F | Comerica Bank | 150 | −13,79 | 17 | −5,88 | ||||
| 2025-05-08 | 13F | Marshall Investment Management, Llc | 0 | −100,00 | 0 | |||||
| 2025-08-14 | 13F | Fmr Llc | 6 360 | 27,58 | 719 | 39,69 | ||||
| 2025-08-14 | 13F | Susquehanna International Group, Llp | 10 157 | 62,72 | 1 148 | 78,54 | ||||
| 2025-08-12 | 13F | LPL Financial LLC | 179 585 | 12,79 | 20 299 | 23,56 | ||||
| 2025-07-25 | 13F | We Are One Seven, LLC | 2 147 | −0,51 | 243 | 9,01 | ||||
| 2025-08-07 | 13F | Commerce Bank | 6 960 | 0,00 | 787 | 9,47 | ||||
| 2025-08-13 | 13F | Balanced Wealth Group Llc | 2 283 | 0,00 | 264 | 11,91 | ||||
| 2025-08-13 | 13F | Russell Investments Group, Ltd. | 390 | 0,00 | 44 | 10,00 | ||||
| 2025-08-14 | 13F | Ausdal Financial Partners, Inc. | 2 478 | 0,85 | 280 | 10,67 | ||||
| 2025-08-13 | 13F | Northwestern Mutual Wealth Management Co | 27 939 | 62,97 | 3 158 | 78,56 | ||||
| 2025-05-15 | 13F | Lido Advisors, LLC | 0 | −100,00 | 0 | −100,00 |