Grunnleggende statistikk
| Institusjonelle eiere | 171 total, 171 long only, 0 short only, 0 long/short - change of −3,33% MRQ |
| Gjennomsnittlig porteføljeallokering | 0.1158 % - change of −28,18% MRQ |
| Institusjonelle aksjer (Long) | 33 751 632 (ex 13D/G) - change of −1,39MM shares −3,95% MRQ |
| Institusjonell verdi (Long) | $ 1 483 911 USD ($1000) |
Institusjonelt eierskap og aksjonærer
VanEck ETF Trust - VanEck Intermediate Muni ETF (US:ITM) har 171 institusjonelle eiere og aksjonærer som har sendt inn 13D/G- eller 13F-skjemaer til Securities Exchange Commission (SEC). Disse institusjonene eier til sammen 33,751,632 aksjer. De største aksjonærene inkluderer Bank Of America Corp /de/, Northwestern Mutual Wealth Management Co, LPL Financial LLC, Envestnet Asset Management Inc, Ameriprise Financial Inc, Wells Fargo & Company/mn, Fmr Llc, CX Institutional, Morgan Stanley, and Wealth Enhancement Advisory Services, Llc .
VanEck ETF Trust - VanEck Intermediate Muni ETF (BATS:ITM) institusjonell eierstruktur viser nåværende posisjoner i selskapet fordelt på institusjoner og fond, samt de siste endringene i posisjonsstørrelse. De største aksjonærene kan være individuelle investorer, verdipapirfond, hedgefond eller institusjoner. Schedule 13D indikerer at investoren eier (eller har eid) mer enn 5 % av selskapet og har til hensikt (eller hadde til hensikt) å aktivt forfølge en endring i forretningsstrategien. Schedule 13G indikerer en passiv investering på over 5 %.
The share price as of September 9, 2025 is 46,23 / share. Previously, on September 10, 2024, the share price was 46,78 / share. This represents a decline of 1,18% over that period.

Fondssentiment-score
Fondssentiment Score (også kjent som akkumulering av eierskap poengsum) viser hvilke aksjer som er mest kjøpt av fond. Den er resultatet av en sofistikert, kvantitativ flerfaktormodell som identifiserer selskaper med de høyeste nivåene av institusjonell akkumulering. Beregningsmodellen for poeng bruker en kombinasjon av den totale økningen i antall offentliggjorte eiere, endringer i porteføljeallokeringen til disse eierne og andre beregninger. Tallet går fra 0 til 100, der høyere tall indikerer en høyere grad av akkumulering i forhold til sammenlignbare selskaper, der 50 er gjennomsnittet.
Oppdateringsfrekvens: Daglig
Sjekk ut Ownership Explorer, som inneholder en liste over de høyest rangerte selskapene.
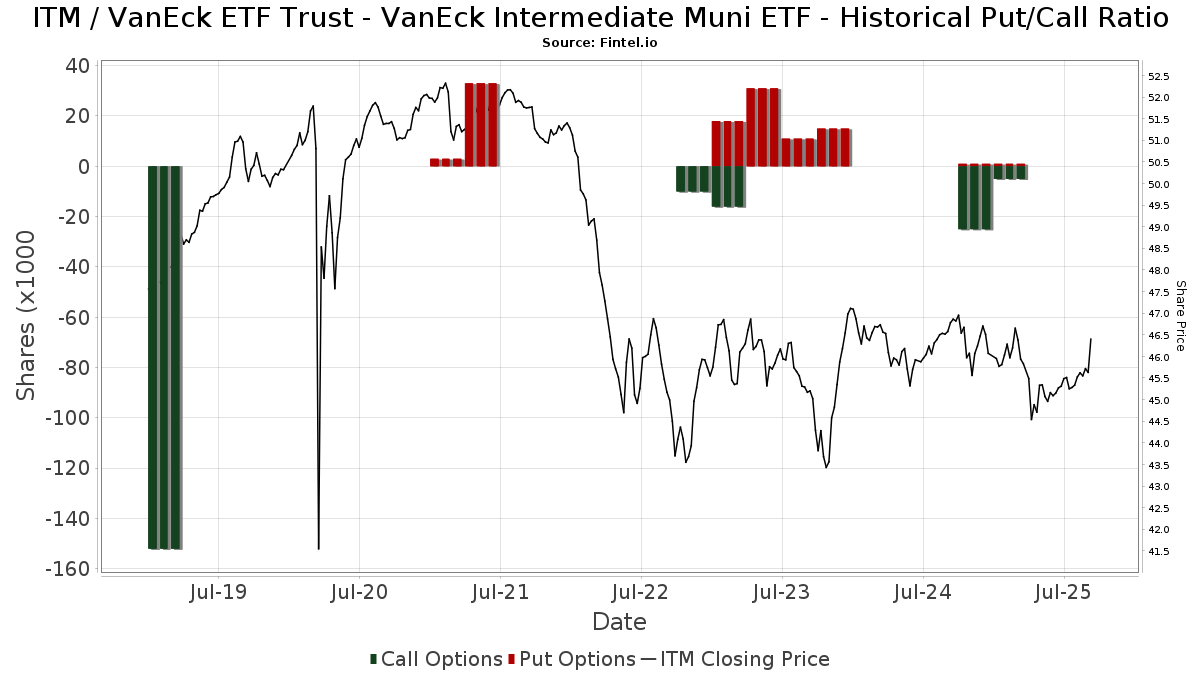
Institusjonell Put/Call-forhold
I tillegg til å rapportere standard aksje- og gjeldsemisjoner må institusjoner med mer enn 100 millioner kroner i forvaltningskapital også oppgi beholdningen av put- og callopsjoner. Siden put-opsjoner generelt indikerer et negativt sentiment, og call-opsjoner indikerer et positivt sentiment, kan vi få et inntrykk av det generelle institusjonelle sentimentet ved å plotte forholdet mellom put- og call-opsjoner. Diagrammet til høyre viser det historiske forholdet mellom put- og call-opsjoner for dette instrumentet.
Ved å bruke Put/Call-forholdet som en indikator på investorsentimentet kan man overvinne en av de viktigste svakhetene ved å bruke totalt institusjonelt eierskap, nemlig at en betydelig andel av forvaltningskapitalen investeres passivt for å følge indekser. Passivt forvaltede fond kjøper vanligvis ikke opsjoner, slik at indikatoren for put/call-forhold i større grad gjenspeiler stemningen i aktivt forvaltede fond.
13F- og NPORT-arkiveringer
Detaljer om 13F-arkiveringer er gratis. Detaljer om NP-arkiveringer krever et premium-medlemskap. Grønne rader indikerer nye posisjoner. Røde rader indikerer lukkede posisjoner. Klikk på lenke ikonet for å se hele transaksjonshistorikken.
Oppgrader
for å låse opp premiedata og eksportere til Excel. ![]() .
.
| Fildato | Kilde | Investor | Type | Gjennomsnittlig pris (estimert) |
Aksjer | Δ Aksjer (%) |
Rapportert verdi ($1000) | Verdi (%) | Portallokering (%) | |
|---|---|---|---|---|---|---|---|---|---|---|
| 2025-04-24 | 13F | Wingate Wealth Advisors, Inc. | 0 | −100,00 | 0 | |||||
| 2025-08-12 | 13F | Steward Partners Investment Advisory, Llc | 10 010 | 0,00 | 455 | 0,00 | ||||
| 2025-08-04 | 13F | Assetmark, Inc | 0 | −100,00 | 0 | |||||
| 2025-08-05 | 13F | Bank Of Montreal /can/ | 6 193 | 0,00 | 282 | 0,00 | ||||
| 2025-07-24 | 13F | Lee Financial Co | 10 500 | 0,00 | 477 | 0,00 | ||||
| 2025-08-11 | 13F | Rothschild Investment Llc | 122 | 6 | ||||||
| 2025-07-21 | 13F | Cliftonlarsonallen Wealth Advisors, Llc | 15 554 | 51,17 | 707 | 51,07 | ||||
| 2025-08-11 | 13F | CFS Investment Advisory Services, LLC | 10 537 | −63,76 | 0 | −100,00 | ||||
| 2025-07-22 | 13F | Aquire Wealth Advisors, LLC | 19 259 | 0,25 | 876 | 0,11 | ||||
| 2025-07-16 | 13F/A | CX Institutional | 721 021 | −3,80 | 33 | −5,88 | ||||
| 2025-08-01 | 13F | Petra Financial Advisors Inc | 14 920 | 0,10 | 678 | 0,00 | ||||
| 2025-08-04 | 13F | Simon Quick Advisors, Llc | 109 868 | 4 996 | ||||||
| 2025-08-14 | 13F | Jane Street Group, Llc | 249 865 | −71,33 | 11 361 | −71,35 | ||||
| 2025-07-15 | 13F | Mather Group, Llc. | 447 121 | 49,69 | 20 331 | 49,56 | ||||
| 2025-08-07 | 13F | Resources Investment Advisors, LLC. | 453 820 | 35,26 | 20 635 | 35,14 | ||||
| 2025-08-13 | 13F | Jones Financial Companies Lllp | 26 144 | −3,74 | 1 186 | −3,73 | ||||
| 2025-07-16 | 13F | Magnus Financial Group LLC | 9 189 | −16,15 | 418 | −16,27 | ||||
| 2025-07-30 | 13F | Paul Damon & Associates, Inc. | 11 258 | −3,65 | 512 | −3,77 | ||||
| 2025-08-07 | 13F | Midwest Trust Co | 39 100 | 1 778 | ||||||
| 2025-08-12 | 13F | Founders Financial Alliance, LLC | 0 | −100,00 | 0 | |||||
| 2025-07-07 | 13F | RDA Financial Network | 6 875 | 313 | ||||||
| 2025-08-21 | 13F | Aveo Capital Partners, LLC | 0 | −100,00 | 0 | |||||
| 2025-08-13 | 13F | Renaissance Technologies Llc | 130 700 | 35,72 | 5 943 | 35,60 | ||||
| 2025-07-30 | 13F | Wbh Advisory Inc | 13 222 | 601 | ||||||
| 2025-04-09 | 13F | Baker Tilly Financial, Llc | 0 | −100,00 | 0 | |||||
| 2025-09-04 | 13F/A | Advisor Group Holdings, Inc. | 33 303 | 4,58 | 1 515 | 4,55 | ||||
| 2025-07-18 | 13F | Vicus Capital | 53 270 | 18,03 | 2 422 | 17,92 | ||||
| 2025-07-09 | 13F | Massmutual Trust Co Fsb/adv | 14 986 | −58,49 | 681 | −58,55 | ||||
| 2025-08-14 | 13F | Bnp Paribas Arbitrage, Sa | 0 | −100,00 | 0 | |||||
| 2025-08-14 | 13F | Mariner, LLC | 35 213 | 14,69 | 1 601 | 14,60 | ||||
| 2025-08-08 | 13F | Kingsview Wealth Management, LLC | 0 | −100,00 | 0 | −100,00 | ||||
| 2025-07-11 | 13F | Farther Finance Advisors, LLC | 898 | 0,34 | 41 | 0,00 | ||||
| 2025-08-14 | 13F | Wiley Bros.-aintree Capital, Llc | 12 374 | −24,50 | 563 | −24,36 | ||||
| 2025-07-29 | 13F | Stratos Wealth Partners, LTD. | 6 741 | 0,03 | 307 | 0,00 | ||||
| 2025-08-14 | 13F | Raymond James Financial Inc | 167 539 | −2,94 | 7 618 | −3,03 | ||||
| 2025-07-28 | 13F | J.Safra Asset Management Corp | 48 404 | 2 197 | ||||||
| 2025-07-21 | 13F | DHJJ Financial Advisors, Ltd. | 4 | 0,00 | 0 | |||||
| 2025-07-22 | 13F | Gutierrez Wealth Advisory, LLC | 13 598 | 618 | ||||||
| 2025-04-21 | 13F | Nelson, Van Denburg & Campbell Wealth Management Group, LLC | 0 | −100,00 | 0 | |||||
| 2025-07-08 | 13F/A | Salem Investment Counselors Inc | 41 | 0,00 | 2 | 0,00 | ||||
| 2025-07-30 | 13F | Granite Harbor Advisors, Inc. | 78 012 | 11,96 | 3 547 | 11,86 | ||||
| 2025-05-15 | 13F | Two Sigma Securities, Llc | 0 | −100,00 | 0 | |||||
| 2025-08-07 | 13F/A | Tortoise Investment Management, LLC | 0 | −100,00 | 0 | −100,00 | ||||
| 2025-07-09 | 13F | FOCUS Wealth Advisors, LLC | 156 012 | 2,49 | 7 094 | 2,40 | ||||
| 2025-08-12 | 13F | CIBC Private Wealth Group, LLC | 1 080 | 0,00 | 49 | 4,26 | ||||
| 2025-08-14 | 13F | Wells Fargo & Company/mn | 865 145 | 3,20 | 39 338 | 3,11 | ||||
| 2025-08-04 | 13F | Atria Investments Llc | 0 | −100,00 | 0 | |||||
| 2025-08-05 | 13F | Cherry Tree Wealth Management, LLC | 699 | 0,00 | 32 | 0,00 | ||||
| 2025-08-14 | 13F | GWM Advisors LLC | 500 | −98,30 | 23 | −98,35 | ||||
| 2025-08-19 | 13F | Advisory Services Network, LLC | 0 | −100,00 | 0 | |||||
| 2025-07-24 | 13F | JNBA Financial Advisors | 0 | −100,00 | 0 | |||||
| 2025-07-31 | 13F | Oppenheimer & Co Inc | 23 828 | −7,30 | 1 083 | −7,36 | ||||
| 2025-04-09 | 13F | St Germain D J Co Inc | 0 | −100,00 | 0 | −100,00 | ||||
| 2025-08-13 | 13F | Capital Advisors Wealth Management, LLC | 9 407 | −3,10 | 428 | −3,17 | ||||
| 2025-08-14 | 13F | Goodwin Investment Advisory | 23 172 | −6,11 | 1 054 | −6,23 | ||||
| 2025-08-05 | 13F | Tsfg, Llc | 315 | 0,00 | 0 | |||||
| 2025-08-14 | 13F | Millennium Management Llc | 0 | −100,00 | 0 | |||||
| 2025-07-31 | 13F | GenTrust, LLC | 19 466 | −6,71 | 885 | −6,74 | ||||
| 2025-07-15 | 13F | Td Private Client Wealth Llc | 5 993 | 16,57 | 273 | 16,74 | ||||
| 2025-08-13 | 13F | Flow Traders U.s. Llc | 0 | −100,00 | 0 | |||||
| 2025-07-23 | 13F | Watershed Private Wealth Llc | 0 | −100,00 | 0 | |||||
| 2025-05-12 | 13F | Sandy Spring Bank | 57 | 3 | ||||||
| 2025-08-11 | 13F | HighTower Advisors, LLC | 344 123 | −3,89 | 15 647 | −3,97 | ||||
| 2025-08-14 | 13F | Susquehanna International Group, Llp | Call | 0 | −100,00 | 0 | ||||
| 2025-08-14 | 13F | Harwood Advisory Group, LLC | 0 | −100,00 | 0 | |||||
| 2025-07-17 | 13F | Janney Montgomery Scott LLC | 11 166 | −3,96 | 1 | |||||
| 2025-08-14 | 13F | AllSquare Wealth Management LLC | 525 | 0,00 | 24 | 0,00 | ||||
| 2025-08-14 | 13F | Van Eck Associates Corp | 0 | −100,00 | 0 | |||||
| 2025-07-25 | 13F | Atria Wealth Solutions, Inc. | 0 | −100,00 | 0 | |||||
| 2025-05-15 | 13F | Proquility Private Wealth Partners, LLC | 113 095 | 344,68 | 5 147 | 339,08 | ||||
| 2025-08-07 | 13F | Parkside Financial Bank & Trust | 54 503 | −24,06 | 2 478 | −24,13 | ||||
| 2025-07-30 | 13F | Avidian Wealth Solutions, LLC | 318 001 | −1,23 | 14 459 | −1,32 | ||||
| 2025-08-01 | 13F | Envestnet Asset Management Inc | 887 784 | −14,53 | 40 368 | −14,61 | ||||
| 2025-08-14 | 13F | Ameriprise Financial Inc | 877 749 | 217,29 | 39 908 | 217,02 | ||||
| 2025-05-12 | 13F | Townsquare Capital Llc | 0 | −100,00 | 0 | |||||
| 2025-07-30 | 13F | Atlantic Edge Private Wealth Management, LLC | 0 | 0 | ||||||
| 2025-08-07 | 13F | Vise Technologies, Inc. | 45 350 | 2 062 | ||||||
| 2025-08-26 | 13F/A | Thrivent Financial For Lutherans | 90 276 | 4 | ||||||
| 2025-08-06 | 13F | Columbia River Financial Group, LLC | 0 | −100,00 | 0 | |||||
| 2025-08-06 | 13F | Commonwealth Equity Services, Llc | 34 164 | 73,55 | 2 | |||||
| 2025-08-13 | 13F | Cerity Partners LLC | 95 014 | −3,43 | 4 320 | −3,51 | ||||
| 2025-08-11 | 13F | Dorsey & Whitney Trust CO LLC | 0 | −100,00 | 0 | |||||
| 2025-08-13 | 13F | Summit Financial, LLC | 8 546 | 36,41 | 389 | 36,14 | ||||
| 2025-05-09 | 13F | Intrust Bank Na | 0 | −100,00 | 0 | |||||
| 2025-07-10 | 13F | Wealth Enhancement Advisory Services, Llc | 643 409 | −6,54 | 29 246 | −6,65 | ||||
| 2025-08-12 | 13F | Proequities, Inc. | 0 | 0 | ||||||
| 2025-08-14 | 13F | Engineers Gate Manager LP | 7 098 | −61,48 | 323 | −61,58 | ||||
| 2025-08-14 | 13F | Clarity Asset Management, Inc. | 354 | 16 | ||||||
| 2025-08-07 | 13F | Winthrop Capital Management, LLC | 1 663 | 0,00 | 0 | |||||
| 2025-08-12 | 13F | Running Point Capital Advisors, LLC | 35 678 | 23,19 | 1 622 | 23,07 | ||||
| 2025-08-14 | 13F | Mml Investors Services, Llc | 67 840 | −26,99 | 3 | −25,00 | ||||
| 2025-07-30 | 13F | Bogart Wealth, LLC | 173 | 0,00 | 8 | 0,00 | ||||
| 2025-08-05 | 13F | NewSquare Capital LLC | 682 | 31 | ||||||
| 2025-07-24 | 13F | IFP Advisors, Inc | 802 | −53,26 | 36 | −53,85 | ||||
| 2025-08-08 | 13F | Hartland & Co., LLC | 79 534 | −9,57 | 3 616 | −9,65 | ||||
| 2025-07-25 | 13F | Envestnet Portfolio Solutions, Inc. | 0 | −100,00 | 0 | |||||
| 2025-08-14 | 13F/A | Rockefeller Capital Management L.P. | 35 676 | 81,33 | 1 622 | 81,23 | ||||
| 2025-08-13 | 13F | Northwestern Mutual Wealth Management Co | 3 636 894 | 47,13 | 165 370 | 47,00 | ||||
| 2025-08-14 | 13F | Susquehanna International Group, Llp | 5 112 | −96,88 | 232 | −96,89 | ||||
| 2025-07-10 | 13F | Fulton Bank, N.a. | 51 670 | 13,98 | 2 349 | 13,86 | ||||
| 2025-08-15 | 13F | Tower Research Capital LLC (TRC) | 9 | 0 | ||||||
| 2025-07-16 | 13F | Beaumont Financial Advisors, LLC | 27 214 | −1,96 | 1 237 | −2,06 | ||||
| 2025-08-18 | 13F | Front Row Advisors LLC | 1 200 | 0,00 | 55 | 0,00 | ||||
| 2025-07-09 | 13F | Fragasso Group Inc. | 35 959 | 1 635 | ||||||
| 2025-08-06 | 13F | Stokes Family Office, LLC | 9 361 | −23,40 | 426 | −23,56 | ||||
| 2025-08-12 | 13F | NFP Retirement, Inc. | 8 994 | −0,48 | 409 | −0,73 | ||||
| 2025-07-28 | 13F | BRYN MAWR TRUST Co | 652 | 0,00 | 30 | 0,00 | ||||
| 2025-08-11 | 13F | Aptus Capital Advisors, LLC | 1 882 | 206,02 | 86 | 214,81 | ||||
| 2025-07-18 | 13F | Northeast Financial Group, Inc. | 0 | −100,00 | 0 | |||||
| 2025-08-12 | 13F | YANKCOM Partnership | 1 272 | 58 | ||||||
| 2025-05-15 | 13F | Buckingham Strategic Partners | 0 | −100,00 | 0 | |||||
| 2025-07-16 | 13F | Perigon Wealth Management, LLC | 14 334 | 652 | ||||||
| 2025-08-14 | 13F | Royal Bank Of Canada | 93 808 | −1,98 | 4 265 | −2,07 | ||||
| 2025-08-04 | 13F | Pensionmark Financial Group, Llc | 10 512 | −12,54 | 478 | −12,64 | ||||
| 2025-08-08 | 13F | Creative Planning | 6 525 | −3,87 | 297 | −3,90 | ||||
| 2025-08-12 | 13F | Global Retirement Partners, LLC | 1 725 | 11,36 | 78 | 9,86 | ||||
| 2025-07-25 | 13F | ONE Advisory Partners, LLC | 12 766 | 26,21 | 578 | 25,65 | ||||
| 2025-08-05 | 13F | Claro Advisors LLC | 0 | −100,00 | 0 | |||||
| 2025-08-19 | 13F | National Asset Management, Inc. | 0 | −100,00 | 0 | |||||
| 2025-08-14 | 13F | UBS Group AG | 317 417 | −2,35 | 14 433 | −2,43 | ||||
| 2025-08-01 | 13F | Brinker Capital Investments, LLC | 0 | −100,00 | 0 | −100,00 | ||||
| 2025-07-21 | 13F | HighMark Wealth Management LLC | 53 | 2 | ||||||
| 2025-08-13 | 13F | Baird Financial Group, Inc. | 4 420 | 201 | ||||||
| 2025-08-07 | 13F | 1620 Investment Advisors, Inc. | 26 729 | −4,60 | 1 215 | −4,71 | ||||
| 2025-08-14 | 13F | Stifel Financial Corp | 319 663 | −4,89 | 14 535 | −4,97 | ||||
| 2025-05-15 | 13F | Lavaca Capital Llc | 0 | −100,00 | 0 | |||||
| 2025-07-29 | 13F | Stephens Inc /ar/ | 7 221 | 2,40 | 328 | 2,50 | ||||
| 2025-08-13 | 13F | First Trust Advisors Lp | 9 540 | −1,27 | 434 | −1,37 | ||||
| 2025-07-08 | 13F | FF Advisors,LLC | 7 381 | 0,00 | 336 | 0,30 | ||||
| 2025-08-08 | 13F | Cetera Investment Advisers | 173 888 | −9,52 | 7 907 | −9,59 | ||||
| 2025-08-08 | 13F | Avantax Advisory Services, Inc. | 20 824 | 50,96 | 947 | 50,88 | ||||
| 2025-08-11 | 13F | Wealthspire Advisors, LLC | 14 001 | 0,00 | 637 | −0,16 | ||||
| 2025-07-22 | 13F | Apexium Financial, Lp | 7 496 | 0,00 | 341 | −0,29 | ||||
| 2025-08-14 | 13F | Hrt Financial Lp | 12 176 | 1 | ||||||
| 2025-07-29 | 13F | Private Trust Co Na | 12 715 | 0,12 | 578 | 0,17 | ||||
| 2025-08-08 | 13F | Avalon Trust Co | 1 100 | 0,00 | 50 | 0,00 | ||||
| 2025-08-14 | 13F | Sargent Investment Group, LLC | 6 926 | 3,51 | 315 | 3,62 | ||||
| 2025-07-24 | 13F | Brandywine Oak Private Wealth Llc | 84 423 | −47,73 | 3 839 | −47,78 | ||||
| 2025-08-14 | 13F | Lazard Asset Management Llc | 1 | 0,00 | ||||||
| 2025-07-09 | 13F | Alesco Advisors Llc | 15 240 | 0,00 | 693 | −0,14 | ||||
| 2025-08-11 | 13F | Principal Securities, Inc. | 70 938 | 7,70 | 3 226 | 6,23 | ||||
| 2025-05-15 | 13F | SIH Partners, LLLP | Call | 0 | −100,00 | 0 | ||||
| 2025-07-09 | 13F | Hardin Capital Partners, LLC | 4 692 | −0,85 | 213 | −0,93 | ||||
| 2025-07-31 | 13F | Optimum Investment Advisors | 10 250 | 0,00 | 466 | 0,00 | ||||
| 2025-08-12 | 13F | AlphaCore Capital LLC | 1 062 | 0,00 | 48 | 0,00 | ||||
| 2025-04-14 | 13F | Kennebec Savings Bank | 0 | −100,00 | 0 | |||||
| 2025-08-08 | 13F | Condor Capital Management | 7 379 | −97,00 | 336 | −97,00 | ||||
| 2025-07-21 | 13F | Ameritas Advisory Services, LLC | 1 183 | 54 | ||||||
| 2025-07-16 | 13F | Northern Oak Wealth Management Inc | 11 148 | −16,49 | 507 | −16,64 | ||||
| 2025-08-12 | 13F | Clearwater Capital Advisors, LLC | 11 351 | −1,09 | 516 | −1,15 | ||||
| 2025-08-14 | 13F | Ancora Advisors, LLC | 1 190 | −3,33 | 54 | −3,57 | ||||
| 2025-08-06 | 13F | Atlantic Union Bankshares Corp | 57 | 3 | ||||||
| 2025-04-17 | 13F | Warther Private Wealth, LLC | 0 | −100,00 | 0 | |||||
| 2025-07-17 | 13F | Keystone Global Partners, LLC | 0 | −100,00 | 0 | |||||
| 2025-08-15 | 13F | Morgan Stanley | 716 287 | 4,98 | 32 570 | 4,89 | ||||
| 2025-07-10 | 13F | Global Financial Private Client, LLC | 0 | −100,00 | 0 | |||||
| 2025-08-12 | 13F | Ameritas Investment Partners, Inc. | 14 430 | −6,27 | 656 | −6,29 | ||||
| 2025-08-14 | 13F | Warren Averett Asset Management, LLC | 44 674 | 53,03 | 2 031 | 52,94 | ||||
| 2025-08-06 | 13F | Hallmark Capital Management Inc | 0 | −100,00 | 0 | |||||
| 2025-08-14 | 13F | Bank Of America Corp /de/ | 14 995 417 | −2,64 | 681 842 | −2,73 | ||||
| 2025-08-14 | 13F | Integrated Wealth Concepts LLC | 19 093 | 10,99 | 868 | 11,00 | ||||
| 2025-07-16 | 13F | Signaturefd, Llc | 130 | 0,00 | 6 | 0,00 | ||||
| 2025-08-13 | 13F | Rsm Us Wealth Management Llc | 38 564 | 136,02 | 1 754 | 135,94 | ||||
| 2025-07-14 | 13F | Park Avenue Securities Llc | 101 524 | −7,76 | 5 | −20,00 | ||||
| 2025-07-24 | 13F | Us Bancorp \de\ | 1 279 | −95,57 | 58 | −95,59 | ||||
| 2025-08-12 | 13F | Jpmorgan Chase & Co | 401 796 | −35,84 | 18 270 | −35,90 | ||||
| 2025-08-14 | 13F | Aqr Capital Management Llc | 9 386 | 73,14 | 427 | 73,17 | ||||
| 2025-07-22 | 13F | Old National Bancorp /in/ | 127 818 | −28,42 | 5 812 | −28,49 | ||||
| 2025-08-13 | 13F | Continuum Advisory, LLC | 0 | −100,00 | 0 | |||||
| 2025-07-31 | 13F | Cambridge Investment Research Advisors, Inc. | 37 939 | −39,08 | 2 | −50,00 | ||||
| 2025-08-12 | 13F | Cornerstone Wealth Management, LLC | 67 998 | −1,40 | 3 092 | −1,50 | ||||
| 2025-05-09 | 13F | CoreCap Advisors, LLC | 0 | −100,00 | 0 | |||||
| 2025-08-06 | 13F | AE Wealth Management LLC | 475 | 22 | ||||||
| 2025-08-14 | 13F/A | Skopos Labs, Inc. | 937 | 43 | ||||||
| 2025-07-18 | 13F | Truist Financial Corp | 76 933 | −12,34 | 3 498 | −12,42 | ||||
| 2025-08-11 | 13F | Nations Financial Group Inc, /ia/ /adv | 7 075 | −6,01 | 322 | −6,14 | ||||
| 2025-05-09 | 13F | GeoWealth Management, LLC | 0 | −100,00 | 0 | |||||
| 2025-08-08 | 13F | Gts Securities Llc | 14 776 | 672 | ||||||
| 2025-08-12 | 13F | LPL Financial LLC | 1 937 260 | 6,53 | 88 087 | 6,43 | ||||
| 2025-08-14 | 13F | Synovus Financial Corp | 8 273 | −14,93 | 376 | −14,93 | ||||
| 2025-07-24 | 13F | Ronald Blue Trust, Inc. | 314 | 361,76 | 14 | 366,67 | ||||
| 2025-05-15 | 13F | Prospera Financial Services Inc | 0 | −100,00 | 0 | |||||
| 2025-07-22 | 13F | Merit Financial Group, LLC | 9 837 | −16,37 | 447 | −16,45 | ||||
| 2025-08-01 | 13F | James Investment Research Inc | 0 | −100,00 | 0 | |||||
| 2025-08-11 | 13F | Private Advisor Group, LLC | 14 223 | −10,83 | 647 | −10,90 | ||||
| 2025-08-14 | 13F | Clark Capital Management Group, Inc. | 142 114 | −2,79 | 6 462 | −2,89 | ||||
| 2025-08-05 | 13F | Westside Investment Management, Inc. | 20 251 | −5,26 | 921 | −5,35 | ||||
| 2025-07-29 | 13F | Mattson Financial Services, LLC | 0 | −100,00 | 0 | |||||
| 2025-08-13 | 13F | Willis Johnson & Associates, Inc. | 626 341 | 19,74 | 28 480 | 19,63 | ||||
| 2025-08-13 | 13F | Quadrature Capital Ltd | 14 669 | 667 | ||||||
| 2025-07-23 | 13F | Steel Peak Wealth Management LLC | 59 887 | 2,57 | 2 723 | 2,48 | ||||
| 2025-07-28 | 13F | Axxcess Wealth Management, Llc | 79 696 | 1 608,38 | 3 624 | 1 608,96 | ||||
| 2025-07-08 | 13F | Gradient Investments LLC | 9 802 | 9,97 | 446 | 9,88 | ||||
| 2025-08-13 | 13F | Baker Avenue Asset Management, LP | 21 301 | 1,87 | 969 | 1,79 | ||||
| 2025-07-28 | 13F | Davidson Investment Advisors | 350 047 | 0,11 | 15 917 | 0,02 | ||||
| 2025-08-14 | 13F | Hilltop Holdings Inc. | 9 998 | −5,79 | 455 | −5,81 | ||||
| 2025-08-14 | 13F | Old Mission Capital Llc | 31 037 | 1 411 | ||||||
| 2025-07-30 | 13F | Rehmann Capital Advisory Group | 8 408 | −2,19 | 382 | −2,30 | ||||
| 2025-08-14 | 13F | Citadel Advisors Llc | Put | 0 | −100,00 | 0 | ||||
| 2025-08-06 | 13F | First Horizon Advisors, Inc. | 5 242 | 9,28 | 238 | 9,17 | ||||
| 2025-08-12 | 13F | Ameraudi Asset Management, Inc. | 11 400 | 0,00 | 518 | 0,00 | ||||
| 2025-07-15 | 13F | Sheets Smith Wealth Management | 13 600 | 0,00 | 618 | 0,00 | ||||
| 2025-07-24 | 13F | Jfs Wealth Advisors, Llc | 3 043 | −41,98 | 138 | −42,02 | ||||
| 2025-07-24 | 13F | Robertson Stephens Wealth Management, LLC | 4 457 | 0,00 | 203 | 0,00 | ||||
| 2025-08-08 | 13F | Pnc Financial Services Group, Inc. | 2 | −98,92 | 0 | −100,00 | ||||
| 2025-08-14 | 13F | Comerica Bank | 23 310 | 2,55 | 1 060 | 2,42 | ||||
| 2025-07-24 | 13F | Blair William & Co/il | 200 | 0,00 | 9 | 0,00 | ||||
| 2025-07-25 | 13F | Cwm, Llc | 27 076 | 0,00 | 1 | 0,00 | ||||
| 2025-07-21 | 13F | Empirical Financial Services, LLC d.b.a. Empirical Wealth Management | 15 874 | −34,60 | 722 | −34,69 | ||||
| 2025-08-05 | 13F | Huntington National Bank | 0 | |||||||
| 2025-08-14 | 13F | Mercer Global Advisors Inc /adv | 0 | −100,00 | 0 | |||||
| 2025-07-09 | 13F | Hummer Financial Advisory Services Inc | 8 750 | 0,00 | 398 | −0,25 | ||||
| 2025-08-11 | 13F | Strategic Wealth Partners, Ltd. | 255 | 12 | ||||||
| 2025-07-25 | 13F | Ackerman Capital Advisors, LLC | 0 | −100,00 | 0 | |||||
| 2025-07-17 | 13F | XML Financial, LLC | 26 483 | −6,51 | 1 204 | −6,59 | ||||
| 2025-07-29 | 13F | Activest Wealth Management | 0 | 0 | ||||||
| 2025-05-14 | 13F | Orion Portfolio Solutions, LLC | 7 398 | 0,00 | 341 | 0,00 | ||||
| 2025-08-14 | 13F | Citadel Advisors Llc | 10 281 | −98,25 | 467 | −98,25 | ||||
| 2025-08-15 | 13F | Fft Wealth Management Llc | 0 | −100,00 | 0 | |||||
| 2025-07-30 | 13F | Strategic Blueprint, LLC | 15 663 | −49,05 | 712 | −49,07 | ||||
| 2025-08-14 | 13F | Fmr Llc | 808 015 | 7,39 | 36 740 | 7,30 | ||||
| 2025-08-14 | 13F | Smartleaf Asset Management LLC | 485 | 0,00 | 22 | 0,00 | ||||
| 2025-08-14 | 13F | Qube Research & Technologies Ltd | 2 953 | 108,69 | 134 | 109,38 | ||||
| 2025-08-01 | 13F | Financial Counselors Inc | 0 | −100,00 | 0 | |||||
| 2025-04-24 | 13F | Park Place Capital Corp | 0 | −100,00 | 0 | |||||
| 2025-07-30 | 13F | LGT Financial Advisors LLC | 0 | −100,00 | 0 | |||||
| 2025-08-13 | 13F | Idaho Trust Bank | 38 264 | −2,73 | 1 740 | −2,79 |
Other Listings
| MX:ITM |