Grunnleggende statistikk
| Institusjonelle eiere | 332 total, 331 long only, 0 short only, 1 long/short - change of 2,77% MRQ |
| Gjennomsnittlig porteføljeallokering | 0.3176 % - change of −17,35% MRQ |
| Institusjonelle aksjer (Long) | 45 600 883 (ex 13D/G) - change of −1,28MM shares −2,73% MRQ |
| Institusjonell verdi (Long) | $ 4 827 772 USD ($1000) |
Institusjonelt eierskap og aksjonærer
iShares Trust - iShares Global 100 ETF (US:IOO) har 332 institusjonelle eiere og aksjonærer som har sendt inn 13D/G- eller 13F-skjemaer til Securities Exchange Commission (SEC). Disse institusjonene eier til sammen 45,600,883 aksjer. De største aksjonærene inkluderer BlackRock, Inc., Northwestern Mutual Wealth Management Co, Annex Advisory Services, LLC, Amplius Wealth Advisors, LLC, Morgan Stanley, LPL Financial LLC, Bank Of America Corp /de/, Raymond James Financial Inc, Envestnet Asset Management Inc, and UBS Group AG .
iShares Trust - iShares Global 100 ETF (ARCA:IOO) institusjonell eierstruktur viser nåværende posisjoner i selskapet fordelt på institusjoner og fond, samt de siste endringene i posisjonsstørrelse. De største aksjonærene kan være individuelle investorer, verdipapirfond, hedgefond eller institusjoner. Schedule 13D indikerer at investoren eier (eller har eid) mer enn 5 % av selskapet og har til hensikt (eller hadde til hensikt) å aktivt forfølge en endring i forretningsstrategien. Schedule 13G indikerer en passiv investering på over 5 %.
The share price as of September 10, 2025 is 116,76 / share. Previously, on September 11, 2024, the share price was 95,77 / share. This represents an increase of 21,92% over that period.

Fondssentiment-score
Fondssentiment Score (også kjent som akkumulering av eierskap poengsum) viser hvilke aksjer som er mest kjøpt av fond. Den er resultatet av en sofistikert, kvantitativ flerfaktormodell som identifiserer selskaper med de høyeste nivåene av institusjonell akkumulering. Beregningsmodellen for poeng bruker en kombinasjon av den totale økningen i antall offentliggjorte eiere, endringer i porteføljeallokeringen til disse eierne og andre beregninger. Tallet går fra 0 til 100, der høyere tall indikerer en høyere grad av akkumulering i forhold til sammenlignbare selskaper, der 50 er gjennomsnittet.
Oppdateringsfrekvens: Daglig
Sjekk ut Ownership Explorer, som inneholder en liste over de høyest rangerte selskapene.
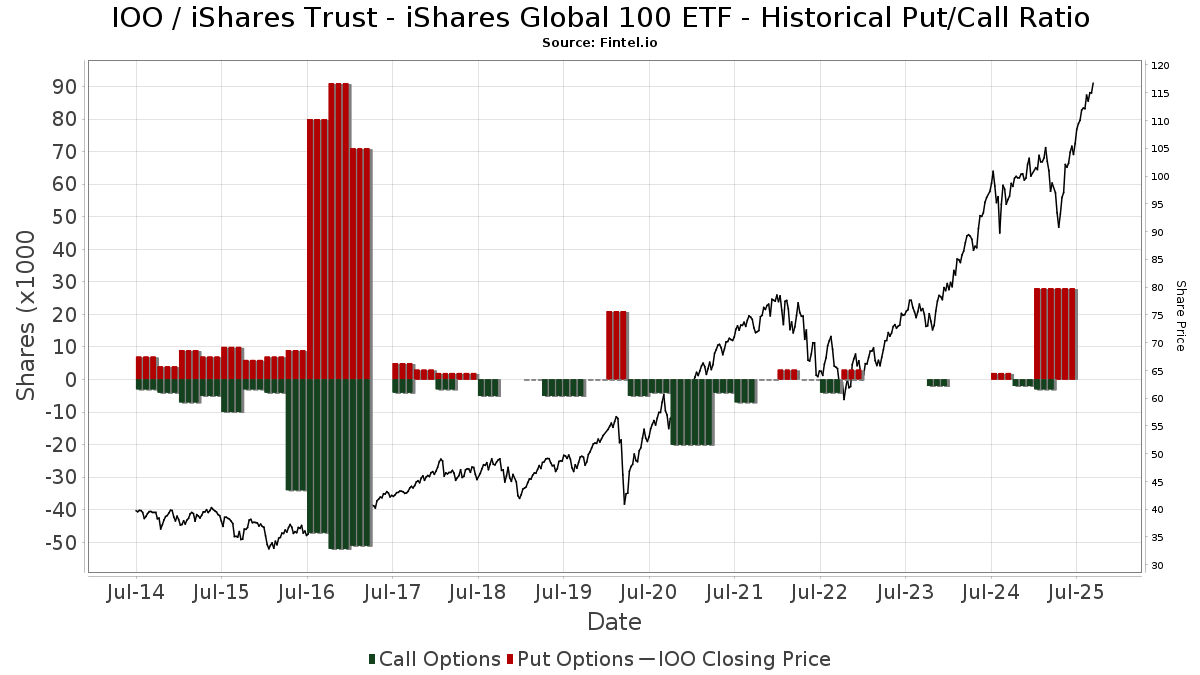
Institusjonell Put/Call-forhold
I tillegg til å rapportere standard aksje- og gjeldsemisjoner må institusjoner med mer enn 100 millioner kroner i forvaltningskapital også oppgi beholdningen av put- og callopsjoner. Siden put-opsjoner generelt indikerer et negativt sentiment, og call-opsjoner indikerer et positivt sentiment, kan vi få et inntrykk av det generelle institusjonelle sentimentet ved å plotte forholdet mellom put- og call-opsjoner. Diagrammet til høyre viser det historiske forholdet mellom put- og call-opsjoner for dette instrumentet.
Ved å bruke Put/Call-forholdet som en indikator på investorsentimentet kan man overvinne en av de viktigste svakhetene ved å bruke totalt institusjonelt eierskap, nemlig at en betydelig andel av forvaltningskapitalen investeres passivt for å følge indekser. Passivt forvaltede fond kjøper vanligvis ikke opsjoner, slik at indikatoren for put/call-forhold i større grad gjenspeiler stemningen i aktivt forvaltede fond.
13D/G-arkiveringer
Vi presenterer 13D/G-arkiveringene separat fra 13F-arkiveringene fordi de behandles forskjellig av SEC. 13D/G-arkiveringene kan sendes inn av grupper av investorer (med én leder), mens 13D/G-arkiveringene ikke kan sendes inn. Dette fører til situasjoner der en investor kan sende inn en 13D/G-rapport med én verdi for alle aksjene (som representerer alle aksjene som eies av investorgruppen), men deretter sende inn en 13F-melding med en annen verdi for alle aksjene (som kun representerer deres eget eierskap). Dette betyr at aksjeeierskap i 13D/G-arkiveringene og 13F-arkiveringene ofte ikke er direkte sammenlignbare, og vi presenterer dem derfor separat.
Merk: Fra og med 16. mai 2021 viser vi ikke lenger eiere som ikke har sendt inn en 13D/G i løpet av det siste året. Tidligere viste vi hele historikken for 13D/G-arkiveringer. Generelt må enheter som er pålagt å sende inn 13D/G-arkiveringer, sende inn minst én gang i året før de sender inn en avsluttende rapport. Det hender imidlertid at fond trekker seg ut av posisjoner uten å sende inn en avsluttende innlevering (dvs. at de avvikler), slik at visning av hele historikken av og til fører til forvirring om det nåværende eierskapet. For å unngå forvirring viser vi nå bare "nåværende" eiere, det vil si eiere som har sendt inn informasjon i løpet av det siste året.
Upgrade to unlock premium data.
| Fildato | Skjema | Investor | Tidligere aksjer |
Siste aksjer |
Δ Aksjer (prosent) |
Eierandel (prosent) |
Δ Eierandel (prosent) |
|
|---|---|---|---|---|---|---|---|---|
| 2025-07-17 | BlackRock, Inc. | 24,932,243 | 27,384,813 | 9.84 | 44.70 | 4.44 |
13F- og NPORT-arkiveringer
Detaljer om 13F-arkiveringer er gratis. Detaljer om NP-arkiveringer krever et premium-medlemskap. Grønne rader indikerer nye posisjoner. Røde rader indikerer lukkede posisjoner. Klikk på lenke ikonet for å se hele transaksjonshistorikken.
Oppgrader
for å låse opp premiedata og eksportere til Excel. ![]() .
.
| Fildato | Kilde | Investor | Type | Gjennomsnittlig pris (estimert) |
Aksjer | Δ Aksjer (%) |
Rapportert verdi ($1000) | Verdi (%) | Portallokering (%) | |
|---|---|---|---|---|---|---|---|---|---|---|
| 2025-08-13 | 13F | BlackDiamond Wealth Management Inc. | 3 388 | 41,05 | 364 | 55,56 | ||||
| 2025-08-07 | 13F | Allworth Financial LP | 1 681 | 0,00 | 181 | 13,84 | ||||
| 2025-08-13 | 13F | Capital International Investors | 18 604 | −31,39 | 2 001 | −23,31 | ||||
| 2025-08-13 | 13F | Financial Freedom, LLC | 6 052 | 31,37 | 652 | 47,18 | ||||
| 2025-08-14 | 13F | EP Wealth Advisors, Inc. | 5 133 | 1,64 | 553 | 13,79 | ||||
| 2025-04-29 | 13F | Hm Payson & Co | 200 | 0,00 | 19 | −5,00 | ||||
| 2025-07-30 | 13F | Cullen/frost Bankers, Inc. | 1 838 | 0,71 | 198 | 13,14 | ||||
| 2025-08-08 | 13F | Hudock, Inc. | 102 854 | 31,86 | 11 089 | 47,64 | ||||
| 2025-07-29 | 13F | Stratos Wealth Partners, LTD. | 10 786 | −0,04 | 1 163 | 11,95 | ||||
| 2025-08-05 | 13F | GPS Wealth Strategies Group, LLC | 0 | −100,00 | 0 | |||||
| 2025-08-08 | 13F | Kingsview Wealth Management, LLC | 9 988 | 2,00 | 1 077 | 14,23 | ||||
| 2025-08-08 | 13F | Kane Investment Management, Inc. | 14 926 | −3,72 | 1 609 | 7,84 | ||||
| 2025-08-06 | 13F | Golden State Wealth Management, LLC | 11 059 | 1 192 | ||||||
| 2025-07-30 | 13F/A | KPP Advisory Services LLC | 9 206 | −7,39 | 993 | 3,66 | ||||
| 2025-08-14 | 13F | Goldman Sachs Group Inc | 9 384 | 0,07 | 1 012 | 12,08 | ||||
| 2025-08-28 | NP | TFAGX - TFA AlphaGen Growth Fund Class I | 1 550 | 167 | ||||||
| 2025-07-15 | 13F | Main Street Group, LTD | 51 | 0,00 | 6 | 25,00 | ||||
| 2025-07-15 | 13F | Revisor Wealth Management LLC | 2 947 | 0,00 | 323 | 14,13 | ||||
| 2025-08-05 | 13F | Bank Of Montreal /can/ | 133 147 | 1,70 | 14 355 | 13,87 | ||||
| 2025-08-06 | 13F | Mascagni Wealth Management, Inc. | 3 904 | −42,00 | 421 | −35,19 | ||||
| 2025-07-14 | 13F | AdvisorNet Financial, Inc | 745 | −31,96 | 80 | −23,81 | ||||
| 2025-05-12 | 13F | Independent Advisor Alliance | 0 | −100,00 | 0 | |||||
| 2025-04-17 | 13F | Sfm, Llc | 0 | −100,00 | 0 | |||||
| 2025-07-25 | 13F | Envestnet Portfolio Solutions, Inc. | 11 567 | 10,35 | 1 247 | 23,59 | ||||
| 2025-07-29 | 13F | Chicago Partners Investment Group LLC | 10 172 | −18,23 | 1 138 | −5,72 | ||||
| 2025-08-11 | 13F | HHM Wealth Advisors, LLC | 5 106 | 0,00 | 550 | 12,02 | ||||
| 2025-08-11 | 13F | Greykasell Wealth Strategies, Inc. | 93 779 | 2,90 | 10 110 | 15,21 | ||||
| 2025-08-04 | 13F | Creative Financial Designs Inc /adv | 29 970 | −92,32 | 3 231 | −91,40 | ||||
| 2025-08-13 | 13F | Capital Analysts, Inc. | 12 | 0 | ||||||
| 2025-08-18 | 13F | Geneos Wealth Management Inc. | 10 775 | 60,10 | 1 162 | 79,17 | ||||
| 2025-07-31 | 13F | Cambridge Investment Research Advisors, Inc. | 84 254 | −29,76 | 9 | −18,18 | ||||
| 2025-08-14 | 13F | Ameriprise Financial Inc | 275 466 | −39,51 | 29 702 | −32,46 | ||||
| 2025-08-13 | 13F | Per Stirling Capital Management, LLC. | 3 350 | −8,19 | 361 | 2,85 | ||||
| 2025-08-14 | 13F | Main Street Financial Solutions, LLC | 10 572 | 0,00 | 1 140 | 12,00 | ||||
| 2025-08-15 | 13F | First Heartland Consultants, Inc. | 7 901 | −2,54 | 852 | 9,10 | ||||
| 2025-07-10 | 13F | Wealth Enhancement Advisory Services, Llc | 146 056 | −0,84 | 15 964 | 12,56 | ||||
| 2025-08-06 | 13F | Commonwealth Equity Services, Llc | 180 405 | −7,94 | 19 | 5,56 | ||||
| 2025-05-06 | 13F | Ignite Planners, LLC | 0 | −100,00 | 0 | −100,00 | ||||
| 2025-07-15 | 13F | Hidden Cove Wealth Management, LLC | 27 906 | −51,54 | 3 009 | −45,75 | ||||
| 2025-08-13 | 13F | M&t Bank Corp | 2 359 | 0,00 | 254 | 11,89 | ||||
| 2025-08-06 | 13F | OneAscent Wealth Management LLC | 3 024 | −43,72 | 0 | |||||
| 2025-08-14 | 13F | Mercer Global Advisors Inc /adv | 12 650 | 5,89 | 1 364 | 18,52 | ||||
| 2025-07-24 | 13F | Capital Advisors, Ltd. LLC | 50 415 | −0,98 | 5 | 25,00 | ||||
| 2025-04-22 | 13F | Synergy Financial Management, LLC | 0 | −100,00 | 0 | |||||
| 2025-08-11 | 13F | Howard Wealth Management, Llc | 12 786 | −2,18 | 1 378 | 9,54 | ||||
| 2025-08-01 | 13F | Jennison Associates Llc | 0 | −100,00 | 0 | |||||
| 2025-08-12 | 13F | SRS Capital Advisors, Inc. | 10 | 0,00 | 45 | |||||
| 2025-05-12 | 13F | Aveo Capital Partners, LLC | 0 | −100,00 | 0 | |||||
| 2025-08-13 | 13F | Schroder Investment Management Group | 67 016 | −0,78 | 7 207 | 10,91 | ||||
| 2025-08-15 | 13F | Asset Allocation Strategies LLC | 136 777 | 8,15 | 14 746 | 21,09 | ||||
| 2025-07-23 | 13F | Pillar Financial Advisors, LLC | 845 | 0,00 | 91 | 12,35 | ||||
| 2025-08-12 | 13F | Founders Financial Alliance, LLC | 0 | −100,00 | 0 | |||||
| 2025-07-28 | 13F | Rosenberg Matthew Hamilton | 704 | 76 | ||||||
| 2025-08-08 | 13F | Thoroughbred Financial Services, Llc | 106 283 | −12,02 | 11 | 0,00 | ||||
| 2025-08-14 | 13F | UBS Group AG | 364 458 | −0,12 | 39 292 | 11,83 | ||||
| 2025-08-15 | 13F | Semmax Financial Advisors Inc. | 657 | 0,61 | 75 | 17,46 | ||||
| 2025-07-16 | 13F | St Germain D J Co Inc | 140 | 141,38 | 15 | 200,00 | ||||
| 2025-07-17 | 13F | Montis Financial, LLC | 12 770 | 0,00 | 1 377 | 11,96 | ||||
| 2025-07-30 | 13F | SkyOak Wealth, LLC | 3 513 | 0,69 | 379 | 12,84 | ||||
| 2025-08-14 | 13F | Susquehanna International Group, Llp | Call | 0 | −100,00 | 0 | ||||
| 2025-08-07 | 13F | Kestra Private Wealth Services, Llc | 100 589 | −12,82 | 10 844 | −2,39 | ||||
| 2025-08-08 | 13F | Fortis Group Advisors, LLC | 14 880 | −5,81 | 1 661 | 9,20 | ||||
| 2025-08-14 | 13F | Aqr Capital Management Llc | 16 694 | 24,08 | 1 800 | 38,92 | ||||
| 2025-08-12 | 13F | OneAscent Financial Services LLC | 5 644 | −51,85 | 1 | −100,00 | ||||
| 2025-07-17 | 13F | Janney Montgomery Scott LLC | 40 355 | 0,00 | 4 | 33,33 | ||||
| 2025-08-12 | 13F | Ameritas Investment Partners, Inc. | 552 | 120,80 | 59 | 145,83 | ||||
| 2025-08-14 | 13F | Citadel Advisors Llc | 277 641 | 876,44 | 29 932 | 993,61 | ||||
| 2025-08-06 | 13F | Marco Investment Management Llc | 2 000 | 216 | ||||||
| 2025-08-05 | 13F | MidAtlantic Capital Management, Inc. | 5 331 | −3,32 | 575 | 8,30 | ||||
| 2025-07-15 | 13F | Avaii Wealth Management, Llc | 5 984 | 0,00 | 645 | 11,98 | ||||
| 2025-07-30 | 13F | Bleakley Financial Group, LLC | 29 541 | 12,92 | 3 185 | 26,45 | ||||
| 2025-07-23 | 13F | RiverTree Advisors, LLC | 2 983 | −33,87 | 322 | −26,04 | ||||
| 2025-07-23 | 13F | Valmark Advisers, Inc. | 3 057 | −95,59 | 330 | −95,07 | ||||
| 2025-08-12 | 13F | O'shaughnessy Asset Management, Llc | 7 242 | −2,73 | 781 | 8,94 | ||||
| 2025-08-14 | 13F | Glenmede Investment Management, LP | 5 399 | 582 | ||||||
| 2025-07-24 | 13F | Us Bancorp \de\ | 14 567 | 0,61 | 1 571 | 12,63 | ||||
| 2025-07-28 | 13F | Harbour Investments, Inc. | 22 807 | −5,75 | 2 459 | 5,49 | ||||
| 2025-07-22 | 13F | Powell Investment Advisors, LLC | 29 364 | 233,83 | 3 166 | 274,11 | ||||
| 2025-08-08 | 13F | Evolution Wealth Advisors, LLC | 8 254 | 0,00 | 890 | 11,96 | ||||
| 2025-07-15 | 13F | CHB Investment Group, LLC | 18 933 | −0,96 | 2 | 100,00 | ||||
| 2025-07-31 | 13F | Glass Jacobson Investment Advisors llc | 351 | −91,52 | 38 | −91,13 | ||||
| 2025-08-14 | 13F | Mariner, LLC | 85 102 | 1,97 | 9 175 | 14,16 | ||||
| 2025-07-22 | 13F | Merit Financial Group, LLC | 19 839 | −59,59 | 2 139 | −54,77 | ||||
| 2025-08-13 | 13F | Beacon Pointe Advisors, LLC | 4 235 | 0,00 | 457 | 12,04 | ||||
| 2025-08-14 | 13F | Visionary Wealth Advisors | 21 389 | 8,83 | 2 306 | 21,83 | ||||
| 2025-05-05 | 13F | Csenge Advisory Group | 0 | −100,00 | 0 | −100,00 | ||||
| 2025-08-05 | 13F | Huntington National Bank | 290 | 18,93 | ||||||
| 2025-08-28 | NP | GPTCX - GuidePath(R) Conservative Allocation Fund Service Shares | 48 083 | −3,35 | 5 184 | 8,20 | ||||
| 2025-07-17 | 13F | Bluesphere Advisors, LLC | 77 301 | −1,17 | 8 334 | 10,65 | ||||
| 2025-08-05 | 13F | Simplex Trading, Llc | 10 | 0 | ||||||
| 2025-05-01 | 13F | Lane & Associates LLC | 3 656 | 0,00 | 352 | −5,63 | ||||
| 2025-07-24 | 13F | Ronald Blue Trust, Inc. | 800 | 0,00 | 86 | 11,69 | ||||
| 2025-08-12 | 13F | Deutsche Bank Ag\ | 203 | 0,00 | 22 | 10,53 | ||||
| 2025-08-14 | 13F | Stifel Financial Corp | 14 154 | 21,94 | 1 526 | 36,53 | ||||
| 2025-07-14 | 13F | Matrix Trust Co | 8 529 | 1 | ||||||
| 2025-07-21 | 13F | Ntv Asset Management Llc | 5 430 | 0,00 | 585 | 12,07 | ||||
| 2025-08-08 | 13F | Glassman Wealth Services | 446 | 0,00 | 48 | 14,29 | ||||
| 2025-08-14 | 13F | Money Concepts Capital Corp | 88 161 | 9 505 | ||||||
| 2025-08-28 | NP | TFAFX - Tactical Growth Allocation Fund Class I | 420 | 45 | ||||||
| 2025-09-04 | 13F/A | Advisor Group Holdings, Inc. | 163 667 | −13,31 | 17 627 | −3,05 | ||||
| 2025-07-08 | 13F | Parallel Advisors, LLC | 4 959 | 0,02 | 535 | 11,95 | ||||
| 2025-07-11 | 13F | Thomasville National Bank | 0 | −100,00 | 0 | |||||
| 2025-04-22 | 13F | Bright Futures Wealth Management, LLC. | 3 216 | 288 | ||||||
| 2025-07-23 | 13F | Kingswood Wealth Advisors, Llc | 44 950 | −4,72 | 4 846 | 6,30 | ||||
| 2025-07-24 | 13F | Mainstay Capital Management Llc /adv | 4 122 | 53,46 | 444 | 72,09 | ||||
| 2025-08-12 | 13F | Proequities, Inc. | 0 | 0 | ||||||
| 2025-07-24 | 13F | Blair William & Co/il | 2 162 | −36,95 | 233 | −29,39 | ||||
| 2025-08-12 | 13F | J.w. Cole Advisors, Inc. | 3 476 | −3,42 | 375 | 8,09 | ||||
| 2025-08-13 | 13F | Gamco Investors, Inc. Et Al | 16 800 | 0,00 | 1 811 | 12,00 | ||||
| 2025-08-14 | 13F | Warren Averett Asset Management, LLC | 11 138 | −25,68 | 1 201 | −16,84 | ||||
| 2025-08-05 | 13F | Dunhill Financial, LLC | 47 | −2,08 | 5 | 25,00 | ||||
| 2025-07-23 | 13F | Joel Isaacson & Co., LLC | 2 273 | 0,00 | 245 | 12,39 | ||||
| 2025-08-07 | 13F | Rathbone Brothers plc | 24 225 | 3,21 | 2 612 | 15,53 | ||||
| 2025-07-31 | 13F | Ground Swell Capital, LLC | 5 496 | 9,26 | 593 | 22,31 | ||||
| 2025-08-04 | 13F | AlphaStar Capital Management, LLC | 3 737 | 403 | ||||||
| 2025-07-17 | 13F | HB Wealth Management, LLC | 2 608 | 0,00 | 281 | 11,95 | ||||
| 2025-08-08 | 13F | Meridian Wealth Management, LLC | 38 565 | −34,07 | 4 158 | −26,19 | ||||
| 2025-08-08 | 13F | Hartland & Co., LLC | 200 | 0,00 | 22 | 10,53 | ||||
| 2025-08-14 | 13F | Hilltop Holdings Inc. | 3 395 | 366 | ||||||
| 2025-08-11 | 13F | Brown Brothers Harriman & Co | 45 245 | 0,00 | 4 878 | 11,96 | ||||
| 2025-07-24 | 13F | Fischer Investment Strategies, Llc | 14 291 | 49,96 | 1 541 | 67,94 | ||||
| 2025-08-04 | 13F | Daymark Wealth Partners, Llc | 3 645 | −1,62 | 393 | 10,11 | ||||
| 2025-07-09 | 13F | Dynamic Advisor Solutions LLC | 3 349 | −0,86 | 361 | 11,08 | ||||
| 2025-08-13 | 13F | Renaissance Technologies Llc | 0 | −100,00 | 0 | |||||
| 2025-07-22 | 13F | Old National Bancorp /in/ | 93 516 | −42,12 | 10 082 | −35,20 | ||||
| 2025-08-04 | 13F | Kovack Advisors, Inc. | 2 000 | 216 | ||||||
| 2025-08-12 | 13F/A | Cozad Asset Management Inc | 3 160 | 341 | ||||||
| 2025-07-31 | 13F | WFA Asset Management Corp | 2 141 | 0,66 | 207 | 8,42 | ||||
| 2025-07-07 | 13F | First Community Trust Na | 4 204 | 0,00 | 453 | 12,13 | ||||
| 2025-07-30 | NP | LEXI - Alexis Practical Tactical ETF | 65 676 | 3,99 | 6 753 | 5,02 | ||||
| 2025-08-14 | 13F | Wells Fargo & Company/mn | 159 133 | −9,52 | 17 156 | 1,31 | ||||
| 2025-08-12 | 13F | Weaver Consulting Group | 4 916 | −7,07 | 530 | 3,93 | ||||
| 2025-08-18 | 13F | Hershey Financial Advisers, LLC | 4 245 | 458 | ||||||
| 2025-08-18 | 13F | N.E.W. Advisory Services LLC | 156 | 0,00 | 17 | 6,67 | ||||
| 2025-07-21 | 13F | Cape Cod Five Cents Savings Bank | 12 489 | 0,00 | 1 238 | 0,00 | ||||
| 2025-07-21 | 13F | DMKC Advisory Services, LLC | 7 644 | 845 | ||||||
| 2025-08-12 | 13F | MAI Capital Management | 4 181 | 0,00 | 451 | 11,94 | ||||
| 2025-08-14 | 13F | Lazard Asset Management Llc | 107 | −89,89 | 0 | |||||
| 2025-08-14 | 13F | Bank Of America Corp /de/ | 833 249 | 1,66 | 89 833 | 13,82 | ||||
| 2025-05-12 | 13F | Sandy Spring Bank | 156 | 15 | ||||||
| 2025-08-11 | 13F | Aptus Capital Advisors, LLC | 316 | 0,00 | 34 | 13,33 | ||||
| 2025-07-25 | 13F | Atria Wealth Solutions, Inc. | 29 022 | 12,18 | 3 130 | 25,61 | ||||
| 2025-08-14 | 13F | Comerica Bank | 3 797 | −8,02 | 409 | 3,02 | ||||
| 2025-07-24 | 13F | Trust Co Of Toledo Na /oh/ | 99 | 11 | ||||||
| 2025-08-13 | 13F | Marshall Wace, Llp | 18 575 | 2 003 | ||||||
| 2025-07-17 | 13F | Nelson, Van Denburg & Campbell Wealth Management Group, LLC | 8 141 | −4,66 | 878 | 6,69 | ||||
| 2025-08-01 | 13F | Envestnet Asset Management Inc | 387 294 | 11,73 | 41 754 | 25,10 | ||||
| 2025-08-11 | 13F | TD Waterhouse Canada Inc. | 21 385 | 1,31 | 2 299 | 12,81 | ||||
| 2025-07-10 | 13F | Legacy Financial Strategies, LLC | 6 518 | 0,00 | 703 | 11,96 | ||||
| 2025-08-13 | 13F | Baird Financial Group, Inc. | 19 536 | −45,75 | 2 106 | −39,26 | ||||
| 2025-08-13 | 13F | Johnson Financial Group, Inc. | 164 | 18 | ||||||
| 2025-07-11 | 13F | SILVER OAK SECURITIES, Inc | 48 879 | −52,45 | 5 270 | −46,71 | ||||
| 2025-07-23 | 13F | Arcadia Investment Advisors Llc | 19 587 | −1,04 | 2 112 | 10,81 | ||||
| 2025-08-12 | 13F | Walled Lake Planning & Wealth Management, Llc | 6 863 | −13,15 | 740 | −2,76 | ||||
| 2025-08-14 | 13F | Legacy Advisory Services, LLC | 18 502 | 5,32 | 1 995 | 17,92 | ||||
| 2025-07-16 | 13F | Perigon Wealth Management, LLC | 37 920 | −1,15 | 4 088 | 10,70 | ||||
| 2025-08-29 | 13F | Centaurus Financial, Inc. | 49 305 | −57,45 | 5 | −54,55 | ||||
| 2025-07-18 | 13F | Dogwood Wealth Management LLC | 3 693 | −93,88 | 400 | −93,11 | ||||
| 2025-07-08 | 13F | Nbc Securities, Inc. | 226 | −21,80 | 0 | |||||
| 2025-08-12 | 13F | Virtu Financial LLC | 0 | −100,00 | 0 | |||||
| 2025-08-12 | 13F | Laurel Wealth Advisors LLC | 4 510 | 10 638,10 | 0 | −100,00 | ||||
| 2025-07-08 | 13F | Atwood & Palmer Inc | 110 | 0,00 | 12 | 10,00 | ||||
| 2025-07-24 | 13F | IFP Advisors, Inc | 3 065 | 1,16 | 330 | 13,40 | ||||
| 2025-08-13 | 13F | Cerity Partners LLC | 17 398 | −2,24 | 1 876 | 9,46 | ||||
| 2025-05-15 | 13F | Lido Advisors, LLC | 0 | −100,00 | 0 | −100,00 | ||||
| 2025-07-21 | 13F | Financial Council Asset Management Inc | 3 116 | 0,00 | 336 | 11,67 | ||||
| 2025-08-06 | 13F | Wedbush Securities Inc | 6 324 | 1,01 | 1 | |||||
| 2025-05-15 | 13F/A | Orion Portfolio Solutions, LLC | 3 919 | 29,38 | 377 | 23,61 | ||||
| 2025-08-08 | 13F | SBI Securities Co., Ltd. | 2 996 | −2,73 | 323 | 8,78 | ||||
| 2025-07-02 | 13F | Central Pacific Bank - Trust Division | 80 | 0,00 | 9 | 14,29 | ||||
| 2025-08-14 | 13F | Federation des caisses Desjardins du Quebec | 100 440 | −0,41 | 10 828 | 11,50 | ||||
| 2025-05-14 | 13F | Stonebridge Capital Advisors LLC | 0 | −100,00 | 0 | −100,00 | ||||
| 2025-07-02 | 13F | HBW Advisory Services LLC | 8 482 | 13,94 | 914 | 27,65 | ||||
| 2025-07-22 | 13F | Unique Wealth, Llc | 4 922 | −0,10 | 531 | 11,81 | ||||
| 2025-08-12 | 13F | Kaye Capital Management | 177 302 | −1,27 | 19 115 | 10,54 | ||||
| 2025-08-08 | 13F | Cetera Investment Advisers | 117 329 | −4,34 | 12 649 | 7,10 | ||||
| 2025-08-12 | 13F | Pathstone Holdings, LLC | 8 504 | 0,00 | 917 | 11,98 | ||||
| 2025-07-31 | 13F | GLOBALT Investments LLC / GA | 26 355 | −1,19 | 2 841 | 10,63 | ||||
| 2025-08-12 | 13F | LPL Financial LLC | 914 560 | −2,32 | 98 599 | 9,37 | ||||
| 2025-08-14 | 13F | Mml Investors Services, Llc | 243 804 | −12,57 | 26 | 0,00 | ||||
| 2025-07-21 | 13F | Whelan Financial | 37 471 | −17,77 | 4 040 | −7,93 | ||||
| 2025-07-28 | 13F | RFG Advisory, LLC | 8 115 | 1,17 | 875 | 13,21 | ||||
| 2025-07-18 | 13F | Trust Co Of Vermont | 1 026 | 338,46 | 111 | 400,00 | ||||
| 2025-07-29 | 13F | Signature Estate & Investment Advisors Llc | 49 134 | −0,17 | 5 297 | 11,77 | ||||
| 2025-08-15 | 13F | Morgan Stanley | 918 852 | 2,01 | 99 062 | 14,21 | ||||
| 2025-07-09 | 13F | Mirador Capital Partners LP | 6 469 | −1,93 | 697 | 9,76 | ||||
| 2025-07-29 | 13F | Ifrah Financial Services, Inc. | 6 356 | −29,71 | 685 | −21,26 | ||||
| 2025-08-14 | 13F | Raymond James Financial Inc | 652 089 | 1,29 | 70 302 | 13,41 | ||||
| 2025-07-31 | 13F | 180 Wealth Advisors, Llc | 43 120 | −2,16 | 4 649 | 9,55 | ||||
| 2025-08-07 | 13F | Palisade Asset Management, LLC | 3 220 | 0,00 | 347 | 11,94 | ||||
| 2025-07-11 | 13F | Farther Finance Advisors, LLC | 204 | 0,00 | 22 | 15,79 | ||||
| 2025-07-15 | 13F | Fortitude Family Office, LLC | 7 800 | 0,00 | 841 | 11,85 | ||||
| 2025-07-29 | 13F | Stephens Inc /ar/ | 338 163 | 4,77 | 36 457 | 17,31 | ||||
| 2025-08-14 | 13F | Ieq Capital, Llc | 26 826 | −1,85 | 2 892 | 9,92 | ||||
| 2025-08-12 | 13F | Vickerman Investment Advisors, Inc. | 25 978 | −1,38 | 2 801 | 10,41 | ||||
| 2025-08-18 | 13F/A | National Bank Of Canada /fi/ | 3 213 | −6,82 | 346 | 4,53 | ||||
| 2025-07-21 | 13F | Ameritas Advisory Services, LLC | 99 082 | −38,64 | 10 682 | −32,91 | ||||
| 2025-08-04 | 13F | Atria Investments Llc | 6 774 | −82,85 | 730 | −80,80 | ||||
| 2025-08-14 | 13F | Ausdal Financial Partners, Inc. | 8 623 | −0,93 | 930 | 10,86 | ||||
| 2025-08-13 | 13F | Flow Traders U.s. Llc | 0 | −100,00 | 0 | |||||
| 2025-08-13 | 13F | Northwestern Mutual Wealth Management Co | 2 902 886 | −1,77 | 312 960 | 9,98 | ||||
| 2025-05-20 | 13F | Belpointe Asset Management LLC | 0 | −100,00 | 0 | −100,00 | ||||
| 2025-07-23 | 13F | Richardson Capital Management LLC | 326 | 0,62 | 35 | 12,90 | ||||
| 2025-08-11 | 13F | HighTower Advisors, LLC | 23 328 | 0,28 | 2 515 | 12,28 | ||||
| 2025-07-10 | 13F | Global Financial Private Client, LLC | 0 | −100,00 | 0 | |||||
| 2025-08-05 | 13F | Prosperity Wealth Management, Inc. | 5 332 | −1,50 | 575 | 10,17 | ||||
| 2025-05-15 | 13F | Beaumont Capital Management, LLC | 0 | −100,00 | 0 | |||||
| 2025-08-14 | 13F | Colony Group, LLC | 94 724 | −51,20 | 10 212 | −45,36 | ||||
| 2025-07-07 | 13F | RDA Financial Network | 4 015 | −85,12 | 433 | −83,37 | ||||
| 2025-08-06 | 13F/A | Three Cord True Wealth Management, LLC | 8 037 | −93,44 | 866 | −92,66 | ||||
| 2025-08-08 | 13F | Family Firm, Inc. | 0 | −100,00 | 0 | |||||
| 2025-05-16 | 13F | Ascent Group, LLC | 0 | −100,00 | 0 | −100,00 | ||||
| 2025-08-14 | 13F | Catalyst Financial Partners Llc | 4 042 | 0,00 | 436 | 11,83 | ||||
| 2025-08-05 | 13F | Tsfg, Llc | 1 500 | 0,00 | 0 | |||||
| 2025-08-01 | 13F | Chilton Capital Management Llc | 266 | 0,00 | 29 | 12,00 | ||||
| 2025-07-15 | 13F | BigSur Wealth Management LLC | 5 076 | 0,00 | 547 | 12,09 | ||||
| 2025-08-06 | 13F | Savant Capital, LLC | 2 694 | 0,00 | 290 | 11,97 | ||||
| 2025-07-11 | 13F | Annex Advisory Services, LLC | 1 422 141 | 30,96 | 153 321 | 46,63 | ||||
| 2025-07-09 | 13F | Alesco Advisors Llc | 10 115 | 0,00 | 1 090 | 12,02 | ||||
| 2025-08-14 | 13F | Matrix Private Capital Group Llc | 295 | 0,00 | 32 | 10,71 | ||||
| 2025-07-17 | 13F | Independence Bank of Kentucky | 90 | 0,00 | 10 | 12,50 | ||||
| 2025-08-12 | 13F | Global Retirement Partners, LLC | 19 435 | 74,41 | 2 095 | 86,72 | ||||
| 2025-07-10 | 13F | Secure Asset Management, LLC | 3 413 | −2,37 | 368 | 9,23 | ||||
| 2025-08-13 | 13F | Continuum Advisory, LLC | 0 | −100,00 | 0 | |||||
| 2025-08-13 | 13F | Capital World Investors | 0 | −100,00 | 0 | |||||
| 2025-08-14 | 13F/A | Rockefeller Capital Management L.P. | 23 258 | 2,05 | 2 507 | 14,27 | ||||
| 2025-08-12 | 13F | Jpmorgan Chase & Co | 39 066 | −0,68 | 4 212 | 11,20 | ||||
| 2025-08-07 | 13F | Beese Fulmer Investment Management, Inc. | 2 082 | 0,00 | 224 | 12,00 | ||||
| 2025-07-30 | 13F | Retirement Planning Group | 14 173 | −1,41 | 1 528 | 10,33 | ||||
| 2025-07-30 | 13F | Darrow Company, Inc. | 2 716 | 1,31 | 293 | 13,18 | ||||
| 2025-08-14 | 13F | Susquehanna International Group, Llp | Put | 28 500 | 0,35 | 3 073 | 12,36 | |||
| 2025-08-14 | 13F | Susquehanna International Group, Llp | 117 679 | 231,26 | 12 687 | 270,94 | ||||
| 2025-08-19 | 13F | Cape Investment Advisory, Inc. | 3 867 | 5,25 | 417 | 17,85 | ||||
| 2025-07-22 | 13F | Inlight Wealth Management, LLC | 22 | 0,00 | 2 | 0,00 | ||||
| 2025-08-15 | 13F | Kestra Advisory Services, LLC | 94 439 | 50,52 | 10 181 | 68,53 | ||||
| 2025-07-09 | 13F | First Financial Corp /in/ | 42 | −66,40 | 5 | −66,67 | ||||
| 2025-07-15 | 13F | Mather Group, Llc. | 277 577 | 0,97 | 29 926 | 13,06 | ||||
| 2025-07-28 | 13F | Tower Wealth Partners, Inc. | 0 | −100,00 | 0 | |||||
| 2025-07-17 | 13F | Sound Income Strategies, LLC | 240 | 605,88 | 26 | 733,33 | ||||
| 2025-08-07 | 13F | Americana Partners, LLC | 1 932 | 208 | ||||||
| 2025-08-13 | 13F | Townsquare Capital Llc | 0 | −100,00 | 0 | |||||
| 2025-07-28 | 13F | Copia Wealth Management | 88 | 0,00 | 9 | 12,50 | ||||
| 2025-07-24 | 13F | JNBA Financial Advisors | 178 | 0,00 | 19 | 11,76 | ||||
| 2025-07-28 | 13F | Arlington Financial Advisors, LLC | 0 | −100,00 | 0 | |||||
| 2025-05-14 | 13F | Dorsey & Whitney Trust CO LLC | 0 | −100,00 | 0 | |||||
| 2025-08-08 | 13F | Pnc Financial Services Group, Inc. | 3 640 | 0,11 | 392 | 12,00 | ||||
| 2025-08-14 | 13F | Great Valley Advisor Group, Inc. | 2 163 | 0,05 | 233 | 12,02 | ||||
| 2025-07-29 | 13F | Private Trust Co Na | 357 | −43,87 | 38 | −37,70 | ||||
| 2025-05-15 | 13F | Cullen Capital Management, LLC | 0 | −100,00 | 0 | −100,00 | ||||
| 2025-08-11 | 13F | Citigroup Inc | 145 411 | −2,34 | 15 677 | 9,34 | ||||
| 2025-08-13 | 13F | Scotia Capital Inc. | 158 151 | 0,48 | 17 046 | 12,49 | ||||
| 2025-07-25 | 13F | Concurrent Investment Advisors, LLC | 5 001 | −6,92 | 539 | 4,26 | ||||
| 2025-07-28 | 13F | Sagespring Wealth Partners, Llc | 14 444 | −9,74 | 1 557 | 1,10 | ||||
| 2025-08-01 | 13F | Boyd Watterson Asset Management Llc/oh | 34 698 | 0,00 | 3 741 | 11,94 | ||||
| 2025-08-12 | 13F | CIBC Private Wealth Group, LLC | 1 001 | −28,96 | 108 | −10,08 | ||||
| 2025-07-24 | 13F | McKinley Carter Wealth Services, Inc. | 2 714 | −8,43 | 293 | 2,46 | ||||
| 2025-08-13 | 13F | Rsm Us Wealth Management Llc | 3 605 | 389 | ||||||
| 2025-08-14 | 13F | Jane Street Group, Llc | 0 | −100,00 | 0 | |||||
| 2025-07-17 | 13F | Tritonpoint Wealth, Llc | 2 550 | −7,10 | 275 | 3,79 | ||||
| 2025-08-04 | 13F | Adell Harriman & Carpenter Inc | 3 100 | 0,00 | 334 | 12,08 | ||||
| 2025-08-07 | 13F | Atala Financial Inc | 3 388 | 83,33 | 365 | 106,21 | ||||
| 2025-08-11 | 13F | Principal Securities, Inc. | 1 623 | 2,59 | 175 | 9,43 | ||||
| 2025-05-06 | 13F | Carnegie Capital Asset Management, LLC | 0 | −100,00 | 0 | |||||
| 2025-08-14 | 13F | Diversify Wealth Management, Llc | 2 263 | 0,67 | 259 | 19,44 | ||||
| 2025-04-21 | 13F | Compass Capital Corp /ma/ /adv | 0 | −100,00 | 0 | |||||
| 2025-08-14 | 13F | Royal Bank Of Canada | 299 842 | 5,98 | 32 327 | 18,65 | ||||
| 2025-08-14 | 13F | Fmr Llc | 23 668 | 29,16 | 2 552 | 44,61 | ||||
| 2025-07-17 | 13F | Fifth Third Securities, Inc. | 12 608 | 2,61 | 1 359 | 14,88 | ||||
| 2025-08-08 | 13F | Capital Investment Advisory Services, LLC | 230 | 0,00 | 25 | 9,09 | ||||
| 2025-08-11 | 13F | WPWealth LLP | 4 610 | 0,00 | 497 | 12,19 | ||||
| 2025-08-13 | 13F | Bank Of Nova Scotia | 2 000 | 216 | ||||||
| 2025-07-15 | 13F | BCS Wealth Management | 7 673 | 0,00 | 1 | |||||
| 2025-08-14 | 13F | Integrated Wealth Concepts LLC | 55 009 | −6,00 | 5 931 | 5,24 | ||||
| 2025-07-10 | 13F | Focus Financial Network, Inc. | 2 686 | −26,57 | 290 | −17,90 | ||||
| 2025-08-14 | 13F | DHK Financial Advisors, Inc. | 4 500 | 0,00 | 485 | 12,01 | ||||
| 2025-08-14 | 13F | LWM Advisory Services, LLC | 22 030 | −15,35 | 2 375 | −5,19 | ||||
| 2025-08-15 | 13F | Equitable Holdings, Inc. | 117 856 | −8,58 | 12 706 | 2,36 | ||||
| 2025-07-25 | 13F | Cwm, Llc | 1 194 | 0,59 | 0 | |||||
| 2025-07-30 | 13F | Phillips Financial Management, Llc | 439 | 0,00 | 47 | 11,90 | ||||
| 2025-08-07 | 13F | Fagan Associates, Inc. | 41 132 | −1,89 | 4 434 | 9,83 | ||||
| 2025-08-06 | 13F | Decker Retirement Planning Inc. | 16 | 0,00 | 2 | 0,00 | ||||
| 2025-08-08 | 13F | Avantax Advisory Services, Inc. | 362 722 | −5,28 | 39 105 | 6,05 | ||||
| 2025-08-04 | 13F | Center for Financial Planning, Inc. | 404 | 0,00 | 44 | 13,16 | ||||
| 2025-08-04 | 13F | Flagship Harbor Advisors, Llc | 11 345 | 3,09 | 1 223 | 15,49 | ||||
| 2025-07-18 | 13F | Truist Financial Corp | 6 163 | 58,43 | 664 | 77,54 | ||||
| 2025-07-22 | 13F | Olistico Wealth, LLC | 276 | 0,00 | 30 | 11,54 | ||||
| 2025-08-04 | 13F | Amplius Wealth Advisors, LLC | 1 116 281 | −3,27 | 120 338 | 8,29 | ||||
| 2025-07-30 | 13F | Onyx Bridge Wealth Group LLC | 15 036 | 4,47 | 1 621 | 17,04 | ||||
| 2025-08-14 | 13F | Connecticut Wealth Management, LLC | 34 538 | −0,37 | 3 723 | 11,57 | ||||
| 2025-08-15 | 13F | CI Private Wealth, LLC | 8 349 | −49,94 | 901 | −43,86 | ||||
| 2025-07-18 | 13F/A | MJT & Associates Financial Advisory Group, Inc. | 963 | 0,00 | 104 | 11,96 | ||||
| 2025-08-04 | 13F | Pensionmark Financial Group, Llc | 9 208 | −5,87 | 993 | 5,42 | ||||
| 2025-08-14 | 13F | Sunbelt Securities, Inc. | 4 317 | 872,30 | 435 | 935,71 | ||||
| 2025-07-16 | 13F | Beaumont Financial Advisors, LLC | 0 | −100,00 | 0 | |||||
| 2025-08-06 | 13F | New Millennium Group LLC | 51 | −15,00 | 5 | 0,00 | ||||
| 2025-08-15 | 13F | WFA of San Diego, LLC | 72 | −12,20 | 8 | −12,50 | ||||
| 2025-08-12 | 13F | Financial Advocates Investment Management | 0 | −100,00 | 0 | |||||
| 2025-08-13 | 13F | IAG Wealth Partners, LLC | 115 | −78,34 | 12 | −76,47 | ||||
| 2025-08-06 | 13F/A | Flagship Private Wealth, LLC | 117 530 | −1,03 | 12 671 | 10,81 | ||||
| 2025-07-23 | 13F | Drake & Associates, LLC | 12 155 | −92,78 | 1 310 | −91,92 | ||||
| 2025-08-11 | 13F | Great Lakes Advisors, Llc | 2 053 | 221 | ||||||
| 2025-08-27 | 13F/A | Brinker Capital Investments, LLC | 3 299 | −15,82 | 356 | −5,84 | ||||
| 2025-07-30 | 13F | Alexis Investment Partners, LLC | 84 221 | 2,61 | 9 061 | 14,74 | ||||
| 2025-08-13 | 13F | Jones Financial Companies Lllp | 86 017 | 15,90 | 9 250 | 29,57 | ||||
| 2025-08-14 | 13F | TCG Advisory Services, LLC | 2 464 | 266 | ||||||
| 2025-04-25 | 13F | WestEnd Advisors, LLC | 0 | −100,00 | 0 | −100,00 | ||||
| 2025-07-15 | 13F | Christensen, King & Associates Investment Services, Inc. | 30 276 | 1,15 | 3 264 | 9,13 | ||||
| 2025-07-17 | 13F | Guyasuta Investment Advisors Inc | 2 185 | 0,00 | 236 | 11,90 | ||||
| 2025-08-05 | 13F | Transatlantique Private Wealth Llc | 14 460 | 6,22 | 1 559 | 18,93 | ||||
| 2025-07-23 | 13F | Charter Trust Co | 3 317 | 0,00 | 358 | 11,91 | ||||
| 2025-08-13 | 13F | Polen Capital Management Llc | 0 | −100,00 | 0 | |||||
| 2025-07-15 | 13F | GSB Wealth Management, LLC | 4 052 | −5,33 | 437 | 5,83 | ||||
| 2025-07-31 | 13F | Gallagher Capital Advisors, LLC | 2 456 | 0,70 | 276 | 17,52 | ||||
| 2025-05-14 | 13F | Van Hulzen Asset Management, LLC | 0 | −100,00 | 0 | |||||
| 2025-08-07 | 13F | Sierra Ocean, Llc | 3 687 | 0,00 | 398 | 11,83 | ||||
| 2025-05-16 | 13F | Arete Wealth Advisors, LLC | 0 | −100,00 | 0 | |||||
| 2025-08-05 | 13F | Sigma Planning Corp | 103 230 | −6,17 | 11 129 | 5,06 | ||||
| 2025-08-14 | 13F | Silvercrest Asset Management Group Llc | 2 570 | 0,00 | 277 | 12,15 | ||||
| 2025-08-06 | 13F | AE Wealth Management LLC | 372 | 0,00 | 40 | 14,29 | ||||
| 2025-07-30 | 13F | Whittier Trust Co Of Nevada Inc | 1 190 | 0,00 | 128 | 12,28 | ||||
| 2025-07-30 | 13F | Whittier Trust Co | 5 000 | 0,00 | 539 | 12,06 | ||||
| 2025-08-08 | 13F | Creative Planning | 13 330 | 7,89 | 1 437 | 20,86 | ||||
| 2025-08-14 | 13F | Modern Wealth Management, LLC | 316 947 | 0,01 | 34 170 | 11,98 | ||||
| 2025-08-12 | 13F | BlackRock, Inc. | 27 385 813 | −0,09 | 2 952 464 | 11,86 | ||||
| 2025-08-08 | 13F | Donoghue Forlines LLC | 21 940 | 2 365 | ||||||
| 2025-08-14 | 13F | CIBC World Markets Inc. | 66 924 | −1,22 | 7 215 | 10,61 | ||||
| 2025-08-28 | NP | GTAAX - Power Global Tactical Allocation/JAForlines Fund Class A | 20 099 | 2 167 | ||||||
| 2025-08-11 | 13F | Private Advisor Group, LLC | 44 234 | 3,76 | 4 769 | 16,15 | ||||
| 2025-07-23 | 13F | Armstrong, Fleming & Moore, Inc | 0 | −100,00 | 0 | |||||
| 2025-08-14 | 13F | CoreCap Advisors, LLC | 300 | 0,00 | 32 | 14,29 | ||||
| 2025-08-14 | 13F | Guardian Wealth Advisors, Llc / Nc | 316 | 0,00 | 34 | 13,33 | ||||
| 2025-08-12 | 13F | Sfmg, Llc | 3 272 | 0,71 | 353 | 12,82 | ||||
| 2025-08-14 | 13F | Certified Advisory Corp | 96 365 | 3,85 | 10 389 | 16,27 | ||||
| 2025-08-08 | 13F | Gts Securities Llc | 5 846 | 178,25 | 630 | 211,88 | ||||
| 2025-08-08 | 13F | TD Capital Management LLC | 596 | 0,68 | 64 | 14,29 | ||||
| 2025-07-28 | 13F | Rik Saylor Financial, Inc. | 8 800 | −0,60 | 949 | 11,27 | ||||
| 2025-07-31 | 13F | Burke & Herbert Bank & Trust Co | 3 230 | 0,00 | 348 | 11,90 | ||||
| 2025-08-14 | 13F | Hrt Financial Lp | 3 768 | −57,04 | 0 | |||||
| 2025-07-11 | 13F | LongView Wealth Management | 3 195 | 14,23 | 344 | 27,88 | ||||
| 2025-08-07 | 13F | Montag A & Associates Inc | 4 400 | −29,67 | 474 | −21,26 | ||||
| 2025-08-13 | 13F | Cresset Asset Management, LLC | 2 348 | 0,00 | 253 | 11,95 | ||||
| 2025-07-25 | 13F | Evolution Advisers, Inc. | 19 | 0,00 | 0 | |||||
| 2025-08-12 | 13F | Waddell & Associates, Llc | 2 909 | −33,52 | 314 | −25,65 | ||||
| 2025-08-13 | 13F | Level Four Advisory Services, Llc | 3 286 | 0,00 | 354 | 12,03 | ||||
| 2025-07-23 | 13F | Independent Solutions Wealth Management, LLC | 0 | −100,00 | 0 | |||||
| 2025-08-18 | 13F | Front Row Advisors LLC | 180 | 0,00 | 19 | 11,76 | ||||
| 2025-07-16 | 13F | Twelve Points Wealth Management LLC | 37 217 | 4 012 | ||||||
| 2025-08-14 | 13F | CIBC Asset Management Inc | 2 240 | 0,00 | 241 | 12,09 | ||||
| 2025-08-04 | 13F | Arkadios Wealth Advisors | 6 520 | 703 | ||||||
| 2025-08-12 | 13F | Coldstream Capital Management Inc | 0 | −100,00 | 0 | |||||
| 2025-07-31 | 13F | Strait & Sound Wealth Management LLC | 2 362 | −4,14 | 255 | 7,17 | ||||
| 2025-07-09 | 13F | Breakwater Investment Management | 1 990 | 0,00 | 215 | 12,04 | ||||
| 2025-07-16 | 13F | Highline Wealth Partners Llc | 56 | 6 | ||||||
| 2025-08-12 | 13F | Gladstone Institutional Advisory LLC | 35 189 | −47,72 | 3 794 | −41,47 | ||||
| 2025-07-14 | 13F | Sowell Financial Services LLC | 4 583 | 18,67 | 494 | 33,15 | ||||
| 2025-07-15 | 13F | Fifth Third Bancorp | 3 593 | 259,30 | 387 | 303,13 | ||||
| 2025-07-23 | 13F | High Note Wealth, LLC | 1 090 | 0,00 | 118 | 12,50 | ||||
| 2025-07-10 | 13F | Affiance Financial, LLC | 2 103 | −4,58 | 227 | 6,60 | ||||
| 2025-08-06 | 13F | Kcm Investment Advisors Llc | 10 062 | 0,00 | 1 085 | 11,98 | ||||
| 2025-07-17 | 13F | Willow Creek Wealth Management Inc. | 2 219 | 0,00 | 239 | 12,21 | ||||
| 2025-08-05 | 13F | Obermeyer Wood Investment Counsel, Lllp | 2 251 | 0,63 | 243 | 12,56 | ||||
| 2025-08-06 | 13F | First Horizon Advisors, Inc. | 362 | 39 | ||||||
| 2025-07-29 | 13F | Curbstone Financial Management Corp | 18 880 | −4,07 | 2 035 | 7,44 | ||||
| 2025-07-22 | 13F | USAdvisors Wealth Management, LLC | 0 | −100,00 | 0 | |||||
| 2025-07-29 | 13F | Creekside Partners | 13 441 | 0,00 | 1 449 | 11,98 | ||||
| 2025-08-15 | 13F | Tower Research Capital LLC (TRC) | 5 | −58,33 | 1 | −100,00 | ||||
| 2025-05-14 | 13F | Northstar Financial Companies, Inc. | 0 | −100,00 | 0 | |||||
| 2025-08-06 | 13F | Atlantic Union Bankshares Corp | 156 | 17 | ||||||
| 2025-07-16 | 13F | Signaturefd, Llc | 1 260 | −11,27 | 136 | −0,74 | ||||
| 2025-08-04 | 13F | Assetmark, Inc | 49 314 | −3,36 | 5 317 | 8,20 | ||||
| 2025-05-15 | 13F | Glenmede Trust Co Na | 5 399 | −6,14 | 520 | −10,36 | ||||
| 2025-07-21 | 13F | Future Financial Wealth Managment LLC | 2 452 | 0,00 | 264 | 11,86 | ||||
| 2025-07-31 | 13F | Oppenheimer & Co Inc | 10 455 | −0,19 | 1 127 | 11,81 | ||||
| 2025-08-12 | 13F | Steward Partners Investment Advisory, Llc | 19 035 | 1,68 | 2 052 | 13,87 | ||||
| 2025-08-14 | 13F | Qube Research & Technologies Ltd | 9 196 | 991 | ||||||
| 2025-08-13 | 13F | Okabena Investment Services Inc | 0 | −100,00 | 0 | |||||
| 2025-08-14 | 13F | GWM Advisors LLC | 5 517 | −16,18 | 595 | −6,16 | ||||
| 2025-08-19 | 13F | Newbridge Financial Services Group, Inc. | 57 610 | 7,70 | 6 211 | 20,58 |