Grunnleggende statistikk
| Institusjonelle eiere | 90 total, 90 long only, 0 short only, 0 long/short - change of 0,00% MRQ |
| Gjennomsnittlig porteføljeallokering | 0.0899 % - change of −16,99% MRQ |
| Institusjonelle aksjer (Long) | 2 857 110 (ex 13D/G) - change of −0,14MM shares −4,72% MRQ |
| Institusjonell verdi (Long) | $ 78 441 USD ($1000) |
Institusjonelt eierskap og aksjonærer
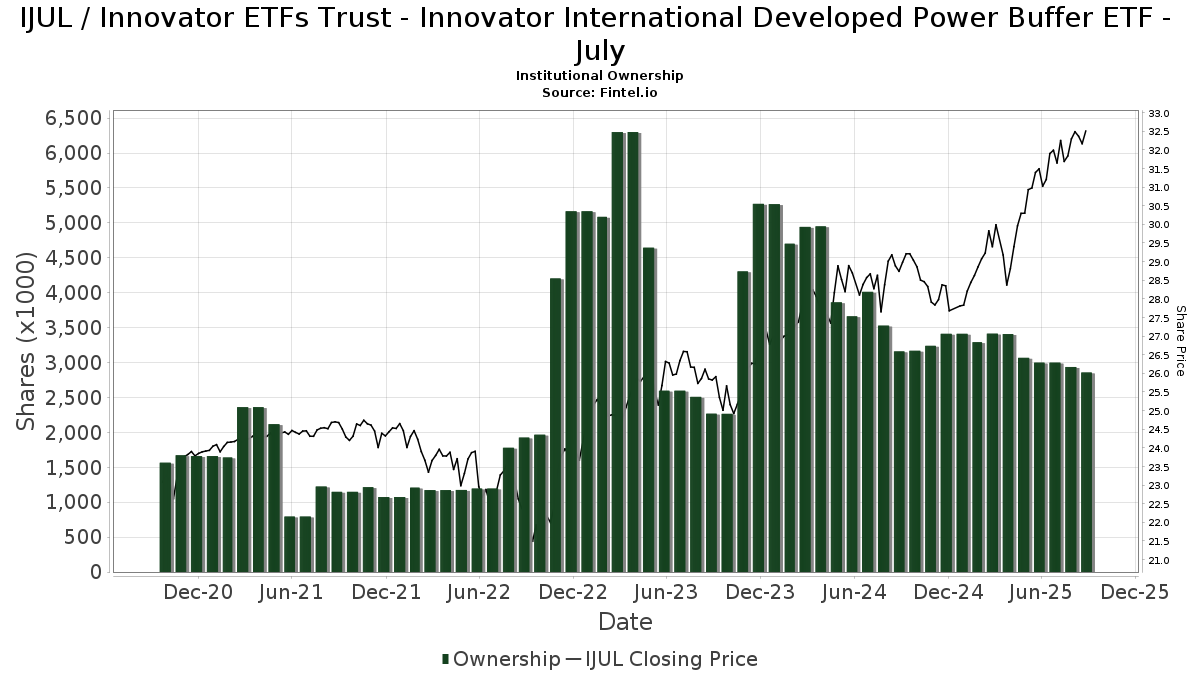
Innovator ETFs Trust - Innovator International Developed Power Buffer ETF - July (US:IJUL) har 90 institusjonelle eiere og aksjonærer som har sendt inn 13D/G- eller 13F-skjemaer til Securities Exchange Commission (SEC). Disse institusjonene eier til sammen 2,857,110 aksjer. De største aksjonærene inkluderer Advisor Group Holdings, Inc., Berger Financial Group, Inc, Envestnet Asset Management Inc, Global Strategic Investment Solutions, LLC, Commonwealth Equity Services, Llc, Blair William & Co/il, Mml Investors Services, Llc, Cetera Investment Advisers, Americana Partners, LLC, and Bedel Financial Consulting, Inc. .
Innovator ETFs Trust - Innovator International Developed Power Buffer ETF - July (ARCA:IJUL) institusjonell eierstruktur viser nåværende posisjoner i selskapet fordelt på institusjoner og fond, samt de siste endringene i posisjonsstørrelse. De største aksjonærene kan være individuelle investorer, verdipapirfond, hedgefond eller institusjoner. Schedule 13D indikerer at investoren eier (eller har eid) mer enn 5 % av selskapet og har til hensikt (eller hadde til hensikt) å aktivt forfølge en endring i forretningsstrategien. Schedule 13G indikerer en passiv investering på over 5 %.
The share price as of September 9, 2025 is 32,52 / share. Previously, on September 10, 2024, the share price was 28,63 / share. This represents an increase of 13,59% over that period.
Fondssentiment-score
Fondssentiment Score (også kjent som akkumulering av eierskap poengsum) viser hvilke aksjer som er mest kjøpt av fond. Den er resultatet av en sofistikert, kvantitativ flerfaktormodell som identifiserer selskaper med de høyeste nivåene av institusjonell akkumulering. Beregningsmodellen for poeng bruker en kombinasjon av den totale økningen i antall offentliggjorte eiere, endringer i porteføljeallokeringen til disse eierne og andre beregninger. Tallet går fra 0 til 100, der høyere tall indikerer en høyere grad av akkumulering i forhold til sammenlignbare selskaper, der 50 er gjennomsnittet.
Oppdateringsfrekvens: Daglig
Sjekk ut Ownership Explorer, som inneholder en liste over de høyest rangerte selskapene.
Institusjonell Put/Call-forhold
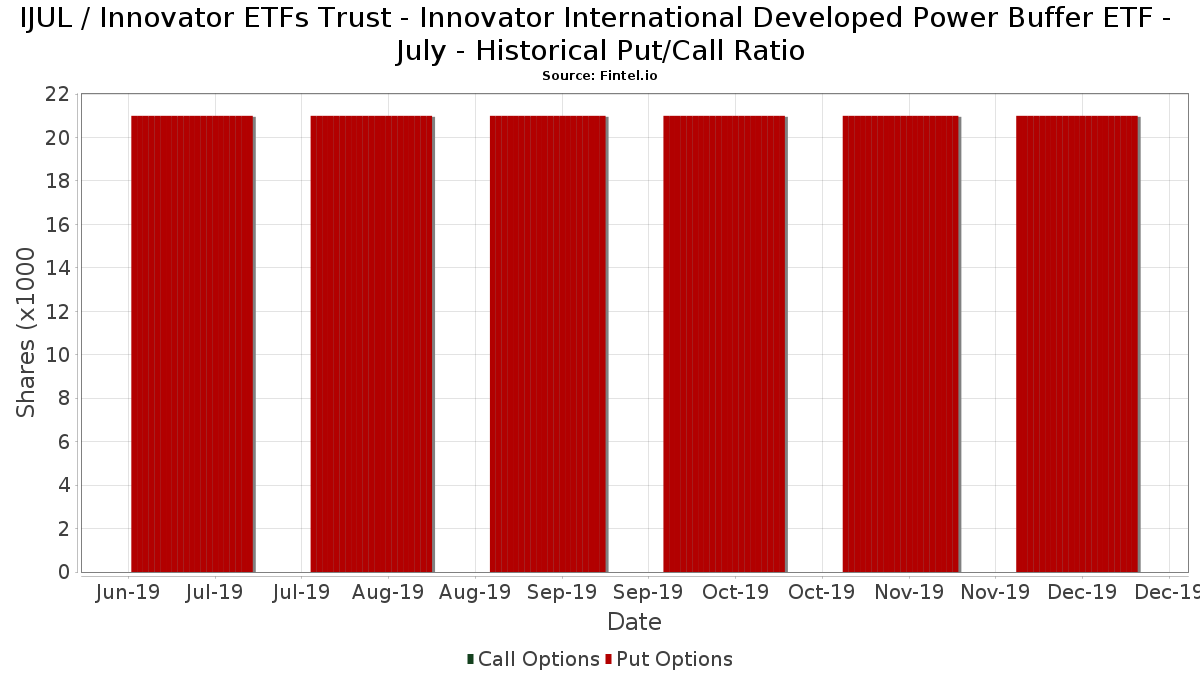
I tillegg til å rapportere standard aksje- og gjeldsemisjoner må institusjoner med mer enn 100 millioner kroner i forvaltningskapital også oppgi beholdningen av put- og callopsjoner. Siden put-opsjoner generelt indikerer et negativt sentiment, og call-opsjoner indikerer et positivt sentiment, kan vi få et inntrykk av det generelle institusjonelle sentimentet ved å plotte forholdet mellom put- og call-opsjoner. Diagrammet til høyre viser det historiske forholdet mellom put- og call-opsjoner for dette instrumentet.
Ved å bruke Put/Call-forholdet som en indikator på investorsentimentet kan man overvinne en av de viktigste svakhetene ved å bruke totalt institusjonelt eierskap, nemlig at en betydelig andel av forvaltningskapitalen investeres passivt for å følge indekser. Passivt forvaltede fond kjøper vanligvis ikke opsjoner, slik at indikatoren for put/call-forhold i større grad gjenspeiler stemningen i aktivt forvaltede fond.
13F- og NPORT-arkiveringer
Detaljer om 13F-arkiveringer er gratis. Detaljer om NP-arkiveringer krever et premium-medlemskap. Grønne rader indikerer nye posisjoner. Røde rader indikerer lukkede posisjoner. Klikk på lenke ikonet for å se hele transaksjonshistorikken.
Oppgrader
for å låse opp premiedata og eksportere til Excel. ![]() .
.
| Fildato | Kilde | Investor | Type | Gjennomsnittlig pris (estimert) |
Aksjer | Δ Aksjer (%) |
Rapportert verdi ($1000) | Verdi (%) | Portallokering (%) | |
|---|---|---|---|---|---|---|---|---|---|---|
| 2025-05-14 | 13F | Jane Street Group, Llc | 0 | −100,00 | 0 | |||||
| 2025-08-11 | 13F | Atlantic Private Wealth, LLC | 0 | −100,00 | 0 | |||||
| 2025-07-22 | 13F | Siligmueller & Norvid Wealth Advisors LLC | 38 022 | 0,00 | 1 203 | 8,67 | ||||
| 2025-08-08 | 13F | Bailard, Inc. | 8 525 | 0,00 | 272 | 9,68 | ||||
| 2025-07-22 | 13F | Merit Financial Group, LLC | 28 486 | 910 | ||||||
| 2025-08-11 | 13F | Summit Wealth Partners, LLC | 8 495 | −12,09 | 271 | −3,56 | ||||
| 2025-05-14 | 13F/A | Morgan Stanley | 0 | −100,00 | 0 | −100,00 | ||||
| 2025-08-06 | 13F | AE Wealth Management LLC | 23 | 0,00 | 1 | |||||
| 2025-04-18 | 13F | Global Trust Asset Management, LLC | 0 | −100,00 | 0 | |||||
| 2025-07-30 | 13F | Strategic Blueprint, LLC | 43 007 | −10,25 | 1 374 | −1,58 | ||||
| 2025-08-14 | 13F | Old Mission Capital Llc | 0 | −100,00 | 0 | |||||
| 2025-07-11 | 13F | Farther Finance Advisors, LLC | 0 | −100,00 | 0 | |||||
| 2025-08-14 | 13F | Wells Fargo & Company/mn | 1 474 | 0,00 | 47 | 11,90 | ||||
| 2025-08-11 | 13F | Wealthgarden F.s. Llc | 22 494 | −5,71 | 709 | 2,02 | ||||
| 2025-07-23 | 13F | Nbt Bank N A /ny | 3 080 | 0,00 | 98 | 10,11 | ||||
| 2025-08-04 | 13F | Creative Financial Designs Inc /adv | 770 | 0,00 | 25 | 9,09 | ||||
| 2025-07-17 | 13F | Clear Point Advisors Inc. | 22 283 | 0,00 | 712 | 9,72 | ||||
| 2025-07-22 | 13F | Berger Financial Group, Inc | 198 789 | −8,22 | 6 349 | 0,67 | ||||
| 2025-05-08 | 13F | Helium Advisors LLC | 0 | −100,00 | 0 | |||||
| 2025-08-01 | 13F | Corrado Advisors, Llc | 7 312 | −93,60 | 234 | −93,00 | ||||
| 2025-08-12 | 13F | LPL Financial LLC | 36 112 | 72,87 | 1 153 | 89,64 | ||||
| 2025-07-25 | 13F | Atria Wealth Solutions, Inc. | 0 | −100,00 | 0 | |||||
| 2025-08-07 | 13F | PFG Advisors | 6 517 | 208 | ||||||
| 2025-08-11 | 13F | HighTower Advisors, LLC | 56 375 | −73,43 | 1 801 | −70,86 | ||||
| 2025-08-14 | 13F | Royal Bank Of Canada | 1 000 | 0,00 | 32 | 10,34 | ||||
| 2025-07-15 | 13F | BCS Wealth Management | 21 251 | −10,49 | 1 | |||||
| 2025-08-05 | 13F | WorthPointe, LLC | 45 395 | −2,90 | 1 450 | 6,47 | ||||
| 2025-08-12 | 13F | Jacobi Capital Management LLC | 16 561 | 0,00 | 529 | 9,54 | ||||
| 2025-07-29 | 13F | Chicago Partners Investment Group LLC | 7 483 | 0,00 | 241 | 6,64 | ||||
| 2025-08-14 | 13F | Mml Investors Services, Llc | 146 987 | 6,34 | 5 | 0,00 | ||||
| 2025-07-16 | 13F | Signaturefd, Llc | 12 533 | 0,00 | 400 | 9,89 | ||||
| 2025-08-12 | 13F | MAI Capital Management | 4 204 | 44,37 | 134 | 59,52 | ||||
| 2025-08-15 | 13F | Kestra Advisory Services, LLC | 30 659 | 27,03 | 979 | 39,46 | ||||
| 2025-07-28 | 13F | Compass Advisory Group LLC | 12 329 | 0,00 | 394 | 9,47 | ||||
| 2025-08-08 | 13F | Avantax Advisory Services, Inc. | 30 387 | 8,35 | 971 | 18,87 | ||||
| 2025-08-08 | 13F | Cetera Investment Advisers | 114 523 | −4,28 | 3 658 | 4,97 | ||||
| 2025-08-11 | 13F | Nations Financial Group Inc, /ia/ /adv | 15 250 | 0,00 | 487 | 9,68 | ||||
| 2025-08-14 | 13F | CoreCap Advisors, LLC | 2 969 | 160,44 | 95 | 184,85 | ||||
| 2025-07-21 | 13F | DHJJ Financial Advisors, Ltd. | 18 552 | −1,03 | 593 | 8,62 | ||||
| 2025-07-24 | 13F | Us Bancorp \de\ | 16 | 1 | ||||||
| 2025-08-12 | 13F | Long Island Wealth Management, Inc. | 47 936 | 54,67 | 1 531 | 69,73 | ||||
| 2025-07-28 | 13F | Cypress Wealth Services, LLC | 46 291 | 0,00 | 1 479 | 9,73 | ||||
| 2025-08-12 | 13F | Proequities, Inc. | 0 | 0 | ||||||
| 2025-07-25 | 13F | Cwm, Llc | 9 437 | 31,45 | 0 | |||||
| 2025-08-12 | 13F | Coldstream Capital Management Inc | 0 | −100,00 | 0 | |||||
| 2025-07-28 | 13F | Harbour Investments, Inc. | 2 523 | −67,79 | 81 | −64,91 | ||||
| 2025-07-24 | 13F | Stonebridge Financial Group, LLC | 0 | −100,00 | 0 | |||||
| 2025-07-22 | 13F | Global Strategic Investment Solutions, LLC | 154 240 | −3,13 | 4 926 | 6,26 | ||||
| 2025-08-12 | 13F | AlphaCore Capital LLC | 3 400 | −5,56 | 109 | 3,85 | ||||
| 2025-07-11 | 13F | Cypress Financial Planning Llc | 11 324 | −1,37 | 362 | 8,08 | ||||
| 2025-07-10 | 13F | NorthCrest Asset Manangement, LLC | 10 807 | 0,00 | 344 | 9,24 | ||||
| 2025-08-14 | 13F | First Commonwealth Financial Corp /pa/ | 6 513 | −22,30 | 208 | −14,75 | ||||
| 2025-07-09 | 13F | Fragasso Group Inc. | 6 882 | 0,00 | 220 | 9,50 | ||||
| 2025-08-14 | 13F | Financial Network Wealth Advisors LLC | 982 | 10,71 | 31 | 24,00 | ||||
| 2025-07-01 | 13F | Harbor Investment Advisory, Llc | 1 110 | 0,00 | 35 | 9,38 | ||||
| 2025-08-12 | 13F | Tradition Wealth Management, LLC | 9 274 | 0,00 | 296 | 9,63 | ||||
| 2025-07-22 | 13F | Miracle Mile Advisors, LLC | 13 114 | 0,00 | 419 | 9,71 | ||||
| 2025-08-14 | 13F | Sunbelt Securities, Inc. | 3 015 | 0,00 | 84 | −4,60 | ||||
| 2025-08-14 | 13F | IHT Wealth Management, LLC | 7 924 | 253 | ||||||
| 2025-07-29 | 13F | Ifrah Financial Services, Inc. | 25 986 | −1,24 | 830 | 8,22 | ||||
| 2025-08-08 | 13F | Kingsview Wealth Management, LLC | 9 130 | 9,52 | 292 | 20,25 | ||||
| 2025-08-13 | 13F | Capital Analysts, Inc. | 4 525 | 0,00 | 0 | |||||
| 2025-07-21 | 13F | Triad Wealth Partners, LLC | 23 096 | 70,09 | 738 | 86,58 | ||||
| 2025-07-11 | 13F | Lantz Financial LLC | 54 216 | 0,08 | 1 732 | 9,77 | ||||
| 2025-07-17 | 13F | Janney Montgomery Scott LLC | 19 473 | 0,00 | 1 | |||||
| 2025-07-18 | 13F | Truist Financial Corp | 10 744 | 343 | ||||||
| 2025-08-12 | 13F | Bedel Financial Consulting, Inc. | 81 834 | 0,00 | 2 614 | 5,11 | ||||
| 2025-05-12 | 13F | Fmr Llc | 0 | −100,00 | 0 | |||||
| 2025-08-12 | 13F | Steward Partners Investment Advisory, Llc | 8 844 | −3,28 | 282 | 6,02 | ||||
| 2025-07-29 | 13F | Straight Path Wealth Management | 33 247 | 1 062 | ||||||
| 2025-08-06 | 13F | Commonwealth Equity Services, Llc | 153 001 | −11,29 | 5 | −20,00 | ||||
| 2025-08-13 | 13F | Cerity Partners LLC | 15 988 | −9,84 | 511 | −1,16 | ||||
| 2025-08-25 | 13F/A | Kovitz Investment Group Partners, LLC | 0 | −100,00 | 0 | |||||
| 2025-07-24 | 13F | IFP Advisors, Inc | 19 379 | −0,26 | 619 | 9,38 | ||||
| 2025-08-08 | 13F | Compass Financial Services Inc | 255 | 0,00 | 8 | 14,29 | ||||
| 2025-08-14 | 13F | Susquehanna International Group, Llp | 0 | −100,00 | 0 | |||||
| 2025-07-09 | 13F | HFG Wealth Management, LLC | 0 | −100,00 | 0 | |||||
| 2025-07-10 | 13F | Wealth Enhancement Advisory Services, Llc | 29 226 | 0,23 | 930 | 9,42 | ||||
| 2025-08-04 | 13F | Assetmark, Inc | 165 | 0,00 | 5 | 25,00 | ||||
| 2025-08-14 | 13F | Citadel Advisors Llc | 0 | −100,00 | 0 | |||||
| 2025-07-31 | 13F | Cambridge Investment Research Advisors, Inc. | 21 114 | −2,18 | 1 | |||||
| 2025-07-22 | 13F | Diligent Investors, LLC | 41 582 | −1,51 | 1 328 | 8,06 | ||||
| 2025-07-29 | 13F | BKD Wealth Advisors, LLC | 11 945 | −7,03 | 382 | 1,87 | ||||
| 2025-08-07 | 13F | Allworth Financial LP | 10 424 | 0,00 | 333 | 7,79 | ||||
| 2025-08-11 | 13F | Principal Securities, Inc. | 42 221 | −0,27 | 1 349 | 15,02 | ||||
| 2025-08-15 | 13F | Captrust Financial Advisors | 24 580 | 0,00 | 785 | 9,79 | ||||
| 2025-08-07 | 13F | Resources Investment Advisors, LLC. | 28 850 | 15,63 | 921 | 26,86 | ||||
| 2025-08-07 | 13F | Americana Partners, LLC | 85 328 | 62,87 | 2 725 | 78,69 | ||||
| 2025-08-14 | 13F | GWM Advisors LLC | 7 665 | 0,00 | 245 | 9,42 | ||||
| 2025-07-14 | 13F | AdvisorNet Financial, Inc | 1 506 | −55,43 | 48 | −51,02 | ||||
| 2025-07-31 | 13F | Gill Capital Partners, Llc | 8 205 | 0,00 | 262 | 10,08 | ||||
| 2025-05-14 | 13F | CIBC Private Wealth Group, LLC | 0 | −100,00 | 0 | |||||
| 2025-08-13 | 13F | M Holdings Securities, Inc. | 23 233 | 8,08 | 1 | |||||
| 2025-08-06 | 13F | Founders Financial Securities Llc | 17 181 | 29,22 | 549 | 37,69 | ||||
| 2025-08-13 | 13F | SageView Advisory Group, LLC | 0 | −100,00 | 0 | |||||
| 2025-08-14 | 13F | Raymond James Financial Inc | 50 713 | −7,65 | 1 620 | 1,25 | ||||
| 2025-07-29 | 13F | Stratos Wealth Advisors, LLC | 74 345 | −6,15 | 2 375 | 2,95 | ||||
| 2025-07-31 | 13F | Schneider Downs Wealth Management Advisors, LP | 15 436 | 493 | ||||||
| 2025-04-29 | 13F | U.S. Capital Wealth Advisors, LLC | 0 | −100,00 | 0 | |||||
| 2025-08-14 | 13F | Benjamin Edwards Inc | 8 934 | 285 | ||||||
| 2025-08-08 | 13F | Capital Investment Advisory Services, LLC | 3 000 | 0,00 | 96 | 9,20 | ||||
| 2025-07-16 | 13F | PFS Partners, LLC | 1 726 | 55 | ||||||
| 2025-08-01 | 13F | Envestnet Asset Management Inc | 187 222 | 11,94 | 5 980 | 22,77 | ||||
| 2025-08-12 | 13F | Jpmorgan Chase & Co | 16 050 | 493,57 | 513 | 556,41 | ||||
| 2025-07-24 | 13F | Blair William & Co/il | 150 275 | −8,01 | 4 800 | 0,90 | ||||
| 2025-08-12 | 13F | Archer Investment Corp | 9 | 0,00 | 0 | |||||
| 2025-08-15 | 13F | Chapman Financial Group, Llc | 4 530 | 169,64 | 145 | 213,04 | ||||
| 2025-09-04 | 13F/A | Advisor Group Holdings, Inc. | 231 100 | 31,80 | 7 381 | 44,58 | ||||
| 2025-08-14 | 13F | UBS Group AG | 4 192 | −26,21 | 134 | −19,39 |