Grunnleggende statistikk
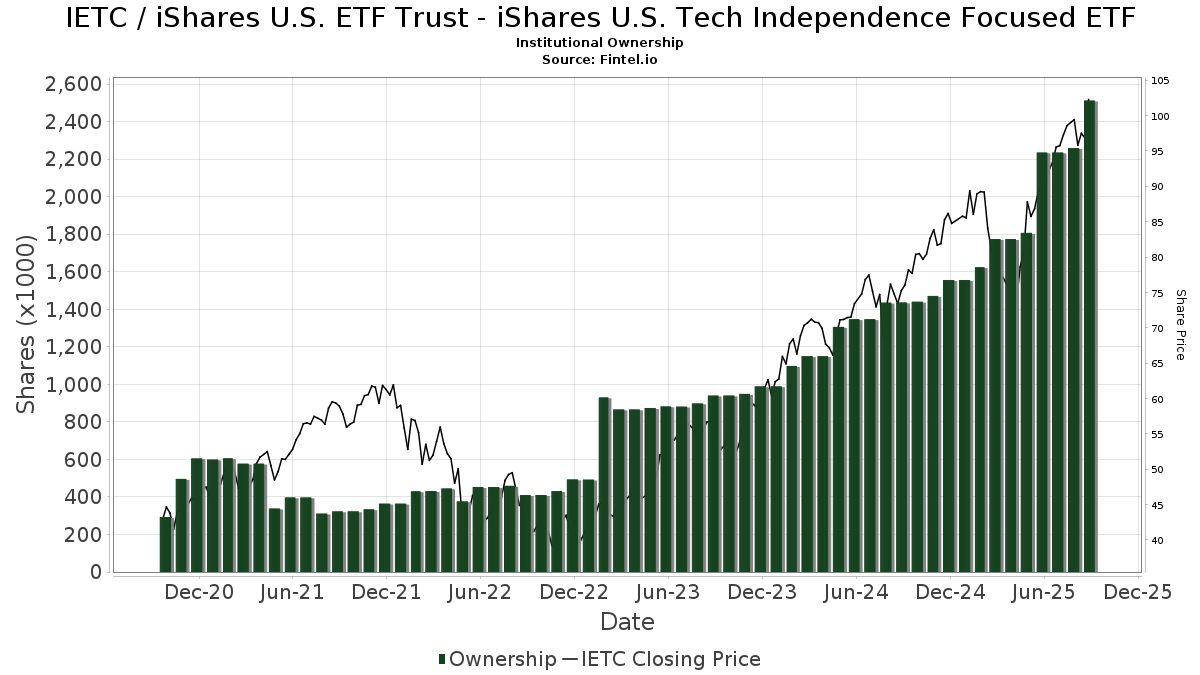
| Institusjonelle eiere | 106 total, 105 long only, 0 short only, 1 long/short - change of 22,99% MRQ |
| Gjennomsnittlig porteføljeallokering | 0.2307 % - change of 2,89% MRQ |
| Institusjonelle aksjer (Long) | 2 512 213 (ex 13D/G) - change of 0,28MM shares 12,36% MRQ |
| Institusjonell verdi (Long) | $ 223 349 USD ($1000) |
Institusjonelt eierskap og aksjonærer
iShares U.S. ETF Trust - iShares U.S. Tech Independence Focused ETF (US:IETC) har 106 institusjonelle eiere og aksjonærer som har sendt inn 13D/G- eller 13F-skjemaer til Securities Exchange Commission (SEC). Disse institusjonene eier til sammen 2,512,213 aksjer. De største aksjonærene inkluderer Kozak & Associates, Inc., Mirae Asset Global Investments Co., Ltd., Beacon Harbor Wealth Advisors, Inc., Gradient Investments LLC, Jpmorgan Chase & Co, LPL Financial LLC, Mml Investors Services, Llc, Raymond James Financial Inc, Integrated Wealth Concepts LLC, and Apexium Financial, Lp .
iShares U.S. ETF Trust - iShares U.S. Tech Independence Focused ETF (BATS:IETC) institusjonell eierstruktur viser nåværende posisjoner i selskapet fordelt på institusjoner og fond, samt de siste endringene i posisjonsstørrelse. De største aksjonærene kan være individuelle investorer, verdipapirfond, hedgefond eller institusjoner. Schedule 13D indikerer at investoren eier (eller har eid) mer enn 5 % av selskapet og har til hensikt (eller hadde til hensikt) å aktivt forfølge en endring i forretningsstrategien. Schedule 13G indikerer en passiv investering på over 5 %.
The share price as of September 10, 2025 is 102,28 / share. Previously, on September 11, 2024, the share price was 75,25 / share. This represents an increase of 35,93% over that period.
Fondssentiment-score
Fondssentiment Score (også kjent som akkumulering av eierskap poengsum) viser hvilke aksjer som er mest kjøpt av fond. Den er resultatet av en sofistikert, kvantitativ flerfaktormodell som identifiserer selskaper med de høyeste nivåene av institusjonell akkumulering. Beregningsmodellen for poeng bruker en kombinasjon av den totale økningen i antall offentliggjorte eiere, endringer i porteføljeallokeringen til disse eierne og andre beregninger. Tallet går fra 0 til 100, der høyere tall indikerer en høyere grad av akkumulering i forhold til sammenlignbare selskaper, der 50 er gjennomsnittet.
Oppdateringsfrekvens: Daglig
Sjekk ut Ownership Explorer, som inneholder en liste over de høyest rangerte selskapene.
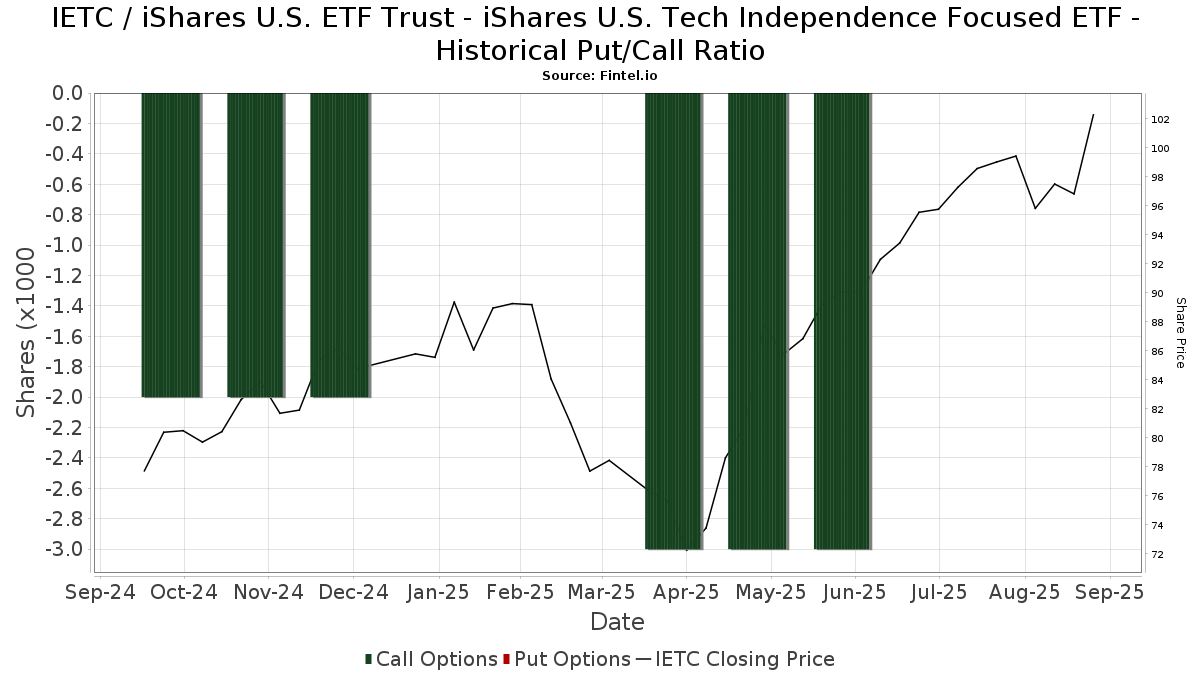
Institusjonell Put/Call-forhold
I tillegg til å rapportere standard aksje- og gjeldsemisjoner må institusjoner med mer enn 100 millioner kroner i forvaltningskapital også oppgi beholdningen av put- og callopsjoner. Siden put-opsjoner generelt indikerer et negativt sentiment, og call-opsjoner indikerer et positivt sentiment, kan vi få et inntrykk av det generelle institusjonelle sentimentet ved å plotte forholdet mellom put- og call-opsjoner. Diagrammet til høyre viser det historiske forholdet mellom put- og call-opsjoner for dette instrumentet.
Ved å bruke Put/Call-forholdet som en indikator på investorsentimentet kan man overvinne en av de viktigste svakhetene ved å bruke totalt institusjonelt eierskap, nemlig at en betydelig andel av forvaltningskapitalen investeres passivt for å følge indekser. Passivt forvaltede fond kjøper vanligvis ikke opsjoner, slik at indikatoren for put/call-forhold i større grad gjenspeiler stemningen i aktivt forvaltede fond.
13F- og NPORT-arkiveringer
Detaljer om 13F-arkiveringer er gratis. Detaljer om NP-arkiveringer krever et premium-medlemskap. Grønne rader indikerer nye posisjoner. Røde rader indikerer lukkede posisjoner. Klikk på lenke ikonet for å se hele transaksjonshistorikken.
Oppgrader
for å låse opp premiedata og eksportere til Excel. ![]() .
.
| Fildato | Kilde | Investor | Type | Gjennomsnittlig pris (estimert) |
Aksjer | Δ Aksjer (%) |
Rapportert verdi ($1000) | Verdi (%) | Portallokering (%) | |
|---|---|---|---|---|---|---|---|---|---|---|
| 2025-08-05 | 13F | Sigma Planning Corp | 8 667 | 13,35 | 815 | 42,06 | ||||
| 2025-07-10 | 13F | Sovran Advisors, LLC | 3 232 | 306 | ||||||
| 2025-07-02 | 13F | Central Pacific Bank - Trust Division | 71 | 0,00 | 7 | 20,00 | ||||
| 2025-05-12 | 13F | Fmr Llc | 0 | −100,00 | 0 | |||||
| 2025-07-29 | 13F | Mattson Financial Services, LLC | 22 382 | 10,51 | 2 104 | 38,63 | ||||
| 2025-08-04 | 13F | Assetmark, Inc | 21 624 | 70,24 | 2 033 | 113,67 | ||||
| 2025-08-12 | 13F | Steward Partners Investment Advisory, Llc | 267 | 25 | ||||||
| 2025-08-14 | 13F | Citadel Advisors Llc | 0 | −100,00 | 0 | |||||
| 2025-05-15 | 13F | Mariner, LLC | 0 | −100,00 | 0 | |||||
| 2025-08-13 | 13F | Northwestern Mutual Wealth Management Co | 45 676 | 740,10 | 4 294 | 954,79 | ||||
| 2025-08-06 | 13F | Mascagni Wealth Management, Inc. | 4 840 | 455 | ||||||
| 2025-08-12 | 13F | Proequities, Inc. | 0 | 0 | ||||||
| 2025-08-01 | 13F | Bessemer Group Inc | 2 165 | 0 | ||||||
| 2025-08-01 | 13F | Belvedere Trading LLC | Call | 3 900 | 367 | |||||
| 2025-08-01 | 13F | Belvedere Trading LLC | Put | 200 | 19 | |||||
| 2025-07-25 | 13F | Atria Wealth Solutions, Inc. | 55 773 | −4,40 | 5 243 | 19,90 | ||||
| 2025-07-08 | 13F | Gradient Investments LLC | 123 960 | 16,34 | 11 652 | 45,94 | ||||
| 2025-07-30 | 13F | TFB Advisors LLC | 4 080 | 34,65 | 384 | 68,72 | ||||
| 2025-08-15 | 13F | Equitable Holdings, Inc. | 8 508 | 2,43 | 800 | 28,46 | ||||
| 2025-08-05 | 13F | Tsfg, Llc | 100 | 0,00 | 0 | |||||
| 2025-07-24 | 13F | IFP Advisors, Inc | 45 | 4 | ||||||
| 2025-07-22 | 13F | Sutton Place Investors Llc | 27 491 | 0,42 | 2 584 | 25,99 | ||||
| 2025-08-11 | 13F | Regal Investment Advisors LLC | 4 428 | 0,05 | 416 | 25,68 | ||||
| 2025-07-28 | 13F | Private Wealth Asset Management, LLC | 267 | 0,00 | 25 | 25,00 | ||||
| 2025-08-14 | 13F | GWM Advisors LLC | 6 677 | 1 012,83 | 628 | 1 325,00 | ||||
| 2025-08-12 | 13F | Jpmorgan Chase & Co | 103 959 | 228,16 | 9 772 | 311,63 | ||||
| 2025-08-12 | 13F | BlackRock, Inc. | 62 | 0,00 | 6 | 25,00 | ||||
| 2025-07-21 | 13F | Ameritas Advisory Services, LLC | 12 951 | −26,95 | 1 217 | −18,43 | ||||
| 2025-08-14 | 13F | Hilltop Holdings Inc. | 2 167 | 204 | ||||||
| 2025-08-01 | 13F | Rossby Financial, LCC | 8 | 0,00 | 1 | |||||
| 2025-08-14 | 13F | Wells Fargo & Company/mn | 0 | 0 | ||||||
| 2025-07-29 | 13F | Hoese & Co LLP | 1 165 | 110 | ||||||
| 2025-07-08 | 13F | RMR Wealth Builders | 8 398 | −0,34 | 789 | 25,04 | ||||
| 2025-07-23 | 13F | Lansing Street Advisors | 12 331 | 5,82 | 1 159 | 32,76 | ||||
| 2025-08-13 | 13F | Continuum Advisory, LLC | 0 | −100,00 | 0 | |||||
| 2025-08-14 | 13F | Wiley Bros.-aintree Capital, Llc | 9 339 | 13,75 | 878 | 42,14 | ||||
| 2025-07-31 | 13F | Cambridge Investment Research Advisors, Inc. | 30 224 | 16,86 | 3 | 100,00 | ||||
| 2025-08-14 | 13F | Icon Wealth Advisors, LLC | 4 715 | 0,11 | 443 | 25,85 | ||||
| 2025-08-11 | 13F | Principal Securities, Inc. | 1 187 | 3 993,10 | 112 | 5 450,00 | ||||
| 2025-08-05 | 13F | Simplex Trading, Llc | 0 | −100,00 | 0 | |||||
| 2025-07-10 | 13F | Wealth Enhancement Advisory Services, Llc | 2 465 | 234 | ||||||
| 2025-08-08 | 13F | Creative Planning | 5 265 | −0,49 | 495 | 24,75 | ||||
| 2025-07-09 | 13F | Pallas Capital Advisors LLC | 2 383 | −81,44 | 224 | −76,80 | ||||
| 2025-08-08 | 13F | Beacon Harbor Wealth Advisors, Inc. | 129 257 | 12 150 | ||||||
| 2025-07-08 | 13F | Zrc Wealth Management, Llc | 1 | 0,00 | 0 | |||||
| 2025-08-08 | 13F | KM Capital Management Ltd. | 16 548 | −6,78 | 1 556 | 16,92 | ||||
| 2025-08-14 | 13F | Glen Eagle Advisors, LLC | 5 631 | 1,24 | 529 | 27,16 | ||||
| 2025-07-17 | 13F | Sound Income Strategies, LLC | 176 | 0,00 | 17 | 23,08 | ||||
| 2025-08-12 | 13F | Vestor Capital, Llc | 2 034 | 0 | ||||||
| 2025-08-04 | 13F | Spire Wealth Management | 20 | 0,00 | 2 | 0,00 | ||||
| 2025-07-22 | 13F | Bay Harbor Wealth Management, LLC | 5 849 | 0,00 | 550 | 25,34 | ||||
| 2025-08-06 | 13F | AE Wealth Management LLC | 10 959 | 16,02 | 1 030 | 45,69 | ||||
| 2025-08-14 | 13F | Comerica Bank | 317 | 30 | ||||||
| 2025-08-08 | 13F | Advisors Capital Management, LLC | 14 661 | 2,13 | 1 378 | 28,19 | ||||
| 2025-07-11 | 13F | Farther Finance Advisors, LLC | 398 | −5,01 | 37 | 19,35 | ||||
| 2025-08-08 | 13F | Comprehensive Financial Planning, Inc./PA | 4 793 | 13,61 | 451 | 42,41 | ||||
| 2025-07-08 | 13F | Ehrlich Financial Group | 2 790 | 262 | ||||||
| 2025-07-18 | 13F | Parsons Capital Management Inc/ri | 3 288 | 0,00 | 309 | 25,61 | ||||
| 2025-08-14 | 13F | Mml Investors Services, Llc | 98 609 | −4,83 | 9 | 28,57 | ||||
| 2025-07-24 | 13F | Fischer Investment Strategies, Llc | 2 932 | 276 | ||||||
| 2025-08-08 | 13F | Larson Financial Group LLC | 137 | 21,24 | 13 | 50,00 | ||||
| 2025-08-12 | 13F | LPL Financial LLC | 100 891 | 73,12 | 9 484 | 117,15 | ||||
| 2025-07-23 | 13F | BankPlus Trust Department | 71 | 0,00 | 7 | 20,00 | ||||
| 2025-08-13 | 13F | BCJ Capital Management, LLC | 54 527 | 20,18 | 5 126 | 50,74 | ||||
| 2025-08-14 | 13F | Federation des caisses Desjardins du Quebec | 708 | 0,00 | 67 | 24,53 | ||||
| 2025-08-14 | 13F | Kovitz Investment Group Partners, LLC | 5 125 | 482 | ||||||
| 2025-08-14 | 13F | McIlrath & Eck, LLC | 293 | 0,00 | 28 | 28,57 | ||||
| 2025-08-11 | 13F | Western Wealth Management, LLC | 2 258 | 212 | ||||||
| 2025-08-07 | 13F | Cascade Financial Partners, LLC | 2 250 | 212 | ||||||
| 2025-08-12 | 13F | Global Retirement Partners, LLC | 10 613 | 998 | ||||||
| 2025-07-23 | 13F | Ironwood Financial, llc | 11 018 | 0,00 | 826 | 0,00 | ||||
| 2025-08-13 | 13F | WCG Wealth Advisors LLC | 10 736 | 1 009 | ||||||
| 2025-08-14 | 13F | Jane Street Group, Llc | 11 875 | 1 116 | ||||||
| 2025-08-14 | 13F | Integrated Wealth Concepts LLC | 71 020 | −5,76 | 6 676 | 18,20 | ||||
| 2025-08-08 | 13F | Cetera Investment Advisers | 3 622 | 11,07 | 340 | 39,34 | ||||
| 2025-08-01 | 13F | Envestnet Asset Management Inc | 10 977 | 31,92 | 1 032 | 65,49 | ||||
| 2025-08-14 | 13F | Old Mission Capital Llc | 3 199 | 301 | ||||||
| 2025-08-13 | 13F | GeoWealth Management, LLC | 49 695 | 143,85 | 4 671 | 205,89 | ||||
| 2025-07-24 | 13F | Us Bancorp \de\ | 50 | 0,00 | 5 | 33,33 | ||||
| 2025-08-05 | 13F | Lord & Richards Wealth Management, LLC | 0 | −100,00 | 0 | |||||
| 2025-08-14 | 13F | Two Sigma Investments, Lp | 17 500 | −77,45 | 1 645 | −71,71 | ||||
| 2025-08-15 | 13F | Morgan Stanley | 3 096 | −5,03 | 291 | 19,26 | ||||
| 2025-05-13 | 13F | Bank Of Montreal /can/ | 0 | −100,00 | 0 | |||||
| 2025-08-13 | 13F | Cerity Partners LLC | 4 395 | 0,05 | 413 | 25,53 | ||||
| 2025-07-28 | 13F | Harbour Investments, Inc. | 91 | 0,00 | 9 | 33,33 | ||||
| 2025-07-07 | 13F | Nova Wealth Management, Inc. | 3 140 | 232,28 | 295 | 321,43 | ||||
| 2025-07-10 | 13F | Worth Asset Management, LLC | 2 768 | 260 | ||||||
| 2025-08-14 | 13F | Raymond James Financial Inc | 85 517 | 0,93 | 8 039 | 26,60 | ||||
| 2025-05-13 | 13F | UBS Group AG | 0 | −100,00 | 0 | |||||
| 2025-07-25 | 13F | Cwm, Llc | 256 | 0,00 | 0 | |||||
| 2025-07-10 | 13F | Signal Advisors Wealth, LLC | 2 657 | 250 | ||||||
| 2025-08-13 | 13F | Jones Financial Companies Lllp | 1 431 | 3 477,50 | 133 | 4 333,33 | ||||
| 2025-09-04 | 13F/A | Advisor Group Holdings, Inc. | 38 972 | 20,93 | 3 648 | 51,01 | ||||
| 2025-07-21 | 13F | Mirae Asset Global Investments Co., Ltd. | 140 751 | −30,74 | 13 231 | −13,41 | ||||
| 2025-07-15 | 13F | Financial Partners Group, Inc | 4 234 | 2,64 | 398 | 28,80 | ||||
| 2025-07-17 | 13F | HB Wealth Management, LLC | 2 500 | 235 | ||||||
| 2025-07-22 | 13F | Apexium Financial, Lp | 66 932 | 323,81 | 6 292 | 431,78 | ||||
| 2025-07-30 | 13F | Financial Perspectives, Inc | 10 708 | 4,52 | 1 007 | 23,44 | ||||
| 2025-07-18 | 13F | Truist Financial Corp | 20 427 | 0,19 | 1 920 | 25,74 | ||||
| 2025-08-13 | 13F | Haverford Trust Co | 3 115 | 0,00 | 293 | 25,32 | ||||
| 2025-08-14 | 13F | Stifel Financial Corp | 48 758 | −42,19 | 4 583 | −27,50 | ||||
| 2025-08-06 | 13F | Kcm Investment Advisors Llc | 9 636 | 0,00 | 906 | 25,35 | ||||
| 2025-08-14 | 13F | Royal Bank Of Canada | 6 374 | 15,16 | 599 | 44,34 | ||||
| 2025-08-14 | 13F | Susquehanna International Group, Llp | 21 932 | −66,62 | 2 062 | −58,14 | ||||
| 2025-07-10 | 13F | Kozak & Associates, Inc. | 682 461 | 0,48 | 65 209 | 29,76 | ||||
| 2025-07-15 | 13F | Patriot Investment Management Inc. | 11 009 | 1,28 | 1 035 | 27,03 | ||||
| 2025-07-23 | 13F | Richardson Capital Management LLC | 1 008 | 1,41 | 95 | 27,03 | ||||
| 2025-08-04 | 13F | Keybank National Association/oh | 27 304 | 2 567 | ||||||
| 2025-08-07 | 13F | Efficient Advisors, LLC | 17 985 | 62,69 | 1 691 | 104,11 | ||||
| 2025-08-15 | 13F | Tower Research Capital LLC (TRC) | 24 021 | 69,09 | 2 258 | 112,12 | ||||
| 2025-08-07 | 13F | Montag A & Associates Inc | 2 691 | −30,88 | 253 | −13,40 | ||||
| 2025-08-25 | 13F | Fulcrum Equity Management | 0 | −100,00 | 0 | |||||
| 2025-07-10 | 13F | Shira Ridge Wealth Management | 17 203 | −0,71 | 1 617 | 24,58 | ||||
| 2025-07-31 | 13F | Moloney Securities Asset Management, LLC | 7 735 | 0,00 | 727 | 25,56 | ||||
| 2025-08-15 | 13F | Kestra Advisory Services, LLC | 3 820 | 359 | ||||||
| 2025-08-06 | 13F | Commonwealth Equity Services, Llc | 11 269 | −9,88 | 1 | |||||
| 2025-08-14 | 13F | Goldman Sachs Group Inc | 24 717 | 70,15 | 2 323 | 113,51 | ||||
| 2025-08-07 | 13F | Allworth Financial LP | 1 600 | 0,00 | 150 | 22,95 |