Grunnleggende statistikk
| Institusjonelle eiere | 131 total, 131 long only, 0 short only, 0 long/short - change of 6,45% MRQ |
| Gjennomsnittlig porteføljeallokering | 0.2408 % - change of −11,68% MRQ |
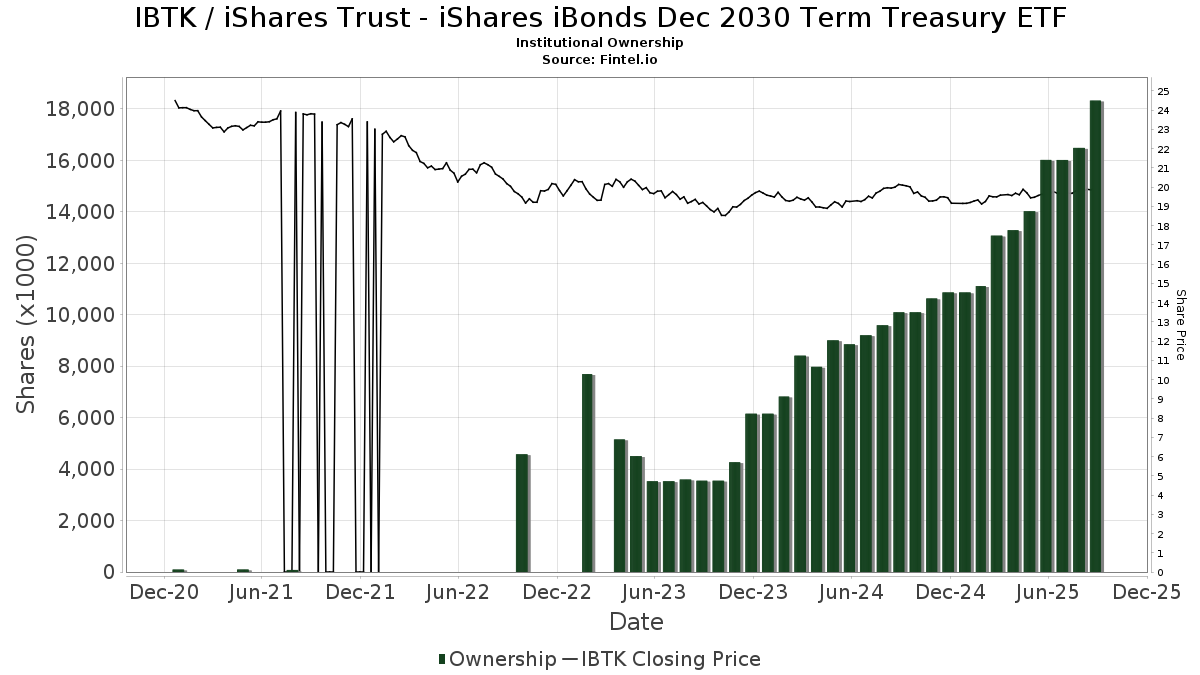
| Institusjonelle aksjer (Long) | 18 321 871 (ex 13D/G) - change of 2,31MM shares 14,40% MRQ |
| Institusjonell verdi (Long) | $ 350 101 USD ($1000) |
Institusjonelt eierskap og aksjonærer
iShares Trust - iShares iBonds Dec 2030 Term Treasury ETF (US:IBTK) har 131 institusjonelle eiere og aksjonærer som har sendt inn 13D/G- eller 13F-skjemaer til Securities Exchange Commission (SEC). Disse institusjonene eier til sammen 18,321,871 aksjer. De største aksjonærene inkluderer Wells Fargo & Company/mn, Bank Of America Corp /de/, Envestnet Asset Management Inc, Titleist Asset Management, Llc, D.a. Davidson & Co., Mercer Global Advisors Inc /adv, Royal Bank Of Canada, Waycross Investment Management Co, Legacy Private Trust Co., and Probity Advisors, Inc. .
iShares Trust - iShares iBonds Dec 2030 Term Treasury ETF (NasdaqGM:IBTK) institusjonell eierstruktur viser nåværende posisjoner i selskapet fordelt på institusjoner og fond, samt de siste endringene i posisjonsstørrelse. De største aksjonærene kan være individuelle investorer, verdipapirfond, hedgefond eller institusjoner. Schedule 13D indikerer at investoren eier (eller har eid) mer enn 5 % av selskapet og har til hensikt (eller hadde til hensikt) å aktivt forfølge en endring i forretningsstrategien. Schedule 13G indikerer en passiv investering på over 5 %.
The share price as of September 12, 2025 is 19,93 / share. Previously, on September 13, 2024, the share price was 20,16 / share. This represents a decline of 1,12% over that period.
Fondssentiment-score
Fondssentiment Score (også kjent som akkumulering av eierskap poengsum) viser hvilke aksjer som er mest kjøpt av fond. Den er resultatet av en sofistikert, kvantitativ flerfaktormodell som identifiserer selskaper med de høyeste nivåene av institusjonell akkumulering. Beregningsmodellen for poeng bruker en kombinasjon av den totale økningen i antall offentliggjorte eiere, endringer i porteføljeallokeringen til disse eierne og andre beregninger. Tallet går fra 0 til 100, der høyere tall indikerer en høyere grad av akkumulering i forhold til sammenlignbare selskaper, der 50 er gjennomsnittet.
Oppdateringsfrekvens: Daglig
Sjekk ut Ownership Explorer, som inneholder en liste over de høyest rangerte selskapene.
Institusjonell Put/Call-forhold
I tillegg til å rapportere standard aksje- og gjeldsemisjoner må institusjoner med mer enn 100 millioner kroner i forvaltningskapital også oppgi beholdningen av put- og callopsjoner. Siden put-opsjoner generelt indikerer et negativt sentiment, og call-opsjoner indikerer et positivt sentiment, kan vi få et inntrykk av det generelle institusjonelle sentimentet ved å plotte forholdet mellom put- og call-opsjoner. Diagrammet til høyre viser det historiske forholdet mellom put- og call-opsjoner for dette instrumentet.
Ved å bruke Put/Call-forholdet som en indikator på investorsentimentet kan man overvinne en av de viktigste svakhetene ved å bruke totalt institusjonelt eierskap, nemlig at en betydelig andel av forvaltningskapitalen investeres passivt for å følge indekser. Passivt forvaltede fond kjøper vanligvis ikke opsjoner, slik at indikatoren for put/call-forhold i større grad gjenspeiler stemningen i aktivt forvaltede fond.
13F- og NPORT-arkiveringer
Detaljer om 13F-arkiveringer er gratis. Detaljer om NP-arkiveringer krever et premium-medlemskap. Grønne rader indikerer nye posisjoner. Røde rader indikerer lukkede posisjoner. Klikk på lenke ikonet for å se hele transaksjonshistorikken.
Oppgrader
for å låse opp premiedata og eksportere til Excel. ![]() .
.
| Fildato | Kilde | Investor | Type | Gjennomsnittlig pris (estimert) |
Aksjer | Δ Aksjer (%) |
Rapportert verdi ($1000) | Verdi (%) | Portallokering (%) | |
|---|---|---|---|---|---|---|---|---|---|---|
| 2025-08-12 | 13F | Reliant Wealth Planning | 17 629 | 44,98 | 350 | 46,03 | ||||
| 2025-04-22 | 13F | Mendota Financial Group, LLC | 0 | −100,00 | 0 | |||||
| 2025-07-16 | 13F | Old Port Advisors | 40 959 | 813 | ||||||
| 2025-08-14 | 13F | Susquehanna International Group, Llp | 0 | −100,00 | 0 | |||||
| 2025-07-08 | 13F | FF Advisors,LLC | 81 087 | 4,12 | 1 609 | 4,82 | ||||
| 2025-08-07 | 13F | Allworth Financial LP | 57 294 | 5 341,03 | 1 137 | 5 580,00 | ||||
| 2025-07-14 | 13F | UMA Financial Services, Inc. | 7 935 | 0,00 | 157 | 0,64 | ||||
| 2025-07-24 | 13F/A | TFR Capital, LLC. | 10 162 | −12,48 | 202 | −11,84 | ||||
| 2025-07-08 | 13F | Apella Capital, LLC | 20 845 | 0,11 | 409 | 0,49 | ||||
| 2025-07-30 | 13F | Granite Harbor Advisors, Inc. | 18 721 | 0,00 | 371 | 0,82 | ||||
| 2025-08-06 | 13F | Commonwealth Equity Services, Llc | 133 536 | 1,01 | 3 | 0,00 | ||||
| 2025-08-14 | 13F | Jane Street Group, Llc | 86 295 | 200,15 | 1 712 | 203,01 | ||||
| 2025-08-11 | 13F | United Capital Financial Advisers, Llc | 141 633 | 98,76 | 2 810 | 100,64 | ||||
| 2025-05-12 | 13F | Fmr Llc | 0 | −100,00 | 0 | |||||
| 2025-07-28 | 13F | Harbour Investments, Inc. | 12 940 | 564,61 | 257 | 573,68 | ||||
| 2025-07-08 | 13F | Parallel Advisors, LLC | 139 395 | 12,02 | 2 766 | 13,04 | ||||
| 2025-07-11 | 13F | Compass Ion Advisors, LLC | 26 997 | 0,00 | 536 | 0,94 | ||||
| 2025-08-13 | 13F | Flow Traders U.s. Llc | 0 | −100,00 | 0 | |||||
| 2025-08-01 | 13F | Logan Capital Management Inc | 330 | 7 | ||||||
| 2025-07-17 | 13F | Stockman Wealth Management, Inc. | 208 753 | 6,86 | 4 142 | 7,84 | ||||
| 2025-09-04 | 13F/A | Advisor Group Holdings, Inc. | 21 130 | −50,76 | 419 | −50,30 | ||||
| 2025-08-15 | 13F | Howland Capital Management Llc | 125 243 | 0,44 | 2 485 | 1,35 | ||||
| 2025-08-15 | 13F | Captrust Financial Advisors | 30 499 | 20,11 | 605 | 21,24 | ||||
| 2025-07-15 | 13F | BCS Wealth Management | 0 | −100,00 | 0 | |||||
| 2025-05-07 | 13F | Spectrum Wealth Counsel, LLC | 2 542 | 0,00 | 50 | 2,08 | ||||
| 2025-08-11 | 13F | Principal Securities, Inc. | 1 095 | 0,00 | 22 | 0,00 | ||||
| 2025-08-14 | 13F | Eight 31 Financial Llc | 81 485 | −25,32 | 1 617 | −24,66 | ||||
| 2025-08-14 | 13F | Smartleaf Asset Management LLC | 84 418 | −1,60 | 1 671 | −0,83 | ||||
| 2025-08-12 | 13F | Jpmorgan Chase & Co | 0 | −100,00 | 0 | |||||
| 2025-08-15 | 13F | Kestra Advisory Services, LLC | 74 067 | 17,82 | 1 469 | 18,95 | ||||
| 2025-08-11 | 13F | Guidance Point Advisors, LLC | 15 391 | 5,79 | 305 | 6,64 | ||||
| 2025-07-23 | 13F | Country Club Bank /gfn | 101 284 | −5,89 | 2 004 | −5,11 | ||||
| 2025-07-23 | 13F | Waycross Investment Management Co | 543 723 | 0,18 | 10 787 | 1,10 | ||||
| 2025-08-01 | 13F | Bank of Jackson Hole Trust | 3 745 | 0,00 | 74 | 1,37 | ||||
| 2025-08-14 | 13F | Financial Engines Advisors L.L.C. | 58 608 | 0,44 | 1 163 | 1,39 | ||||
| 2025-08-01 | 13F | Liberty Wealth Management Llc | 14 017 | 278 | ||||||
| 2025-07-08 | 13F | Lowe Wealth Advisors, LLC | 4 937 | −19,50 | 98 | −19,17 | ||||
| 2025-08-04 | 13F | Creative Financial Designs Inc /adv | 196 | 0,00 | 4 | 0,00 | ||||
| 2025-08-11 | 13F | Atlantic Private Wealth, LLC | 39 594 | −54,01 | 786 | −53,61 | ||||
| 2025-07-14 | 13F | U.S. Capital Wealth Advisors, LLC | 45 454 | 5,53 | 902 | 6,50 | ||||
| 2025-07-30 | 13F | Journey Advisory Group, LLC | 165 083 | 186,62 | 3 275 | 189,31 | ||||
| 2025-07-30 | 13F | Bogart Wealth, LLC | 3 560 | 0,00 | 71 | 1,45 | ||||
| 2025-08-12 | 13F | Proequities, Inc. | 0 | 0 | ||||||
| 2025-07-07 | 13F | Trust Co | 409 469 | −0,21 | 8 124 | 0,71 | ||||
| 2025-08-14 | 13F | Comerica Bank | 8 216 | −24,38 | 163 | −23,47 | ||||
| 2025-08-14 | 13F | Hilltop Holdings Inc. | 11 706 | 232 | ||||||
| 2025-08-14 | 13F | UBS Group AG | 280 525 | 0,19 | 5 566 | 1,11 | ||||
| 2025-07-23 | 13F | Valmark Advisers, Inc. | 51 049 | 15,80 | 1 013 | 16,86 | ||||
| 2025-08-12 | 13F | Waterloo Capital, L.P. | 11 900 | 0,00 | 236 | 1,29 | ||||
| 2025-07-08 | 13F | Legacy Private Trust Co. | 514 453 | 0,49 | 10 207 | 1,40 | ||||
| 2025-07-29 | 13F | Accretive Wealth Partners, LLC | 163 473 | 4,81 | 3 243 | 5,74 | ||||
| 2025-08-14 | 13F | Ameriprise Financial Inc | 116 555 | 4,46 | 2 312 | 5,43 | ||||
| 2025-08-13 | 13F | Hamel Associates, Inc. | 12 044 | 239 | ||||||
| 2025-07-30 | 13F | Strategic Blueprint, LLC | 38 443 | 763 | ||||||
| 2025-07-11 | 13F | First PREMIER Bank | 849 | −5,88 | 0 | |||||
| 2025-07-08 | 13F | Nbc Securities, Inc. | 41 632 | −3,81 | 1 | |||||
| 2025-08-13 | 13F | Holos Integrated Wealth LLC | 2 078 | 0,00 | 41 | 2,50 | ||||
| 2025-08-12 | 13F | Passive Capital Management, LLC. | 15 941 | 0,00 | 314 | 0,32 | ||||
| 2025-07-25 | 13F | Cwm, Llc | 17 570 | 28,84 | 0 | |||||
| 2025-07-14 | 13F | Mechanics Bank Trust Department | 94 500 | 5,29 | 1 875 | 6,24 | ||||
| 2025-07-24 | 13F | Leo Wealth, LLC | 25 096 | 1,76 | 498 | 2,69 | ||||
| 2025-08-12 | 13F | BlackRock, Inc. | 214 153 | 4 249 | ||||||
| 2025-08-07 | 13F | CENTRAL TRUST Co | 255 197 | 8,93 | 5 063 | 9,95 | ||||
| 2025-08-14 | 13F | Citadel Advisors Llc | 30 726 | −52,34 | 610 | −51,93 | ||||
| 2025-08-14 | 13F | Mml Investors Services, Llc | 24 934 | 137,15 | 0 | |||||
| 2025-08-05 | 13F | Cherry Tree Wealth Management, LLC | 4 963 | 14,12 | 98 | 15,29 | ||||
| 2025-08-14 | 13F | STAR Financial Bank | 106 985 | 10,92 | 2 123 | 11,92 | ||||
| 2025-08-18 | 13F/A | National Bank Of Canada /fi/ | 735 | 15 | ||||||
| 2025-07-09 | 13F | Krilogy Financial LLC | 372 535 | −0,08 | 7 391 | 0,83 | ||||
| 2025-07-14 | 13F | Park Avenue Securities Llc | 82 109 | 2 | ||||||
| 2025-08-15 | 13F | Morgan Stanley | 114 256 | 123,27 | 2 267 | 125,25 | ||||
| 2025-07-22 | 13F | Yoder Wealth Management, Inc. | 40 302 | 3,20 | 800 | 4,17 | ||||
| 2025-04-21 | 13F | Community Bank, N.A. | 0 | −100,00 | 0 | |||||
| 2025-07-24 | 13F | IFP Advisors, Inc | 125 270 | −3,11 | 2 485 | −2,20 | ||||
| 2025-08-01 | 13F | Envestnet Asset Management Inc | 1 152 213 | 83,76 | 22 860 | 85,44 | ||||
| 2025-08-07 | 13F | PFG Advisors | 47 524 | 943 | ||||||
| 2025-08-14 | 13F | Royal Bank Of Canada | 583 163 | 79,32 | 11 571 | 80,97 | ||||
| 2025-08-13 | 13F | Capital Analysts, Inc. | 2 354 | 0,00 | 0 | |||||
| 2025-05-06 | 13F | Venturi Wealth Management, LLC | 0 | −100,00 | 0 | |||||
| 2025-08-14 | 13F | GWM Advisors LLC | 7 352 | −83,09 | 146 | −83,02 | ||||
| 2025-08-18 | 13F/A | Kestra Investment Management, LLC | 17 745 | −49,58 | 352 | −49,06 | ||||
| 2025-07-29 | 13F | Mb, Levis & Associates, Llc | 848 | 0,95 | 17 | 0,00 | ||||
| 2025-04-29 | 13F | Element Wealth, LLC | 0 | −100,00 | 0 | |||||
| 2025-08-14 | 13F | Mercer Global Advisors Inc /adv | 639 493 | 886,29 | 12 688 | 895,84 | ||||
| 2025-08-14 | 13F | Integrated Wealth Concepts LLC | 62 996 | 0,24 | 1 250 | 1,13 | ||||
| 2025-08-13 | 13F | Cary Street Partners Financial Llc | 36 551 | 0,00 | 725 | 0,97 | ||||
| 2025-07-17 | 13F/A | Capital Investment Advisors, LLC | 14 720 | 25,03 | 292 | 26,41 | ||||
| 2025-08-14 | 13F | Stifel Financial Corp | 60 955 | 56,90 | 1 209 | 58,45 | ||||
| 2025-07-31 | 13F | Keeler THomas Management LLC | 79 894 | 28,12 | 1 585 | 29,39 | ||||
| 2025-08-07 | 13F | Parkside Financial Bank & Trust | 524 | 0,96 | 10 | 0,00 | ||||
| 2025-08-12 | 13F | Titleist Asset Management, Llc | 1 029 829 | 139,22 | 20 432 | 141,42 | ||||
| 2025-07-21 | 13F | Barrett & Company, Inc. | 4 163 | 125,03 | 83 | 127,78 | ||||
| 2025-08-11 | 13F | Private Advisor Group, LLC | 84 418 | −1,60 | 1 675 | −0,71 | ||||
| 2025-08-08 | 13F | Pnc Financial Services Group, Inc. | 71 | 0,00 | 1 | 0,00 | ||||
| 2025-07-16 | 13F | Rebalance, Llc | 11 274 | 224 | ||||||
| 2025-07-23 | 13F | Evexia Wealth Llc | 71 419 | 58,71 | 1 404 | 59,43 | ||||
| 2025-08-14 | 13F | Bank Of America Corp /de/ | 1 379 043 | 15,69 | 27 360 | 16,75 | ||||
| 2025-07-10 | 13F | Wealth Enhancement Advisory Services, Llc | 185 263 | 5,95 | 3 640 | 5,91 | ||||
| 2025-08-14 | 13F | AllSquare Wealth Management LLC | 22 266 | 0,69 | 442 | 1,61 | ||||
| 2025-07-17 | 13F | Chatham Capital Group, Inc. | 95 395 | 18,30 | 1 893 | 19,37 | ||||
| 2025-08-12 | 13F | Richmond Investment Services, LLC | 39 152 | 97,76 | 777 | 99,49 | ||||
| 2025-08-13 | 13F | Cerity Partners LLC | 23 884 | −0,37 | 474 | 0,42 | ||||
| 2025-08-08 | 13F | TD Capital Management LLC | 2 220 | 1,00 | 44 | 2,33 | ||||
| 2025-08-13 | 13F | Boston Family Office Llc | 99 546 | 24,46 | 2 | 0,00 | ||||
| 2025-08-14 | 13F | Goldman Sachs Group Inc | 0 | −100,00 | 0 | |||||
| 2025-08-19 | 13F | Asset Dedication, LLC | 3 384 | 13,63 | 67 | 15,52 | ||||
| 2025-07-21 | 13F | Crews Bank & Trust | 1 200 | 0,00 | 24 | 0,00 | ||||
| 2025-08-14 | 13F | Wells Fargo & Company/mn | 2 689 736 | 2,50 | 53 364 | 3,44 | ||||
| 2025-07-31 | 13F | Leavell Investment Management, Inc. | 13 725 | 272 | ||||||
| 2025-08-12 | 13F | Steward Partners Investment Advisory, Llc | 1 470 | 55,72 | 29 | 61,11 | ||||
| 2025-07-24 | 13F | Ronald Blue Trust, Inc. | 408 | 0,00 | 8 | 0,00 | ||||
| 2025-08-05 | 13F | Fullcircle Wealth Llc | 13 813 | 0,00 | 274 | 0,00 | ||||
| 2025-08-14 | 13F | Snowden Capital Advisors LLC | 427 386 | −0,25 | 8 479 | 0,66 | ||||
| 2025-05-02 | 13F | Whittier Trust Co | 0 | −100,00 | 0 | |||||
| 2025-08-12 | 13F | Associated Banc-corp | 50 546 | 15,98 | 1 003 | 17,06 | ||||
| 2025-07-01 | 13F | Confluence Investment Management Llc | 393 507 | −0,49 | 7 807 | 0,42 | ||||
| 2025-07-11 | 13F | Prosperity Planning, Inc. | 308 | 5,14 | ||||||
| 2025-05-12 | 13F | C2P Capital Advisory Group, LLC d.b.a. Prosperity Capital Advisors | 0 | −100,00 | 0 | −100,00 | ||||
| 2025-04-14 | 13F | Farther Finance Advisors, LLC | 0 | −100,00 | 0 | |||||
| 2025-07-08 | 13F | Atwood & Palmer Inc | 99 110 | −91,22 | 1 966 | −91,14 | ||||
| 2025-08-01 | 13F | James Investment Research Inc | 14 350 | 0,00 | 285 | 0,71 | ||||
| 2025-08-12 | 13F | LPL Financial LLC | 203 772 | −16,83 | 4 043 | −16,07 | ||||
| 2025-08-06 | 13F | AE Wealth Management LLC | 8 | 0 | ||||||
| 2025-08-08 | 13F | Cetera Investment Advisers | 253 494 | 4,51 | 5 029 | 5,47 | ||||
| 2025-07-30 | 13F | D.a. Davidson & Co. | 745 879 | 146,59 | 14 798 | 148,87 | ||||
| 2025-08-08 | 13F | Mv Capital Management, Inc. | 43 300 | 13,42 | 859 | 14,53 | ||||
| 2025-07-30 | 13F | Probity Advisors, Inc. | 435 300 | 4,57 | 8 636 | 5,54 | ||||
| 2025-07-21 | 13F | Cliftonlarsonallen Wealth Advisors, Llc | 82 180 | 111,74 | 1 630 | 113,63 | ||||
| 2025-08-08 | 13F | Thoroughbred Financial Services, Llc | 121 018 | −8,59 | 2 | 0,00 | ||||
| 2025-05-12 | 13F | Kohmann Bosshard Financial Services, LLC | 0 | −100,00 | 0 | |||||
| 2025-08-12 | 13F | Jaffetilchin Investment Partners, LLC | 13 369 | 0,98 | 265 | 1,92 | ||||
| 2025-08-08 | 13F | WASHINGTON TRUST Co | 0 | −100,00 | 0 | |||||
| 2025-08-12 | 13F | Coldstream Capital Management Inc | 14 739 | 0,00 | 292 | 1,04 | ||||
| 2025-07-17 | 13F | Janney Montgomery Scott LLC | 134 320 | 0,54 | 3 | 0,00 | ||||
| 2025-08-15 | 13F | Equitable Holdings, Inc. | 19 878 | 1,04 | 394 | 2,07 | ||||
| 2025-08-11 | 13F | HighTower Advisors, LLC | 145 363 | 1,79 | 2 884 | 2,74 | ||||
| 2025-07-16 | 13F | Signaturefd, Llc | 39 619 | 106,01 | 786 | 107,94 | ||||
| 2025-07-21 | 13F | Exchange Capital Management, Inc. | 16 239 | 2,26 | 322 | 3,21 | ||||
| 2025-07-24 | 13F | Us Bancorp \de\ | 3 360 | 61,54 | 67 | 65,00 | ||||
| 2025-08-14 | 13F | Raymond James Financial Inc | 402 086 | −19,20 | 7 977 | −18,46 | ||||
| 2025-08-14 | 13F | Colony Group, LLC | 32 307 | 10,15 | 641 | 11,11 | ||||
| 2025-08-12 | 13F | Jacobi Capital Management LLC | 19 219 | 6,30 | 381 | 7,32 | ||||
| 2025-07-31 | 13F | United Community Bank | 13 060 | 0,00 | 259 | 1,17 | ||||
| 2025-07-11 | 13F | Shelton Wealth Management, Llc | 385 684 | 4,88 | 7 652 | 5,84 | ||||
| 2025-07-30 | 13F | DecisionMap Wealth Management, LLC | 17 228 | 21,38 | 342 | 22,22 | ||||
| 2025-07-15 | 13F | Garrett Investment Advisors LLC | 13 602 | 0,56 | 270 | 1,51 | ||||
| 2025-07-31 | 13F | Cambridge Investment Research Advisors, Inc. | 11 958 | −28,67 | 0 | |||||
| 2025-08-13 | 13F | Northwestern Mutual Wealth Management Co | 83 733 | 11,59 | 1 661 | 12,61 |