Grunnleggende statistikk
| Institusjonelle eiere | 176 total, 176 long only, 0 short only, 0 long/short - change of −1,12% MRQ |
| Gjennomsnittlig porteføljeallokering | 0.1482 % - change of −6,24% MRQ |
| Institusjonelle aksjer (Long) | 46 435 842 (ex 13D/G) - change of 18,27MM shares 64,85% MRQ |
| Institusjonell verdi (Long) | $ 390 779 USD ($1000) |
Institusjonelt eierskap og aksjonærer
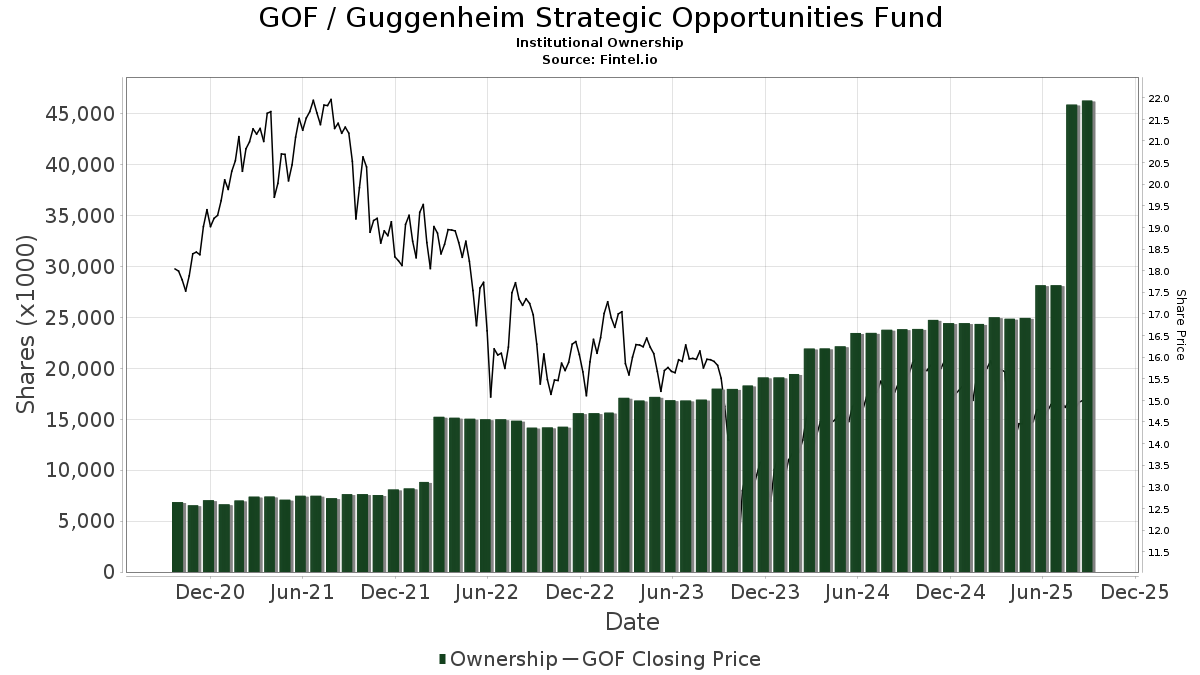
Guggenheim Strategic Opportunities Fund (US:GOF) har 176 institusjonelle eiere og aksjonærer som har sendt inn 13D/G- eller 13F-skjemaer til Securities Exchange Commission (SEC). Disse institusjonene eier til sammen 46,435,842 aksjer. De største aksjonærene inkluderer Kingstone Capital Partners Texas, LLC, Morgan Stanley, LPL Financial LLC, Verus Capital Partners, Llc, UBS Group AG, Raymond James Financial Inc, Mml Investors Services, Llc, Advisor Group Holdings, Inc., Change Path, LLC, and Envestnet Asset Management Inc .
Guggenheim Strategic Opportunities Fund (NYSE:GOF) institusjonell eierstruktur viser nåværende posisjoner i selskapet fordelt på institusjoner og fond, samt de siste endringene i posisjonsstørrelse. De største aksjonærene kan være individuelle investorer, verdipapirfond, hedgefond eller institusjoner. Schedule 13D indikerer at investoren eier (eller har eid) mer enn 5 % av selskapet og har til hensikt (eller hadde til hensikt) å aktivt forfølge en endring i forretningsstrategien. Schedule 13G indikerer en passiv investering på over 5 %.
The share price as of September 11, 2025 is 15,00 / share. Previously, on September 12, 2024, the share price was 15,47 / share. This represents a decline of 3,04% over that period.
Fondssentiment-score
Fondssentiment Score (også kjent som akkumulering av eierskap poengsum) viser hvilke aksjer som er mest kjøpt av fond. Den er resultatet av en sofistikert, kvantitativ flerfaktormodell som identifiserer selskaper med de høyeste nivåene av institusjonell akkumulering. Beregningsmodellen for poeng bruker en kombinasjon av den totale økningen i antall offentliggjorte eiere, endringer i porteføljeallokeringen til disse eierne og andre beregninger. Tallet går fra 0 til 100, der høyere tall indikerer en høyere grad av akkumulering i forhold til sammenlignbare selskaper, der 50 er gjennomsnittet.
Oppdateringsfrekvens: Daglig
Sjekk ut Ownership Explorer, som inneholder en liste over de høyest rangerte selskapene.
Institusjonell Put/Call-forhold
I tillegg til å rapportere standard aksje- og gjeldsemisjoner må institusjoner med mer enn 100 millioner kroner i forvaltningskapital også oppgi beholdningen av put- og callopsjoner. Siden put-opsjoner generelt indikerer et negativt sentiment, og call-opsjoner indikerer et positivt sentiment, kan vi få et inntrykk av det generelle institusjonelle sentimentet ved å plotte forholdet mellom put- og call-opsjoner. Diagrammet til høyre viser det historiske forholdet mellom put- og call-opsjoner for dette instrumentet.
Ved å bruke Put/Call-forholdet som en indikator på investorsentimentet kan man overvinne en av de viktigste svakhetene ved å bruke totalt institusjonelt eierskap, nemlig at en betydelig andel av forvaltningskapitalen investeres passivt for å følge indekser. Passivt forvaltede fond kjøper vanligvis ikke opsjoner, slik at indikatoren for put/call-forhold i større grad gjenspeiler stemningen i aktivt forvaltede fond.
13F- og NPORT-arkiveringer
Detaljer om 13F-arkiveringer er gratis. Detaljer om NP-arkiveringer krever et premium-medlemskap. Grønne rader indikerer nye posisjoner. Røde rader indikerer lukkede posisjoner. Klikk på lenke ikonet for å se hele transaksjonshistorikken.
Oppgrader
for å låse opp premiedata og eksportere til Excel. ![]() .
.
| Fildato | Kilde | Investor | Type | Gjennomsnittlig pris (estimert) |
Aksjer | Δ Aksjer (%) |
Rapportert verdi ($1000) | Verdi (%) | Portallokering (%) | |
|---|---|---|---|---|---|---|---|---|---|---|
| 2025-07-09 | 13F | Dynamic Advisor Solutions LLC | 77 521 | 2,65 | 1 154 | −1,79 | ||||
| 2025-04-23 | 13F | Walkner Condon Financial Advisors LLC | 0 | −100,00 | 0 | |||||
| 2025-08-26 | 13F/A | Thrivent Financial For Lutherans | 0 | −100,00 | 0 | |||||
| 2025-07-14 | 13F | Bank & Trust Co | 32 | 0,00 | 0 | |||||
| 2025-07-08 | 13F | Nbc Securities, Inc. | 22 523 | 11,93 | 0 | |||||
| 2025-08-01 | 13F | Envestnet Asset Management Inc | 730 756 | 70,77 | 10 881 | 63,31 | ||||
| 2025-08-11 | 13F | Semus Wealth Partners LLC | 21 028 | −3,66 | 313 | −7,67 | ||||
| 2025-08-12 | 13F | Founders Financial Alliance, LLC | 112 171 | −1,83 | 1 670 | −6,07 | ||||
| 2025-07-15 | 13F | Kentucky Trust Co | 1 500 | 0,00 | 22 | −4,35 | ||||
| 2025-07-18 | 13F | PFG Investments, LLC | 73 707 | 2,48 | 1 097 | −1,97 | ||||
| 2025-08-14 | 13F | Integrated Wealth Concepts LLC | 207 675 | 11,52 | 3 092 | 6,66 | ||||
| 2025-08-07 | 13F | Verus Capital Partners, Llc | 1 877 230 | 19,36 | 27 952 | 14,15 | ||||
| 2025-07-14 | 13F | Capital CS Group, LLC | 21 441 | 3,96 | 319 | −0,62 | ||||
| 2025-07-21 | 13F | Empirical Financial Services, LLC d.b.a. Empirical Wealth Management | 14 539 | 0,00 | 216 | −4,42 | ||||
| 2025-07-18 | 13F | Truist Financial Corp | 316 322 | 42,60 | 4 710 | 36,40 | ||||
| 2025-07-21 | 13F | Ameriflex Group, Inc. | 695 | 2,66 | 10 | 0,00 | ||||
| 2025-08-13 | 13F | Baird Financial Group, Inc. | 199 877 | 11,09 | 2 976 | 6,25 | ||||
| 2025-08-08 | 13F | Avantax Advisory Services, Inc. | 78 710 | 2,39 | 1 172 | −2,09 | ||||
| 2025-07-10 | 13F | Sovran Advisors, LLC | 80 886 | −11,38 | 1 211 | −7,42 | ||||
| 2025-08-12 | 13F | J.w. Cole Advisors, Inc. | 19 747 | 22,24 | 294 | 17,13 | ||||
| 2025-07-29 | 13F | Private Trust Co Na | 713 | 0,00 | 11 | −9,09 | ||||
| 2025-04-21 | 13F | ORG Partners LLC | 0 | −100,00 | 0 | |||||
| 2025-08-04 | 13F | Daymark Wealth Partners, Llc | 12 301 | 183 | ||||||
| 2025-07-03 | 13F | Garde Capital, Inc. | 2 258 | 0,00 | 34 | −5,71 | ||||
| 2025-07-08 | 13F | Zrc Wealth Management, Llc | 0 | −100,00 | 0 | |||||
| 2025-08-27 | 13F/A | Brinker Capital Investments, LLC | 27 975 | 113,53 | 417 | 104,93 | ||||
| 2025-08-11 | 13F | Pin Oak Investment Advisors Inc | 3 122 | 3,51 | 0 | |||||
| 2025-05-14 | 13F | Semmax Financial Advisors Inc. | 0 | −100,00 | 0 | |||||
| 2025-08-14 | 13F | IHT Wealth Management, LLC | 11 015 | −2,55 | 164 | −6,29 | ||||
| 2025-07-22 | 13F | Firethorn Wealth Partners, Llc | 10 588 | 3,76 | 158 | −0,63 | ||||
| 2025-08-08 | 13F | Larson Financial Group LLC | 2 293 | 0,97 | 34 | −2,86 | ||||
| 2025-08-15 | 13F | Kestra Advisory Services, LLC | 128 699 | 198,03 | 1 916 | 185,12 | ||||
| 2025-05-19 | 13F | Smith Asset Management Co., LLC | 19 395 | 302 | ||||||
| 2025-08-05 | 13F | Tsfg, Llc | 11 900 | 0,08 | 0 | |||||
| 2025-07-31 | 13F | WFA Asset Management Corp | 21 660 | 28,94 | 323 | 34,17 | ||||
| 2025-08-11 | 13F | Perennial Investment Advisors, LLC | 19 489 | 21,97 | 290 | 16,94 | ||||
| 2025-08-11 | 13F | Private Advisor Group, LLC | 102 502 | 3,72 | 1 526 | −0,78 | ||||
| 2025-08-14 | 13F | UBS Group AG | 1 522 861 | 3,41 | 22 675 | −1,10 | ||||
| 2025-05-05 | 13F | Transce3nd, LLC | 0 | −100,00 | 0 | |||||
| 2025-05-16 | 13F | Coppell Advisory Solutions LLC | 0 | −100,00 | 0 | |||||
| 2025-08-15 | 13F | Equitable Holdings, Inc. | 48 243 | 11,86 | 718 | 7,00 | ||||
| 2025-07-10 | 13F | Oliver Lagore Vanvalin Investment Group | 2 110 | 0,00 | 33 | 0,00 | ||||
| 2025-04-16 | 13F | Fortitude Family Office, LLC | 0 | −100,00 | 0 | |||||
| 2025-04-22 | 13F | TrueMark Investments, LLC | 0 | −100,00 | 0 | |||||
| 2025-08-14 | 13F | Smartleaf Asset Management LLC | 6 | 0,00 | 0 | |||||
| 2025-08-14 | 13F | Tennessee Valley Asset Management Partners | 0 | −100,00 | 0 | |||||
| 2025-08-05 | 13F | Bank of New York Mellon Corp | 201 781 | 540,45 | 3 005 | 513,06 | ||||
| 2025-08-12 | 13F | Global Retirement Partners, LLC | 14 510 | 240,21 | 216 | 232,31 | ||||
| 2025-08-14 | 13F | Warren Averett Asset Management, LLC | 19 855 | 0,00 | 296 | −4,53 | ||||
| 2025-08-12 | 13F | Jacobi Capital Management LLC | 30 538 | 22,94 | 455 | 17,62 | ||||
| 2025-08-14 | 13F | Ausdal Financial Partners, Inc. | 78 518 | −0,03 | 1 169 | −4,34 | ||||
| 2025-08-12 | 13F | PSI Advisors, LLC | 0 | −100,00 | 0 | |||||
| 2025-08-06 | 13F | AE Wealth Management LLC | 24 079 | 3,61 | 359 | −0,83 | ||||
| 2025-07-17 | 13F | Beacon Capital Management, LLC | 1 983 | 0,00 | 30 | −3,33 | ||||
| 2025-07-08 | 13F | Parisi Gray Wealth Management | 50 975 | 0,00 | 759 | −4,29 | ||||
| 2025-07-31 | 13F | Cambridge Investment Research Advisors, Inc. | 236 170 | −63,37 | 4 | −70,00 | ||||
| 2025-08-12 | 13F | LPL Financial LLC | 2 051 627 | 5,57 | 30 549 | 0,96 | ||||
| 2025-08-05 | 13F | Prosperity Wealth Management, Inc. | 21 700 | 14,20 | 323 | 9,49 | ||||
| 2025-07-14 | 13F | Gridiron Partners, LLC | 10 000 | 0,00 | 149 | −4,52 | ||||
| 2025-08-14 | 13F | Ameriprise Financial Inc | 68 229 | −5,26 | 1 016 | −9,46 | ||||
| 2025-08-14 | 13F | Gen-Wealth Partners Inc | 659 | 0,00 | 10 | −10,00 | ||||
| 2025-07-09 | 13F | Fiduciary Alliance LLC | 43 312 | −3,48 | 645 | −7,74 | ||||
| 2025-08-08 | 13F | Foundations Investment Advisors, LLC | 12 904 | 19,93 | 192 | 14,97 | ||||
| 2025-08-29 | 13F | Total Investment Management Inc | 79 | 1 | ||||||
| 2025-05-09 | 13F | Gill Capital Partners, Llc | 0 | −100,00 | 0 | |||||
| 2025-07-10 | 13F | Focus Financial Network, Inc. | 55 205 | 22,41 | 822 | 16,95 | ||||
| 2025-08-08 | 13F | Cetera Investment Advisers | 679 066 | 11,96 | 10 111 | 7,07 | ||||
| 2025-08-08 | 13F | Capital Investment Advisory Services, LLC | 83 750 | 92,31 | 1 247 | 83,92 | ||||
| 2025-08-12 | 13F | Proequities, Inc. | 0 | 0 | ||||||
| 2025-08-18 | 13F | Geneos Wealth Management Inc. | 59 038 | 100,72 | 879 | 92,34 | ||||
| 2025-08-05 | 13F | Milestone Asset Management, Llc | 13 835 | −88,26 | 206 | −88,77 | ||||
| 2025-08-07 | 13F | New England Private Wealth Advisors LLC | 43 327 | −2,26 | 643 | −6,96 | ||||
| 2025-05-02 | 13F | Transcendent Capital Group LLC | 0 | −100,00 | 0 | |||||
| 2025-08-11 | 13F | Mosaic Family Wealth Partners, Llc | 227 244 | 4,14 | 3 384 | −0,41 | ||||
| 2025-08-07 | 13F | Vista Investment Partners Ii, Llc | 14 592 | −2,34 | 217 | −6,47 | ||||
| 2025-08-13 | 13F | Jones Financial Companies Lllp | 0 | −100,00 | 0 | |||||
| 2025-08-13 | 13F | Rsm Us Wealth Management Llc | 69 301 | 0,00 | 1 032 | −4,45 | ||||
| 2025-08-28 | NP | Cohen & Steers Closed-end Opportunity Fund, Inc. | 346 789 | −10,34 | 5 164 | −14,26 | ||||
| 2025-08-07 | 13F | Illumine Investment Management, LLC | 216 834 | 1,36 | 3 229 | −3,06 | ||||
| 2025-08-12 | 13F | Insigneo Advisory Services, Llc | 33 166 | 0,00 | 494 | −4,46 | ||||
| 2025-08-13 | 13F | Fisher Asset Management, LLC | 13 964 | 208 | ||||||
| 2025-08-06 | 13F | Wedbush Securities Inc | 176 925 | −2,36 | 3 | 0,00 | ||||
| 2025-07-15 | 13F | LVZ Advisors, Inc. | 12 682 | −10,75 | 189 | −14,93 | ||||
| 2025-07-10 | 13F | Secure Asset Management, LLC | 433 655 | −2,26 | 6 457 | −6,52 | ||||
| 2025-08-11 | 13F | Western Wealth Management, LLC | 36 808 | 3,07 | 548 | −1,44 | ||||
| 2025-08-07 | 13F | Encompass More Asset Management | 24 430 | 13,02 | 364 | 8,04 | ||||
| 2025-05-08 | 13F | Main Street Financial Solutions, LLC | 0 | −100,00 | 0 | |||||
| 2025-07-15 | 13F | Mather Group, Llc. | 0 | −100,00 | 0 | |||||
| 2025-07-23 | 13F | Elm3 Financial Group, LLC | 13 667 | −0,07 | 204 | −4,25 | ||||
| 2025-07-30 | 13F | Retirement Planning Group | 115 420 | 30,97 | 1 719 | 25,22 | ||||
| 2025-07-25 | 13F | Almanack Investment Partners, LLC. | 230 090 | 0,19 | 3 426 | −4,17 | ||||
| 2025-07-24 | 13F | Us Bancorp \de\ | 186 | 0,00 | 3 | 0,00 | ||||
| 2025-07-24 | 13F | IFP Advisors, Inc | 97 | −99,43 | 1 | −99,62 | ||||
| 2025-08-04 | 13F | Bay Colony Advisory Group, Inc d/b/a Bay Colony Advisors | 222 731 | −13,87 | 3 316 | −17,47 | ||||
| 2025-07-21 | 13F | Patriot Financial Group Insurance Agency, LLC | 20 059 | 2,71 | 299 | −1,97 | ||||
| 2025-04-30 | 13F | Allworth Financial LP | 0 | −100,00 | 0 | |||||
| 2025-07-28 | 13F | Harbour Investments, Inc. | 12 764 | −6,44 | 190 | −10,38 | ||||
| 2025-08-11 | 13F | FSA Wealth Management LLC | 4 676 | 0,00 | 70 | −4,17 | ||||
| 2025-08-12 | 13F | MAI Capital Management | 3 417 | 3,95 | 51 | −1,96 | ||||
| 2025-07-11 | 13F | Farther Finance Advisors, LLC | 26 | −99,40 | 0 | −100,00 | ||||
| 2025-08-14 | 13F | Mml Investors Services, Llc | 801 302 | 0,61 | 12 | −8,33 | ||||
| 2025-08-05 | 13F | Huntington National Bank | 0 | |||||||
| 2025-07-11 | 13F | Mallini Complete Financial Planning LLC | 38 562 | 9,98 | 574 | 5,32 | ||||
| 2025-07-21 | 13F | Future Financial Wealth Managment LLC | 4 000 | 0,00 | 60 | −4,84 | ||||
| 2025-08-11 | 13F | HighTower Advisors, LLC | 28 930 | −5,09 | 431 | −9,28 | ||||
| 2025-08-14 | 13F | Cohen & Steers, Inc. | 346 789 | −10,34 | 5 | −16,67 | ||||
| 2025-07-30 | 13F | Brookstone Capital Management | 56 269 | −13,34 | 838 | −17,13 | ||||
| 2025-04-14 | 13F | Strategic Wealth Designers | 0 | −100,00 | 0 | −100,00 | ||||
| 2025-07-17 | 13F | Presper Financial Architects, LLC | 50 550 | 1 | ||||||
| 2025-07-14 | 13F | Buska Wealth Management, LLC | 32 589 | 4,80 | 485 | 0,21 | ||||
| 2025-08-08 | 13F | Creative Planning | 10 064 | −54,70 | 150 | −56,81 | ||||
| 2025-08-19 | 13F | Advisory Services Network, LLC | 0 | −100,00 | 0 | |||||
| 2025-08-14 | 13F | Comerica Bank | 30 596 | 75,97 | 456 | 68,52 | ||||
| 2025-08-14 | 13F | Wells Fargo & Company/mn | 9 196 | 63,28 | 137 | 56,32 | ||||
| 2025-08-01 | 13F | Motco | 0 | −100,00 | 0 | |||||
| 2025-07-11 | 13F | Kapstone Financial Advisors LLC | 11 070 | 165 | ||||||
| 2025-08-13 | 13F | EverSource Wealth Advisors, LLC | 2 461 | 0,00 | 37 | −5,26 | ||||
| 2025-07-02 | 13F | Capital Market Strategies LLC | 31 000 | −12,11 | 462 | −16,03 | ||||
| 2025-08-05 | 13F | Sigma Planning Corp | 76 789 | 0,32 | 1 143 | −4,03 | ||||
| 2025-07-31 | 13F | Oppenheimer & Co Inc | 50 711 | 1,49 | 755 | −2,83 | ||||
| 2025-08-14 | 13F | Mercer Global Advisors Inc /adv | 71 424 | −4,19 | 1 064 | −8,36 | ||||
| 2025-08-05 | 13F | Uniting Wealth Partners, LLC | 10 000 | 0,00 | 149 | −4,52 | ||||
| 2025-08-14 | 13F | Stifel Financial Corp | 47 339 | 6,61 | 705 | 1,88 | ||||
| 2025-07-22 | 13F | Iron Horse Wealth Management, LLC | 2 006 | 30 | ||||||
| 2025-07-25 | 13F | Hazlett, Burt & Watson, Inc. | 1 355 | 6,27 | 0 | |||||
| 2025-07-17 | 13F | Janney Montgomery Scott LLC | 283 722 | 7,70 | 4 | 0,00 | ||||
| 2025-07-17 | 13F | Wagner Wealth Management, Llc | 19 403 | 0,00 | 289 | −4,64 | ||||
| 2025-08-06 | 13F | Vantage Financial Partners, LLC | 13 445 | −16,09 | 200 | −19,68 | ||||
| 2025-08-11 | 13F | Advisor Resource Council | 0 | −100,00 | 0 | |||||
| 2025-07-25 | 13F | Concord Wealth Partners | 271 | 0,00 | 4 | 0,00 | ||||
| 2025-08-19 | 13F | National Asset Management, Inc. | 30 379 | −33,05 | 452 | −34,68 | ||||
| 2025-08-12 | 13F | Country Trust Bank | 4 000 | 60 | ||||||
| 2025-07-28 | 13F | Mutual Advisors, LLC | 92 537 | −4,88 | 1 392 | −0,78 | ||||
| 2025-08-08 | 13F | Kingsview Wealth Management, LLC | 11 030 | 164 | ||||||
| 2025-08-14 | 13F | Banque Transatlantique SA | 0 | −100,00 | 0 | |||||
| 2025-07-29 | 13F | Stratos Wealth Partners, LTD. | 42 331 | 2,89 | 630 | −1,56 | ||||
| 2025-07-07 | 13F | Nova Wealth Management, Inc. | 2 940 | 0,00 | 44 | −4,44 | ||||
| 2025-08-13 | 13F | Northwestern Mutual Wealth Management Co | 3 144 | −70,57 | 47 | −72,29 | ||||
| 2025-08-14 | 13F | Mpwm Advisory Solutions, Llc | 7 000 | 0,00 | 104 | −3,70 | ||||
| 2025-08-14 | 13F | Great Valley Advisor Group, Inc. | 149 327 | 14,19 | 2 223 | 9,18 | ||||
| 2025-09-04 | 13F/A | Advisor Group Holdings, Inc. | 770 890 | 3,07 | 11 479 | −1,43 | ||||
| 2025-07-22 | 13F | Coastal Investment Advisors, Inc. | 20 383 | 5,16 | 304 | 0,66 | ||||
| 2025-07-29 | 13F | International Assets Investment Management, Llc | 15 941 | 3,43 | 237 | −0,84 | ||||
| 2025-08-14 | 13F | CoreCap Advisors, LLC | 47 641 | 1,85 | 709 | −2,61 | ||||
| 2025-07-23 | 13F | Prime Capital Investment Advisors, LLC | 424 839 | −41,59 | 6 326 | −44,14 | ||||
| 2025-08-07 | 13F | Kestra Private Wealth Services, Llc | 17 597 | 262 | ||||||
| 2025-07-21 | 13F | Ameritas Advisory Services, LLC | 10 546 | 0,00 | 157 | −1,87 | ||||
| 2025-07-30 | 13F | Financial Perspectives, Inc | 35 | 0,00 | 1 | |||||
| 2025-08-05 | 13F | GPS Wealth Strategies Group, LLC | 31 504 | 0,00 | 469 | −4,29 | ||||
| 2025-08-14 | 13F/A | Rockefeller Capital Management L.P. | 30 008 | 1,19 | 447 | −3,25 | ||||
| 2025-08-14 | 13F | Harwood Advisory Group, LLC | 750 | 0,00 | 11 | 0,00 | ||||
| 2025-08-11 | 13F | Core Wealth Partners LLC | 10 979 | 0,00 | 163 | −4,12 | ||||
| 2025-08-19 | 13F | Newbridge Financial Services Group, Inc. | 325 | 5 | ||||||
| 2025-08-11 | 13F | Principal Securities, Inc. | 145 460 | 9,56 | 2 166 | 6,91 | ||||
| 2025-05-15 | 13F | Citadel Advisors Llc | 0 | −100,00 | 0 | |||||
| 2025-07-30 | NP | HYIN - WisdomTree Alternative Income Fund N/A | 113 087 | 7,51 | 1 666 | 0,73 | ||||
| 2025-07-22 | 13F | DAVENPORT & Co LLC | 34 008 | 22,98 | 506 | 17,67 | ||||
| 2025-07-11 | 13F/A | Umb Bank N A/mo | 70 038 | 1,33 | 1 043 | −3,16 | ||||
| 2025-08-11 | 13F | Citigroup Inc | 1 | 0,00 | 0 | |||||
| 2025-08-15 | 13F | Captrust Financial Advisors | 49 945 | −45,75 | 744 | −48,15 | ||||
| 2025-07-24 | 13F | Eastern Bank | 4 073 | 0,00 | 61 | −4,76 | ||||
| 2025-08-14 | 13F | Garden State Investment Advisory Services LLC | 56 531 | −1,78 | 842 | −6,14 | ||||
| 2025-07-23 | 13F | Kingswood Wealth Advisors, Llc | 0 | −100,00 | 0 | |||||
| 2025-05-12 | 13F | Fmr Llc | 0 | −100,00 | 0 | |||||
| 2025-05-15 | 13F | Tower Research Capital LLC (TRC) | 0 | −100,00 | 0 | |||||
| 2025-08-05 | 13F | Strategic Financial Concepts, LLC | 52 357 | −6,78 | 780 | −10,87 | ||||
| 2025-08-14 | 13F | Atomi Financial Group, Inc. | 27 591 | 0,00 | 411 | −4,43 | ||||
| 2025-08-08 | 13F | Richmond Brothers, Inc. | 238 400 | 3,56 | 3 550 | −0,98 | ||||
| 2025-08-11 | 13F | Anfield Capital Management, LLC | 3 654 | 0,00 | 54 | −3,57 | ||||
| 2025-05-15 | 13F/A | Orion Portfolio Solutions, LLC | 13 101 | 204 | ||||||
| 2025-08-05 | 13F | Flynn Zito Capital Management, Llc | 92 647 | 108,18 | 1 380 | 99,28 | ||||
| 2025-07-11 | 13F | Kingstone Capital Partners Texas, LLC | 17 953 239 | 288 | ||||||
| 2025-05-14 | 13F | Oarsman Capital, Inc. | 0 | −100,00 | 0 | |||||
| 2025-08-14 | 13F | Bank Of America Corp /de/ | 551 009 | 4,03 | 8 205 | −0,51 | ||||
| 2025-07-29 | 13F | Altus Wealth Group LLC | 10 092 | −2,63 | 150 | −6,83 | ||||
| 2025-08-11 | 13F | NewEdge Wealth, LLC | 0 | −100,00 | 0 | |||||
| 2025-07-14 | 13F | U.S. Capital Wealth Advisors, LLC | 19 323 | 7,99 | 288 | 3,24 | ||||
| 2025-07-22 | 13F | Merit Financial Group, LLC | 26 125 | 1,86 | 389 | −2,51 | ||||
| 2025-08-14 | 13F | Wiley Bros.-aintree Capital, Llc | 10 979 | 0,00 | 163 | −4,12 | ||||
| 2025-08-04 | 13F | Spire Wealth Management | 9 708 | 0,00 | 145 | −4,64 | ||||
| 2025-05-15 | 13F | Gwn Securities Inc. | 0 | −100,00 | 0 | |||||
| 2025-08-04 | 13F | IFG Advisory, LLC | 89 696 | 327,63 | 1 336 | 309,51 | ||||
| 2025-07-11 | 13F | Quad-Cities Investment Group, LLC | 16 982 | 8,48 | 253 | 3,70 | ||||
| 2025-08-08 | 13F | Pnc Financial Services Group, Inc. | 141 449 | 7,19 | 2 106 | 2,53 | ||||
| 2025-07-31 | 13F | Moloney Securities Asset Management, LLC | 17 825 | 24,95 | 265 | 19,37 | ||||
| 2025-08-14 | 13F | GWM Advisors LLC | 107 752 | 2,43 | 1 604 | −2,02 | ||||
| 2025-05-15 | 13F | Hrt Financial Lp | 0 | −100,00 | 0 | |||||
| 2025-07-22 | 13F | Marks Group Wealth Management, Inc | 196 262 | 0,00 | 2 922 | −4,35 | ||||
| 2025-07-25 | 13F | Atria Wealth Solutions, Inc. | 60 747 | −76,42 | 905 | −77,47 | ||||
| 2025-08-14 | 13F | Raymond James Financial Inc | 958 371 | −17,71 | 14 270 | −21,30 | ||||
| 2025-07-29 | 13F | Disciplined Investments, LLC | 24 641 | −21,77 | 367 | −25,31 | ||||
| 2025-07-22 | 13F | Beacon Financial Advisory LLC | 10 296 | 153 | ||||||
| 2025-08-12 | 13F | Marshall & Sterling Wealth Advisors Inc. | 26 | 0,00 | 0 | |||||
| 2025-08-14 | 13F | Sunbelt Securities, Inc. | 7 851 | 3,99 | 120 | 1,71 | ||||
| 2025-08-12 | 13F | CIBC Private Wealth Group, LLC | 3 826 | −20,70 | 57 | −16,42 | ||||
| 2025-07-25 | 13F | Apollon Wealth Management, LLC | 23 214 | 56,32 | 346 | 49,35 | ||||
| 2025-08-12 | 13F | Steward Partners Investment Advisory, Llc | 129 941 | 6,94 | 1 935 | 2,27 | ||||
| 2025-08-01 | 13F | Petra Financial Advisors Inc | 445 056 | 108,65 | 6 627 | 99,52 | ||||
| 2025-08-12 | 13F | BlackRock, Inc. | 43 314 | 58,51 | 645 | 51,53 | ||||
| 2025-08-14 | 13F | Royal Bank Of Canada | 659 129 | 6,58 | 9 814 | 1,92 | ||||
| 2025-08-15 | 13F | Morgan Stanley | 7 297 290 | 6,33 | 108 657 | 1,69 | ||||
| 2025-08-13 | 13F | Capital Analysts, Inc. | 20 710 | 2,55 | 0 | |||||
| 2025-08-12 | 13F | Change Path, LLC | 740 653 | 8,49 | 11 028 | 3,75 | ||||
| 2025-07-24 | 13F | JB Capital LLC | 24 819 | 0,47 | 370 | −3,91 | ||||
| 2025-07-09 | 13F | David J Yvars Group | 22 463 | 0,90 | 334 | −3,47 | ||||
| 2025-08-06 | 13F | Moors & Cabot, Inc. | 12 055 | 0,00 | 179 | −4,28 | ||||
| 2025-08-11 | 13F | Aptus Capital Advisors, LLC | 11 374 | 0,31 | 169 | −3,98 | ||||
| 2025-08-06 | 13F | Commonwealth Equity Services, Llc | 300 610 | −55,21 | 4 | −60,00 |