Grunnleggende statistikk
| Institusjonelle eiere | 154 total, 154 long only, 0 short only, 0 long/short - change of −0,65% MRQ |
| Gjennomsnittlig porteføljeallokering | 0.1487 % - change of −0,48% MRQ |
| Institusjonelle aksjer (Long) | 27 782 993 (ex 13D/G) - change of 0,93MM shares 3,47% MRQ |
| Institusjonell verdi (Long) | $ 943 601 USD ($1000) |
Institusjonelt eierskap og aksjonærer
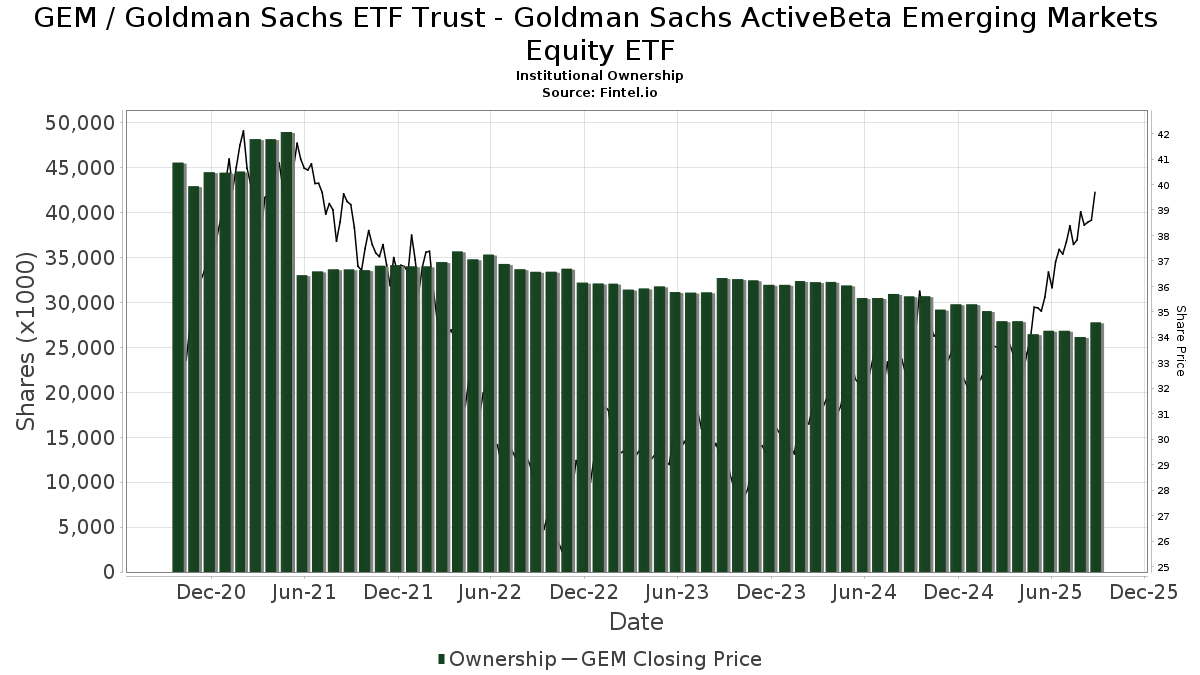
Goldman Sachs ETF Trust - Goldman Sachs ActiveBeta Emerging Markets Equity ETF (US:GEM) har 154 institusjonelle eiere og aksjonærer som har sendt inn 13D/G- eller 13F-skjemaer til Securities Exchange Commission (SEC). Disse institusjonene eier til sammen 27,782,993 aksjer. De største aksjonærene inkluderer Wells Fargo & Company/mn, SigFig Wealth Management, LLC, Goldman Sachs Group Inc, Betterment LLC, LPL Financial LLC, GGMBX - Goldman Sachs Global Managed Beta Fund Institutional Shares, Arvest Bank Trust Division, HB Wealth Management, LLC, State Of Wisconsin Investment Board, and Envestnet Asset Management Inc .
Goldman Sachs ETF Trust - Goldman Sachs ActiveBeta Emerging Markets Equity ETF (ARCA:GEM) institusjonell eierstruktur viser nåværende posisjoner i selskapet fordelt på institusjoner og fond, samt de siste endringene i posisjonsstørrelse. De største aksjonærene kan være individuelle investorer, verdipapirfond, hedgefond eller institusjoner. Schedule 13D indikerer at investoren eier (eller har eid) mer enn 5 % av selskapet og har til hensikt (eller hadde til hensikt) å aktivt forfølge en endring i forretningsstrategien. Schedule 13G indikerer en passiv investering på over 5 %.
The share price as of September 11, 2025 is 40,24 / share. Previously, on September 12, 2024, the share price was 32,64 / share. This represents an increase of 23,28% over that period.
Fondssentiment-score
Fondssentiment Score (også kjent som akkumulering av eierskap poengsum) viser hvilke aksjer som er mest kjøpt av fond. Den er resultatet av en sofistikert, kvantitativ flerfaktormodell som identifiserer selskaper med de høyeste nivåene av institusjonell akkumulering. Beregningsmodellen for poeng bruker en kombinasjon av den totale økningen i antall offentliggjorte eiere, endringer i porteføljeallokeringen til disse eierne og andre beregninger. Tallet går fra 0 til 100, der høyere tall indikerer en høyere grad av akkumulering i forhold til sammenlignbare selskaper, der 50 er gjennomsnittet.
Oppdateringsfrekvens: Daglig
Sjekk ut Ownership Explorer, som inneholder en liste over de høyest rangerte selskapene.
Institusjonell Put/Call-forhold
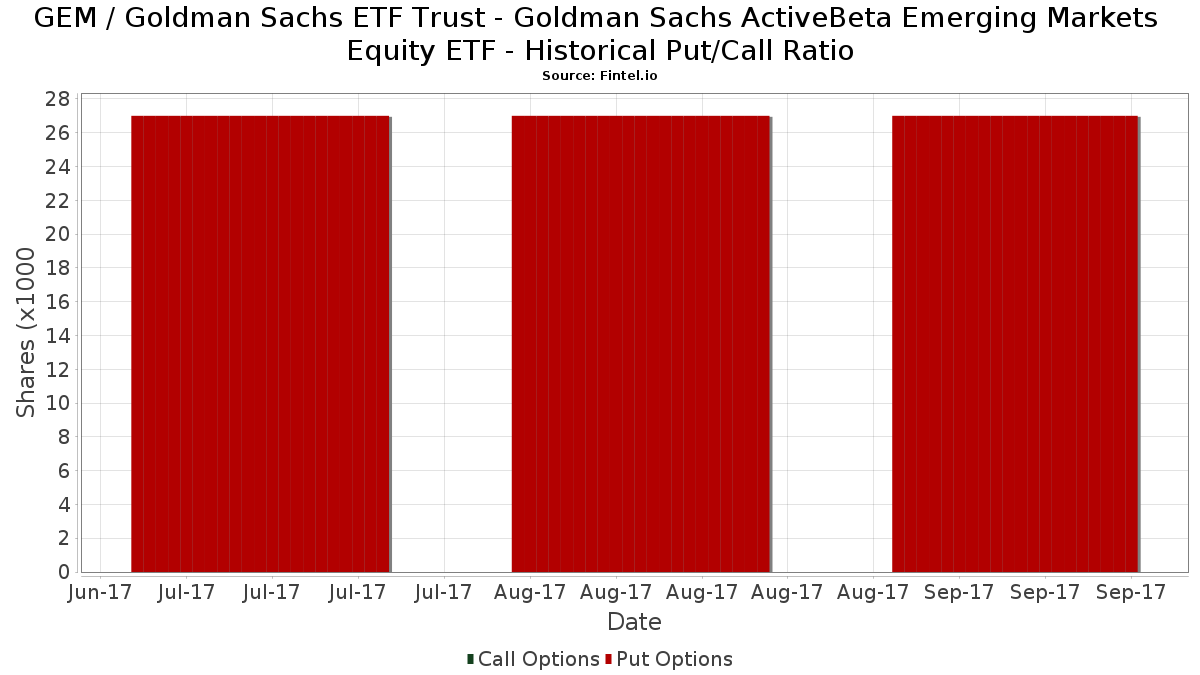
I tillegg til å rapportere standard aksje- og gjeldsemisjoner må institusjoner med mer enn 100 millioner kroner i forvaltningskapital også oppgi beholdningen av put- og callopsjoner. Siden put-opsjoner generelt indikerer et negativt sentiment, og call-opsjoner indikerer et positivt sentiment, kan vi få et inntrykk av det generelle institusjonelle sentimentet ved å plotte forholdet mellom put- og call-opsjoner. Diagrammet til høyre viser det historiske forholdet mellom put- og call-opsjoner for dette instrumentet.
Ved å bruke Put/Call-forholdet som en indikator på investorsentimentet kan man overvinne en av de viktigste svakhetene ved å bruke totalt institusjonelt eierskap, nemlig at en betydelig andel av forvaltningskapitalen investeres passivt for å følge indekser. Passivt forvaltede fond kjøper vanligvis ikke opsjoner, slik at indikatoren for put/call-forhold i større grad gjenspeiler stemningen i aktivt forvaltede fond.
13F- og NPORT-arkiveringer
Detaljer om 13F-arkiveringer er gratis. Detaljer om NP-arkiveringer krever et premium-medlemskap. Grønne rader indikerer nye posisjoner. Røde rader indikerer lukkede posisjoner. Klikk på lenke ikonet for å se hele transaksjonshistorikken.
Oppgrader
for å låse opp premiedata og eksportere til Excel. ![]() .
.
| Fildato | Kilde | Investor | Type | Gjennomsnittlig pris (estimert) |
Aksjer | Δ Aksjer (%) |
Rapportert verdi ($1000) | Verdi (%) | Portallokering (%) | |
|---|---|---|---|---|---|---|---|---|---|---|
| 2025-07-28 | 13F | Kiker Wealth Management, LLC | 337 | −27,06 | 13 | −20,00 | ||||
| 2025-08-14 | 13F | Integrated Wealth Concepts LLC | 14 250 | 6,18 | 530 | 19,10 | ||||
| 2025-05-16 | 13F | Coppell Advisory Solutions LLC | 0 | −100,00 | 0 | |||||
| 2025-07-22 | 13F | HFM Investment Advisors, LLC | 189 | 5,59 | 7 | 40,00 | ||||
| 2025-07-07 | 13F | Nova Wealth Management, Inc. | 19 | −92,31 | 1 | −100,00 | ||||
| 2025-08-13 | 13F | Baird Financial Group, Inc. | 40 263 | −1,00 | 1 498 | 11,05 | ||||
| 2025-07-17 | 13F | HB Wealth Management, LLC | 1 124 949 | −36,81 | 41 859 | −29,13 | ||||
| 2025-08-19 | 13F | Anchor Investment Management, LLC | 116 302 | 6,42 | 4 328 | 19,33 | ||||
| 2025-08-14 | 13F | Citadel Advisors Llc | 289 967 | 3 903,41 | 10 790 | 4 395,42 | ||||
| 2025-08-05 | 13F | Key FInancial Inc | 41 | 0,00 | 2 | 0,00 | ||||
| 2025-08-14 | 13F | State Of Wisconsin Investment Board | 1 091 863 | 0,00 | 40 628 | 12,15 | ||||
| 2025-08-12 | 13F | Proequities, Inc. | 0 | 0 | ||||||
| 2025-04-21 | 13F | ORG Partners LLC | 0 | −100,00 | 0 | |||||
| 2025-08-13 | 13F | Maia Wealth LLC | 11 913 | −2,55 | 443 | 13,01 | ||||
| 2025-07-28 | 13F | Elmwood Wealth Management, Inc. | 25 220 | −0,05 | 938 | 12,07 | ||||
| 2025-08-06 | 13F | Golden State Wealth Management, LLC | 34 402 | −8,61 | 1 280 | 2,48 | ||||
| 2025-08-11 | 13F | Wealthspire Advisors, LLC | 8 796 | −23,21 | 327 | −13,95 | ||||
| 2025-08-08 | 13F | Hartland & Co., LLC | 0 | −100,00 | 0 | |||||
| 2025-08-05 | 13F | Bank of New York Mellon Corp | 25 442 | 3,83 | 947 | 16,36 | ||||
| 2025-07-31 | 13F | Cambridge Investment Research Advisors, Inc. | 9 714 | −2,05 | 0 | |||||
| 2025-08-11 | 13F | Principal Securities, Inc. | 318 162 | 33,42 | 11 839 | 55,54 | ||||
| 2025-07-30 | 13F | Whittier Trust Co Of Nevada Inc | 16 910 | −4,69 | 629 | 6,97 | ||||
| 2025-08-04 | 13F | Spinnaker Trust | 204 634 | −4,97 | 7 614 | 6,58 | ||||
| 2025-08-12 | 13F | AlphaCore Capital LLC | 109 617 | 638,01 | 4 079 | 728,86 | ||||
| 2025-08-14 | 13F | Royal Bank Of Canada | 359 226 | 28,25 | 13 366 | 43,83 | ||||
| 2025-08-14 | 13F | Betterment LLC | 2 098 854 | 19,20 | 78 | 34,48 | ||||
| 2025-08-14 | 13F | Bank Of America Corp /de/ | 483 005 | 0,20 | 17 973 | 12,37 | ||||
| 2025-08-13 | 13F | Continuum Advisory, LLC | 0 | −100,00 | 0 | |||||
| 2025-08-14 | 13F | First Foundation Advisors | 330 790 | 2,55 | 12 309 | 15,00 | ||||
| 2025-07-30 | 13F | Whittier Trust Co | 13 527 | −29,87 | 503 | −21,28 | ||||
| 2025-08-06 | 13F | AE Wealth Management LLC | 141 | 69,88 | 5 | 150,00 | ||||
| 2025-07-30 | 13F | Cullen/frost Bankers, Inc. | 557 | 0,00 | 21 | 11,11 | ||||
| 2025-08-14 | 13F | Glenview Trust Co | 8 897 | −1,36 | 331 | 10,70 | ||||
| 2025-08-13 | 13F | Cheviot Value Management, LLC | 65 | 0,00 | 2 | 0,00 | ||||
| 2025-08-14 | 13F | Qube Research & Technologies Ltd | 1 377 | −62,39 | 51 | −57,85 | ||||
| 2025-07-09 | 13F | Pallas Capital Advisors LLC | 0 | −100,00 | 0 | |||||
| 2025-07-25 | 13F | Prostatis Group LLC | 32 539 | 104,63 | 1 211 | 129,60 | ||||
| 2025-08-14 | 13F | Ameriprise Financial Inc | 0 | −100,00 | 0 | |||||
| 2025-08-19 | 13F | Advisory Services Network, LLC | 6 208 | 1,31 | 232 | 14,29 | ||||
| 2025-05-15 | 13F | Stonehaven Wealth & Tax Solutions, Llc | 0 | −100,00 | 0 | |||||
| 2025-08-14 | 13F | Goldman Sachs Group Inc | 2 941 097 | 7,81 | 109 438 | 20,91 | ||||
| 2025-07-18 | 13F | Truist Financial Corp | 23 996 | 8,69 | 893 | 21,86 | ||||
| 2025-08-11 | 13F | Hexagon Capital Partners LLC | 0 | −100,00 | 0 | |||||
| 2025-08-12 | 13F | Clearwater Capital Advisors, LLC | 9 380 | −92,68 | 349 | −91,80 | ||||
| 2025-07-21 | 13F | Quent Capital, LLC | 0 | −100,00 | 0 | |||||
| 2025-08-11 | 13F | Citigroup Inc | 18 096 | 2,68 | 673 | 15,24 | ||||
| 2025-04-09 | 13F | Signature Securities Group Corporation | 0 | −100,00 | 0 | −100,00 | ||||
| 2025-07-11 | 13F/A | Umb Bank N A/mo | 27 | −90,53 | 1 | −88,89 | ||||
| 2025-07-25 | 13F | Envestnet Portfolio Solutions, Inc. | 129 989 | −0,96 | 4 837 | 11,04 | ||||
| 2025-08-14 | 13F | Susquehanna International Group, Llp | 41 614 | −28,87 | 1 548 | −20,25 | ||||
| 2025-07-30 | 13F | D.a. Davidson & Co. | 7 530 | 0,00 | 280 | 12,45 | ||||
| 2025-08-14 | 13F | LifePlan Investment Advisors, Inc. | 21 652 | 39,04 | 806 | 56,01 | ||||
| 2025-08-14 | 13F | Comerica Bank | 10 386 | −13,02 | 386 | −2,53 | ||||
| 2025-07-29 | 13F | Harbor Asset Planning, Inc. | 327 | 12 | ||||||
| 2025-08-14 | 13F | 10Elms LLP | 1 | 0,00 | 0 | |||||
| 2025-08-07 | 13F | CENTRAL TRUST Co | 104 317 | 4,10 | 3 882 | 16,76 | ||||
| 2025-07-17 | 13F | CogentBlue Wealth Advisors, LLC | 7 457 | −2,85 | 277 | 9,06 | ||||
| 2025-07-24 | 13F | Mengis Capital Management, Inc. | 5 935 | 221 | ||||||
| 2025-08-14 | 13F | Fmr Llc | 1 795 | −14,40 | 67 | −4,35 | ||||
| 2025-08-01 | 13F | Strategic Financial Services, Inc, | 245 844 | 13,79 | 9 148 | 27,61 | ||||
| 2025-08-19 | NP | GAPIX - Goldman Sachs Dynamic Global Equity Fund Institutional | 85 902 | 14,84 | 3 196 | 28,82 | ||||
| 2025-08-06 | 13F | Mark Sheptoff Financial Planning, Llc | 29 | 0,00 | 1 | |||||
| 2025-08-19 | NP | GOIIX - Goldman Sachs Growth and Income Strategy Portfolio Institutional | 130 954 | 0,00 | 4 873 | 12,13 | ||||
| 2025-04-29 | 13F | Callan Capital, LLC | 99 619 | −1,11 | 3 305 | 2,80 | ||||
| 2025-08-01 | 13F | Bank of Jackson Hole Trust | 0 | −100,00 | 0 | |||||
| 2025-07-07 | 13F | Investors Research Corp | 523 | 0,00 | 19 | 11,76 | ||||
| 2025-08-15 | 13F | Equitable Holdings, Inc. | 0 | −100,00 | 0 | |||||
| 2025-08-12 | 13F | Jpmorgan Chase & Co | 11 495 | 989,57 | 428 | 1 120,00 | ||||
| 2025-07-08 | 13F | Parallel Advisors, LLC | 74 | −25,25 | 3 | −33,33 | ||||
| 2025-08-14 | 13F | Raymond James Financial Inc | 392 021 | 1,29 | 14 587 | 13,60 | ||||
| 2025-08-04 | 13F | Assetmark, Inc | 11 | 0 | ||||||
| 2025-09-04 | 13F/A | Advisor Group Holdings, Inc. | 28 852 | 13,35 | 1 073 | 27,13 | ||||
| 2025-04-21 | 13F | Nelson, Van Denburg & Campbell Wealth Management Group, LLC | 0 | −100,00 | 0 | |||||
| 2025-08-27 | 13F/A | Brinker Capital Investments, LLC | 11 109 | 4,68 | 413 | 17,33 | ||||
| 2025-08-08 | 13F | Pnc Financial Services Group, Inc. | 359 | 0,00 | 13 | 18,18 | ||||
| 2025-08-05 | 13F | GPS Wealth Strategies Group, LLC | 349 | 12,94 | 13 | 20,00 | ||||
| 2025-08-13 | 13F | GeoWealth Management, LLC | 62 562 | −4,39 | 2 328 | 7,23 | ||||
| 2025-08-07 | 13F | Vise Technologies, Inc. | 0 | −100,00 | 0 | |||||
| 2025-08-04 | 13F | Creative Financial Designs Inc /adv | 331 | 0,00 | 12 | 20,00 | ||||
| 2025-08-12 | 13F | O'shaughnessy Asset Management, Llc | 405 | −29,07 | 15 | −16,67 | ||||
| 2025-07-03 | 13F | Arvest Investments, Inc. | 446 226 | −2,49 | 16 604 | 9,35 | ||||
| 2025-08-19 | 13F | Asset Dedication, LLC | 47 | 2 | ||||||
| 2025-07-07 | 13F | Thurston, Springer, Miller, Herd & Titak, Inc. | 111 | 4 | ||||||
| 2025-07-28 | 13F | Morris Financial Concepts, Inc. | 11 485 | −0,57 | 427 | 11,49 | ||||
| 2025-08-11 | 13F | Shufro Rose & Co Llc | 42 591 | −0,71 | 1 413 | −0,70 | ||||
| 2025-04-14 | 13F | Greenspring Advisors, LLC | 6 641 | 0,00 | 220 | 4,27 | ||||
| 2025-08-13 | 13F | Jones Financial Companies Lllp | 2 293 | −39,48 | 85 | −32,54 | ||||
| 2025-07-21 | 13F | Monticello Wealth Management, Llc | 78 368 | −4,43 | 2 916 | 7,21 | ||||
| 2025-08-14 | 13F | EP Wealth Advisors, Inc. | 22 118 | −0,01 | 823 | 12,28 | ||||
| 2025-08-14 | 13F | Jane Street Group, Llc | 131 318 | 932,62 | 4 886 | 1 060,57 | ||||
| 2025-07-28 | 13F | Naviter Wealth, LLC | 5 813 | 216 | ||||||
| 2025-08-14 | 13F | GWM Advisors LLC | 22 129 | 11,89 | 823 | 25,46 | ||||
| 2025-08-13 | 13F | StoneX Group Inc. | 0 | −100,00 | 0 | −100,00 | ||||
| 2025-08-13 | 13F | Flow Traders U.s. Llc | 26 289 | 1 | ||||||
| 2025-08-11 | 13F | Aptus Capital Advisors, LLC | 683 | 0,00 | 25 | 13,64 | ||||
| 2025-08-12 | 13F | Steward Partners Investment Advisory, Llc | 1 560 | 171,30 | 58 | 205,26 | ||||
| 2025-07-17 | 13F | Archford Capital Strategies, LLC | 8 849 | −1,52 | 329 | 10,40 | ||||
| 2025-08-13 | 13F | EverSource Wealth Advisors, LLC | 416 | 0,00 | 15 | 15,38 | ||||
| 2025-08-11 | 13F | Heritage Wealth Advisors | 200 | 0,00 | 7 | 16,67 | ||||
| 2025-08-14 | 13F | Wiley Bros.-aintree Capital, Llc | 32 018 | −0,44 | 1 188 | 11,04 | ||||
| 2025-08-14 | 13F | Mariner, LLC | 53 758 | 0,08 | 2 000 | 12,23 | ||||
| 2025-07-16 | 13F | Signaturefd, Llc | 40 | 1 | ||||||
| 2025-07-18 | 13F | Consolidated Portfolio Review Corp | 8 101 | 301 | ||||||
| 2025-08-15 | 13F | Morgan Stanley | 706 273 | −2,10 | 26 280 | 9,80 | ||||
| 2025-07-24 | 13F | Capital Advisors, Ltd. LLC | 2 302 | −8,61 | 0 | |||||
| 2025-08-06 | 13F | Rialto Wealth Management, LLC | 439 | 0,00 | 16 | 14,29 | ||||
| 2025-07-30 | 13F | Syntegra Private Wealth Group, LLC | 16 350 | 90,14 | 608 | 113,33 | ||||
| 2025-07-14 | 13F | Golden State Equity Partners | 29 712 | −13,21 | 1 106 | −2,73 | ||||
| 2025-08-08 | 13F | Strategies Wealth Advisors, LLC | 11 997 | 0,00 | 446 | 12,06 | ||||
| 2025-08-08 | 13F | Altfest L J & Co Inc | 12 693 | −38,69 | 472 | −31,20 | ||||
| 2025-08-13 | 13F | Marshall Wace, Llp | 147 817 | 722,39 | 5 500 | 822,82 | ||||
| 2025-05-13 | 13F | Bokf, Na | 0 | −100,00 | 0 | |||||
| 2025-07-24 | 13F | Us Bancorp \de\ | 454 | 123,65 | 17 | 166,67 | ||||
| 2025-07-31 | 13F | Buckingham Strategic Partners | 10 197 | 15,91 | 379 | 30,24 | ||||
| 2025-07-14 | 13F | U.S. Capital Wealth Advisors, LLC | 5 973 | −1,86 | 222 | 10,45 | ||||
| 2025-08-12 | 13F | MAI Capital Management | 700 | 0,00 | 26 | 13,04 | ||||
| 2025-08-14 | 13F | Strategic Wealth Designers | 0 | 0 | ||||||
| 2025-07-21 | NP | GGMBX - Goldman Sachs Global Managed Beta Fund Institutional Shares | 1 537 577 | 16,39 | 53 508 | 24,17 | ||||
| 2025-07-29 | 13F | Kelman-Lazarov, Inc. | 15 178 | −65,11 | 565 | −60,91 | ||||
| 2025-08-11 | 13F | HighTower Advisors, LLC | 9 205 | 0,00 | 343 | 12,13 | ||||
| 2025-08-05 | 13F | Bank Of Montreal /can/ | 992 | 37 | ||||||
| 2025-08-12 | 13F | Gladstone Institutional Advisory LLC | 104 923 | 0,87 | 3 904 | 13,13 | ||||
| 2025-08-13 | 13F | Northwestern Mutual Wealth Management Co | 388 | 11,49 | 14 | 27,27 | ||||
| 2025-08-06 | 13F | Commonwealth Equity Services, Llc | 157 937 | −0,34 | 6 | 0,00 | ||||
| 2025-07-24 | 13F | GFG Capital, LLC | 151 428 | −4,95 | 5 635 | 6,58 | ||||
| 2025-07-14 | 13F | AdvisorNet Financial, Inc | 143 | 0,00 | 5 | 25,00 | ||||
| 2025-07-16 | 13F | RWM Asset Management, LLC | 163 880 | 3,31 | 6 098 | 15,85 | ||||
| 2025-07-16 | 13F | Kathmere Capital Management, LLC | 6 433 | −0,60 | 239 | 11,68 | ||||
| 2025-08-13 | 13F | Congress Wealth Management LLC / DE / | 0 | −100,00 | 0 | |||||
| 2025-08-13 | 13F | Haverford Trust Co | 11 576 | 0,00 | 431 | 11,98 | ||||
| 2025-07-09 | 13F | Breakwater Investment Management | 75 | 0,00 | 3 | 0,00 | ||||
| 2025-08-14 | 13F | Smartleaf Asset Management LLC | 2 | −98,17 | 0 | −100,00 | ||||
| 2025-07-08 | 13F | Atwood & Palmer Inc | 47 310 | −1,57 | 1 760 | 10,41 | ||||
| 2025-08-13 | 13F | IAG Wealth Partners, LLC | 17 127 | 72,86 | 637 | 94,21 | ||||
| 2025-08-14 | 13F | Wells Fargo & Company/mn | 3 522 921 | 7,48 | 131 088 | 20,53 | ||||
| 2025-05-15 | 13F | Tower Research Capital LLC (TRC) | 0 | −100,00 | 0 | |||||
| 2025-07-28 | 13F | Harbour Investments, Inc. | 822 | −9,77 | 31 | 0,00 | ||||
| 2025-08-08 | 13F | Cetera Investment Advisers | 350 522 | 1,35 | 13 043 | 13,66 | ||||
| 2025-07-10 | 13F | Wealth Enhancement Advisory Services, Llc | 65 136 | −36,46 | 2 448 | −28,05 | ||||
| 2025-08-14 | 13F | CoreCap Advisors, LLC | 132 106 | 2,52 | 4 916 | 14,97 | ||||
| 2025-05-07 | 13F | WMS Partners, LLC | 0 | −100,00 | 0 | |||||
| 2025-07-16 | 13F | American National Bank | 126 967 | −5,30 | 4 724 | 6,21 | ||||
| 2025-08-14 | 13F | Old Mission Capital Llc | 49 008 | 1 824 | ||||||
| 2025-07-08 | 13F | Apella Capital, LLC | 338 287 | −15,74 | 12 530 | −0,79 | ||||
| 2025-08-12 | 13F | LPL Financial LLC | 1 918 529 | 5,94 | 71 388 | 18,81 | ||||
| 2025-08-19 | NP | GGSIX - Goldman Sachs Growth Strategy Portfolio Institutional | 197 259 | 0,00 | 7 340 | 12,15 | ||||
| 2025-05-15 | 13F | Chilton Investment Co Llc | 0 | −100,00 | 0 | |||||
| 2025-07-24 | 13F | Edge Financial Advisors LLC | 20 015 | −10,51 | 745 | 0,27 | ||||
| 2025-08-13 | 13F | Brown Advisory Inc | 0 | −100,00 | 0 | |||||
| 2025-08-14 | 13F | UBS Group AG | 258 100 | 4,17 | 9 604 | 16,81 | ||||
| 2025-07-25 | 13F | Cwm, Llc | 186 | −49,87 | 0 | |||||
| 2025-05-09 | 13F | NewEdge Wealth, LLC | 0 | −100,00 | 0 | |||||
| 2025-08-18 | 13F | Geneos Wealth Management Inc. | 290 | 11 | ||||||
| 2025-08-07 | 13F | Allworth Financial LP | 974 | 0,00 | 36 | 12,50 | ||||
| 2025-08-13 | 13F | SageView Advisory Group, LLC | 15 596 | −1,52 | 589 | 12,19 | ||||
| 2025-07-17 | 13F | Independence Bank of Kentucky | 850 | 32 | ||||||
| 2025-08-12 | 13F | Inscription Capital, LLC | 0 | −100,00 | 0 | |||||
| 2025-08-19 | NP | GIPIX - Goldman Sachs Balanced Strategy Portfolio Institutional | 49 119 | 0,00 | 1 828 | 12,15 | ||||
| 2025-07-17 | 13F | Clay Northam Wealth Management, LLC | 53 457 | 0,00 | 1 989 | 12,18 | ||||
| 2025-07-29 | 13F | Private Trust Co Na | 2 149 | 29,61 | 80 | 43,64 | ||||
| 2025-08-01 | 13F | Envestnet Asset Management Inc | 815 464 | 4,70 | 30 343 | 17,42 | ||||
| 2025-07-30 | 13F | Princeton Global Asset Management LLC | 497 | 0,00 | 18 | 12,50 | ||||
| 2025-07-17 | 13F | Worth Financial Advisory Group, LLC | 13 703 | −4,17 | 510 | 7,38 | ||||
| 2025-08-08 | 13F | Arvest Bank Trust Division | 1 212 184 | −0,59 | 45 105 | 11,48 | ||||
| 2025-08-08 | 13F | Larson Financial Group LLC | 0 | −100,00 | 0 | |||||
| 2025-07-25 | 13F | PrairieView Partners, LLC | 104 | 0,00 | 0 | |||||
| 2025-07-30 | 13F | Gables Capital Management Inc. | 4 | 0,00 | 0 | |||||
| 2025-08-11 | 13F | TD Waterhouse Canada Inc. | 1 075 | −20,37 | 40 | −11,11 | ||||
| 2025-07-28 | 13F | Frazier Financial Advisors, LLC | 10 | 0,00 | 0 | |||||
| 2025-07-10 | 13F | Wedmont Private Capital | 8 000 | 0,00 | 298 | 17,32 | ||||
| 2025-05-15 | 13F | Alexis Investment Partners, LLC | 0 | −100,00 | 0 | |||||
| 2025-08-12 | 13F | Global Retirement Partners, LLC | 8 068 | 19,03 | 300 | 38,89 | ||||
| 2025-08-29 | 13F | Centaurus Financial, Inc. | 4 200 | 11,26 | 0 | |||||
| 2025-07-18 | 13F | SigFig Wealth Management, LLC | 3 303 512 | −1,07 | 122 659 | 10,43 | ||||
| 2025-04-21 | 13F | Ronald Blue Trust, Inc. | 0 | −100,00 | 0 | −100,00 | ||||
| 2025-07-22 | 13F | Coastal Investment Advisors, Inc. | 0 | −100,00 | 0 | |||||
| 2025-08-12 | 13F | Change Path, LLC | 11 209 | −2,96 | 417 | 8,88 | ||||
| 2025-07-25 | 13F | Atria Wealth Solutions, Inc. | 13 771 | −55,86 | 512 | −50,53 | ||||
| 2025-08-13 | 13F | Colonial Trust Co / SC | 208 | 0,00 | 8 | 16,67 | ||||
| 2025-05-15 | 13F/A | Orion Portfolio Solutions, LLC | 10 612 | 40,11 | 352 | 46,06 | ||||
| 2025-07-08 | 13F | Nbc Securities, Inc. | 455 | 0,00 | 0 | |||||
| 2025-07-28 | 13F | BRYN MAWR TRUST Co | 4 410 | −9,59 | 164 | 1,86 | ||||
| 2025-08-14 | 13F | Keebeck Wealth Management, LLC | 30 865 | 1 148 | ||||||
| 2025-07-23 | 13F | West Paces Advisors Inc. | 0 | −100,00 | 0 |
Other Listings
| MX:GEM |